Intra-Tumoral Heterogeneity of HER2,
FGFR2, cMET and ATM in Gastric Cancer:
Optimizing Personalized Healthcare through
Innovative Pathological and Statistical
Analysis
Peng Ye1☯, Meizhuo Zhang2☯, Shuqiong Fan1, Tianwei Zhang1, Haihua Fu1, Xinying Su1,
Paul R. Gavine1, Qiang Liu3*, Xiaolu Yin1*
1Asia & Emerging Markets iMed, AstraZeneca R&D, Shanghai, China,2Research & Development Information, AstraZeneca R&D, Shanghai, China,3Department of Pathology, Ren Ji Hospital, School of Medicine, Shanghai Jiao Tong University, Shanghai, China
☯These authors contributed equally to this work.
*[email protected](XY);[email protected](QL)
Abstract
Current drug development efforts on gastric cancer are directed against several molecular targets driving the growth of this neoplasm. Intra-tumoral biomarker heterogeneity however, commonly observed in gastric cancer, could lead to biased selection of patients. MET, ATM, FGFR2, and HER2 were profiled on gastric cancer biopsy samples. An innovative pathological assessment was performed through scoring of individual biopsies against whole biopsies from a single patient to enable heterogeneity evaluation. Following this, false negative risks for each biomarker were estimatedin silico. 166 gastric cancer cases
with multiple biopsies from single patients were collected from Shanghai Renji Hospital. Fol-lowing pre-set criteria, 56 ~ 78% cases showed low, 15 ~ 35% showed medium and 0 ~ 11% showed high heterogeneity within the biomarkers profiled. If 3 biopsies were collected from a single patient, the false negative risk for detection of the biomarkers was close to 5% (exception for FGFR2: 12.2%). When 6 biopsies were collected, the false negative risk approached 0%. Our study demonstrates the benefit of multiple biopsy sampling when con-sidering personalized healthcare biomarker strategy, and provides an example to address the challenge of intra-tumoral biomarker heterogeneity using alternative pathological assessment and statistical methods.
Introduction
Gastric cancer (GC) is one of the most common cancers worldwide, with around half of all cases occurring in Eastern Asia (mainly China), and is the third leading cause of cancer-related death worldwide [1]. Although the incidence is decreasing, most GC cases are diagnosed at an
OPEN ACCESS
Citation:Ye P, Zhang M, Fan S, Zhang T, Fu H, Su X, et al. (2015) Intra-Tumoral Heterogeneity of HER2, FGFR2, cMET and ATM in Gastric Cancer: Optimizing Personalized Healthcare through Innovative Pathological and Statistical Analysis. PLoS ONE 10(11): e0143207. doi:10.1371/journal. pone.0143207
Editor:Daniele Generali, Instituti Ospitalieri di Cremona, ITALY
Received:July 30, 2015
Accepted:November 2, 2015
Published:November 20, 2015
Copyright:© 2015 Ye et al. This is an open access article distributed under the terms of theCreative Commons Attribution License, which permits unrestricted use, distribution, and reproduction in any medium, provided the original author and source are credited.
Data Availability Statement:All relevant data are within the paper.
Funding:AstraZeneca has sponsored this study. The funder provided support in the form of salaries for authors [PY, MZ, SF, TZ, HF, XS, PG and XY] and provided facility and resources for completing this study. The specific roles of these authors are articulated in the "author contributions" section.
advanced stage and prognosis of the disease remains poor [2]. The median survival for meta-static GC is less than one year, while the overall 5-year survival rate is less than 7% [3].
Intra-tumoral heterogeneity is commonly observed in GC. In the 1980’s, de Aretxabalaet al
evaluated 222 samples from 37 GC cases and found a mixture of diploid and aneuploid samples or different aneuploid stemlines in the same case (so called DNA content heterogeneity) in 33% of primary tumors [4]. A similar study by Yonemuraet alshowed a 69% DNA content heterogeneity in 65 resected GC samples [5]. Recently, Yanget alevaluated GC samples from 148 patients and found a heterogeneity rate of 79.3% in human epithelial growth factor recep-tor 2 (HER2) protein overexpression and 44% inHER2gene amplification [6]. Accordingly, the high intra-tumoral heterogeneity observed in GC is likely to contribute to treatment resis-tance and poorer patient prognosis [7,8], and ultimately represents a considerable unaddressed problem faced by clinicians, pathologists, and researchers.
Several molecular targets currently feature in either approved drug treatments or promising therapeutics undergoing clinical development in GC. HER2 plays important roles in the tumorigenesis of breast cancer, ovarian cancer and gastric cancer [9] and Trastuzumab, a monoclonal antibody against HER2, has been approved for the treatment of GC [10]. The mes-enchymal-epithelial transition factor (MET) gene encodes a protein which is the only known receptor for hepatocyte growth factor (HGF) ligand [11].METgene amplification and protein overexpression have been shown to lead to constant activation of the MET signaling pathway which contributes to tumor growth, angiogenesis and metastasis [12]. Several MET inhibitors are currently undergoing GC clinical trials, including Savolitinib (Phase 1 (NCT02252913) [13]) and AMG337 (Phase 2 (NCT02016534)). Similarly, fibroblast growth factor receptor 2 (FGFR2) is also implicated in cell proliferation, differentiation and motility, and amplification of theFGFR2gene plays an important role in the tumorigenesis of GC, thereby underscoring its attraction as drug development target [14–16]. Ataxia telangiectasia mutated (ATM) is a protein kinase belonging to the phosphatidylinositol 3’kinase (PI3K) family, and under normal conditions is activated in response to DNA double-strand breaks [17]. ATM deficiency is related to a high incidence of tissue malignancies [18–20] and ATM-deficient tumors cells are sensitive to poly (ADP-ribose) polymerase-1 (PARP) inhibition, a potential target which has been proposed for the treatment of GC in several previous studies [21–24]. Lynparza, the first US and European-approved PARP inhibitor targeting BRCA1/2 mutant ovarian cancer, is cur-rently undergoing a Phase III clinical trial in GC (NCT01924533) and is employing a patient selection biomarker approach using ATM expression by IHC (publication in press).
In the current era of molecularly targeted drug development, biomarkers are expected to precisely predict clinical response [25]. High tumor heterogeneity however, may lead to a bio-marker detection bias if the samples are obtained from a small tumor region rather than the whole tumor tissue (e.g. surgically resected samples are usually 2 cm x 2cm only). In contrast, biopsy samples are usually obtained from different regions of the whole tumor and are likely to be more representative of the patients’overall biomarker expression status, arguing for their potential to reduce the impact of intra-tumoral heterogeneity on patient selection bias.
In our study, in order to better evaluate intra-tumoral heterogeneity, we employed surgical biopsy as our tumor sampling strategy. In addition, we performed an innovative pathological assessment through scoring of individual biopsies against whole biopsies from single patients. Herein, we also employed statistical methods to estimate the false negative detection risks when analyzing finite numbers of biopsies in order to understand the relationship between the number of biopsies and the risk of selecting a false positive patient for a particular treatment or inclusion in a clinical trial.
Materials and Methods
Patient information
Archived GC biopsy samples were collected from 166 patients who received gastroscopy exam-ination with multiple biopsies from different tumor areas of each patient between 2007 and 2014 at Renji hospital, Shanghai, China. Prior written informed consent was obtained from all patients and the study protocol was approved by the Renji Hospital Institutional Review Board. All samples were reviewed by two trained pathologists for GC diagnosis and forty sam-ples were excluded in the study due to poor tissue quality.
Immunohistochemistry (IHC)
Formalin fixed and paraffin embedded (FFPE) samples were sectioned at 4μm thickness. For
MET staining, a rabbit monoclonal anti-total MET antibody (cMET SP44, Ventana Medical Systems, AZ, USA) was used and the assay was performed on an automatic stainer (Discovery XT, Ventana Medical Systems, AZ, USA). ATM staining was performed using a rabbit mono-clonal anti-ATM antibody (ab32420, Abcam, MA, USA) on an autostainer (Thermo Scientific, MA, USA). HER2 staining was performed using the HercepTest kit (DAKO, Denmark) as per the manufacturer’s instructions on an automatic stainer (Discovery XT, Ventana Medical Sys-tems, AZ, USA).
Fluorescence in situ hybridization (FISH)
The dual-color FISH assay was performed as previously described [26].HER2/CEP17probes were purchased from Vysis (IL, USA; Cat. #30–171060).METandFGFR2probes were pre-pared by labelling BAC (CTD-2270N20 and RP11-62L18, respectively) DNA with Red-dUTP (Enzo Biochem, NY, USA; Cat. #02N23-050),CEP10-Spectrum Green andCEP7-Spectrum Green probes were purchased from Vysis (Cat. # 32–112010 and # 32–132007, respectively) and used as internal controls forFGFR2andMETprobes.
Pathology assessment on biopsies
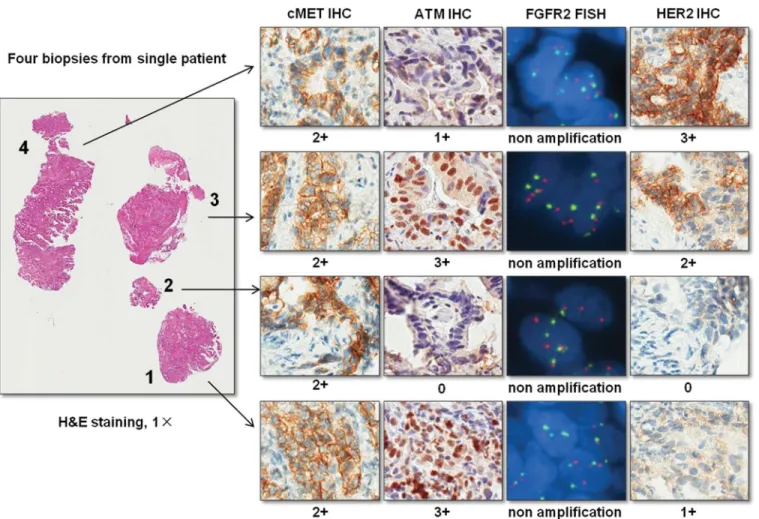
Based on H&E staining, each biopsy with adequate tumor cells (more than 50 tumor cells) was firstly marked by a pathologist. Then biomarker status including IHC and FISH staining of MET, ATM, FGFR2 and HER2 were evaluated on each biopsy. Individual scores for each bio-marker were given to each biopsy (Fig 1).
According to MetMab trial in GC (NCT01662869), for MET IHC staining, a biopsy show-ing IHC 3+ is defined as positive; for MET FISH, biopsy showshow-ingMETgene average copy number5 is defined as positive. Since the ongoing trial for another MET inhibitor,
AZD6094 (NCT02449551), usesMETgene average copy number4 as cut off for single agent treatment arm on GC patients, we further divided the MET FISH negative group into two sub-groups (METgene average copy number4 and<5, andMETgene average copy
number<4). For ATM IHC staining, biopsy showing IHC 0 is defined as negative according to Olaparib trial (NCT01063517). For FGFR2 FISH, biopsy showingFGFR2gene amplification (average copy number6) is defined as positive according to trials of AZD4547
(NCT01457846) and dovitinib (NCT01719549). For HER2, biopsy showing HER2 IHC 3+ or HER2 IHC 2+ plusHER2gene amplification is defined as positive according to ToGA trial (NCT01041404).
Heterogeneity degree assessment
After pathologist’s review, the degree of biomarker heterogeneity was determined according to the following criteria:
High heterogeneity:<25% of biopsies with MET IHC 3+,METgene amplification, ATM IHC 0,FGFR2gene amplification, or HER2 positivity.
Medium heterogeneity: 25% ~ 50% of biopsies with MET IHC 3+,METgene amplification, ATM IHC 0,FGFR2gene amplification, or HER2 positivity.
Low heterogeneity:50% biopsies with MET IHC 3+,METgene amplification, ATM IHC 0,FGFR2gene amplification, or HER2 positivity.
For MET IHC, MET FISH, FGFR2 FISH, and HER2 positivity, the mean percentages of pos-itive biopsies in an individual case among the pospos-itive cases were calculated. For ATM IHC, the mean percentage of ATM IHC negative biopsies in an individual case amongst cases with at least one ATM negative biopsy was calculated. The 95% confidence intervals of the above mean values were assessed by bootstrapping.
False negative detection risk assessment
For each biomarker and a predefined number of biopsiesn(0<n<maximum number of biopsies from a sample), all possible scenarios of choosingnbiopsies from each sample and
Fig 1. Pathological assessment of biomarker status on each individual biopsy.This is an example case which shows the individual score given to each biopsy for each biomarker. In addition, the figure also shows the heterogeneity of biomarker status between different biopsies in the same case.
making a determination of the biomarker’s status for the sample based on thenchosen biopsies were generated computationally.
Based on the scenarios enumerated above, the risks of false negative detection were assessed. For MET IHC, MET FISH, FGFR2 FISH, and HER2 positivity, the risk of false negative detec-tion withnbiopsies from each sample was defined as the expected number of the ratio between the number of positive samples that have negative detection results withnbiopsies and the total number of positive samples. For ATM IHC, the false negative detection risk withn biop-sies from each sample was defined as the expected value of the ratio between the number of non-negative samples with all negative biopsies withnbiopsies from each sample, and the total number of ATM non-negative samples.
All computations were exact except ATM IHC with one biopsy from each sample because of the extremely large number of possible scenarios. For ATM IHC with one biopsy from each sample, the risk of false negative detection was estimated by taking a random subset of 30 non-negative samples without replacement at a time, computing the risk of false non-negative detection in the subset, repeating the process 22,000 times and taking an average of the risks of false neg-ative detection from the 22,000 random subsets. In addition, the 95% Confidence Interval of this estimated risk was reported.
Results
Overview of GC biopsy numbers in clinical samples
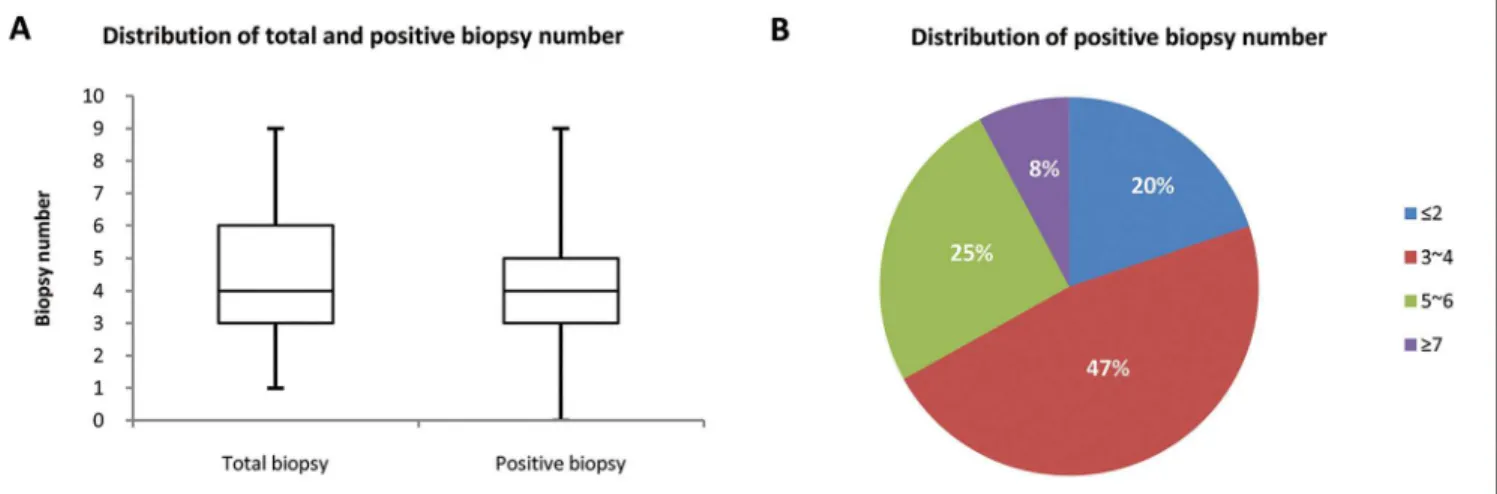
In this cohort, the number of biopsy samples from a single patient ranged from 1 to 9, with the median of both total and positive biopsies (with tumor cells) at 4. The positive biopsy numbers were slightly less than the total biopsy numbers. Cases with 3~4 and 5~6 positive biopsies accounted for 47% and 25% respectively of all the samples collected (Fig 2).
Heterogeneity degree and false negative assessment
In the 18 MET IHC positive cases (Fig 3A), 61% of the cases showed low heterogeneity, while 33% showed medium and 5.5% showed high heterogeneity. The mean percentage of MET posi-tive biopsies in an individual case amongst those 18 posiposi-tive cases was 65.78% (95% CI:
Fig 2. Overview of biopsy number in clinical samples. (A) Distribution of total and positive biopsy number.In this Chinese GC cohort, total biopsy numbers range from 1 to 9, with a median of 4. Positive biopsy (biopsy with tumor) is slightly lower than total biopsy number.(B) Distribution of positive biopsy number.Majority of biopsy numbers fall into 3~4 (47%) and 5~6 (25%).
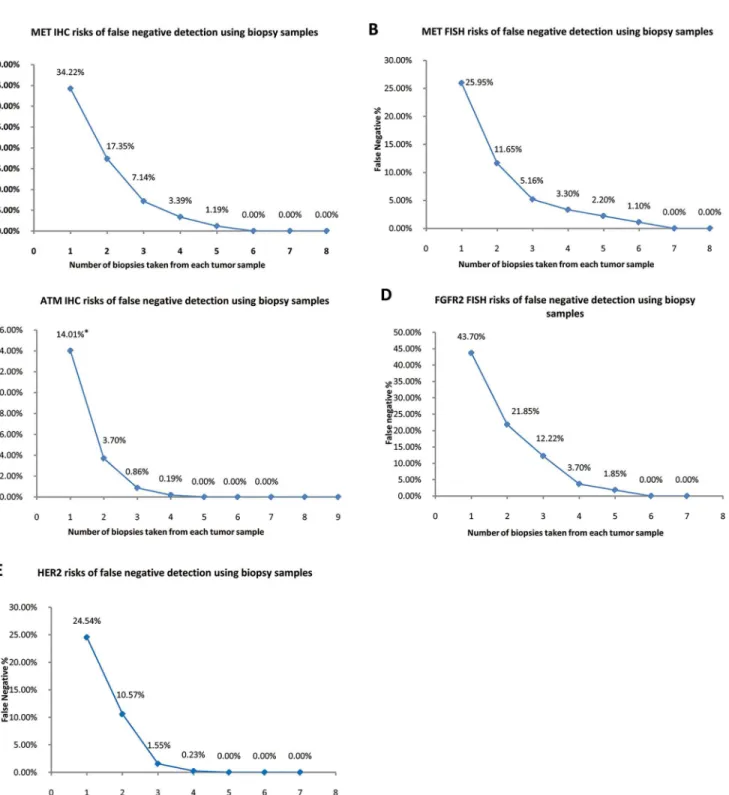
52.14%–79.60%). The MET false negative detection rate was estimated at around 3.39% with 4 biopsies and approached 0% when sampling 6 biopsies (Fig 4A).
In the 13 MET FISH positive cases (Fig 3B), 77% of the cases showed low heterogeneity, while 15% showed medium and 8% showed high heterogeneity. The mean percentage of MET FISH positive biopsies in an individual case amongst those 13 positive cases was 74.05% (95%
Fig 3. An illustration of heterogeneity distribution of each biomarker.Heterogeneity distribution of MET protein expression(A),METaverage gene copy number(B), ATM protein expression(C),FGFR2amplification(D), and HER2 positivity(E). AMP: amplification. AVG: average copy number.
CI: 57.53%–89.10%). The MET FISH false negative detection rate was estimated at around 3.30% with 4 biopsies and approached 0% when sampling 7 biopsies (Fig 4B). In addition, sig-nificant correlation was found between MET IHC score and MET FISH results (p<0.01,κ= 0.62, Fisher’s exact test)
Fig 4. Risk assessment against different biopsy numbers in each biomarker.The risks of false negative detection along with different biopsy numbers in MET IHC(A), MET FISH(B), ATM IHC(C), FGFR2 FISH(D), and HER2(E).Note:*Estimated by resampling, 95% CI: 7.5%–20.94%.
In the 58 cases with at least one ATM negative biopsy (Fig 3C), 62% of the cases showed low heterogeneity, while 35% showed medium and 3.6% showed high heterogeneity. The mean percentage of ATM IHC negative biopsies in an individual case amongst those 58 cases was 63.07% (95%CI: 54.93%–71.39%). The ATM IHC false negative detection rate was estimated at around 0.19% with 4 biopsies, and approached 0% with 5 biopsies (Fig 4C).
In the 9 FGFR2 FISH positive cases, 56% of the cases showed low heterogeneity, while 33% showed medium and 11% showed high heterogeneity (Fig 3D). The mean percentage of FGFR2 FISH positive biopsies in an individual case amongst those 9 positive cases was 56.30% (95%CI: 36.85%–76.85%). The FGFR2 FISH false negative detection rate was estimated at around 3.70% with 4 biopsies and approached 0% with 6 biopsies (Fig 4D).
In the 32 HER2 positive cases, 78% of the cases showed low heterogeneity, while 22% showed medium heterogeneity and none of the cases showed high heterogeneity (Fig 3E). The mean percentage of HER2 positive biopsies in an individual case amongst those 32 positive cases was 75.16% (95%CI: 65.88%–85.11%). The HER2 false negative detection rate was esti-mated at around 0.21% with 4 biopsies and approached 0% with 5 biopsies (Fig 4E).
Discussion
Intra-tumoral biomarker heterogeneity has long been an issue in the selection of patients for clinical trials and therefore, understanding tumor heterogeneity is crucial to the successful deployment of a personalized healthcare biomarker (PHB) strategy. However, few studies have so far addressed this problem and there is no standardized strategy in measuring the degree of tumor heterogeneity. In this study, we took a novel approach by scoring each individual biopsy and calculating the level of heterogeneity within each case. Our results showed that high levels of heterogeneity were only found in 0 ~ 11% of the positive (or negative for ATM) cases, while most positive cases (56% ~ 78%) showed low heterogeneity, indicating a relatively low level of heterogeneity for our selected biomarkers in this cohort of GC cases.
In addition, we also performed false negative assessments for each biomarker to estimate the false negative rates associated with collecting various numbers of biopsies. Results showed that when 3 or more biopsies were collected, the false negative risks were close to 5% for all tested biomarkers (7.14%, 5.16%, 0.86%, and 1.41% respectively for MET IHC, MET FISH, ATM IHC, and HER2). This number (3–4 biopsies) is roughly equivalent to the average num-ber of biopsies collected in clinical practice for this cohort and as such, indicates the relatively low false negative risk associated with these biomarkers in our cohort. One exception that FGFR2 FISH showed a higher false negative rate (12.2% false negative rate for 3 biopsies), could be due to the limited FGFR2-positive sample size (9 positive samples). When a total of 6 biopsies were collected from a single patient, the false negative risk for MET, ATM, FGFR2 and HER2 approached 0% in this cohort. These results provide an example of how increasing biopsy numbers could be used to address the challenge of biomarker heterogeneity in deploy-ing clinical patient selection approaches.
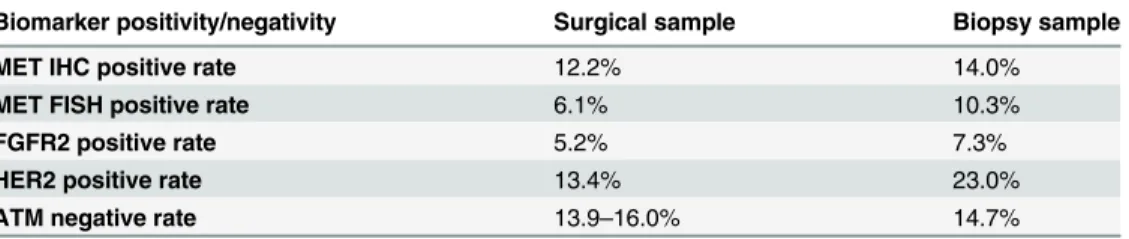
Finally, we have also compared the positivity rate (or negativity rate for ATM) of the bio-markers detected in this cohort of biopsy samples with the surgical samples from our previous studies (Table 1). With the exception of ATM, both biopsy and surgical samples were collected from the same local hospital. Results showed that although positivity rates are higher (for ATM, negativity rates are lower) in biopsy samples, the overall results in biopsy samples were similar to surgical samples. This increase in positivity rate (or decrease in negativity rate for ATM) is likely explained by the detection of positive cases using multiple biopsies which were missed using previous sampling strategies (ie. surgical resections).
Taken together, this study has addressed the challenge of tumor heterogeneity from an innovative angle by using biopsies as the tumor sampling approach and giving individual bio-marker scores to each biopsy. Our results show a relatively low level of heterogeneity across the biomarkers analyzed in this cohort. Nevertheless, the degree of heterogeneity within other patient cohorts may be different and should be analyzed on a case-by-case basis. Furthermore, our results showed a decrease in the rate of false negative detection corresponding with an increase in the biopsy number for all biomarkers tested herein, demonstrating the benefit of multiple biopsy sampling and serving as an example of addressing intra-tumoral heterogeneity using statistical methods.
Acknowledgments
We thank AstraZeneca for sponsoring this study.
Author Contributions
Conceived and designed the experiments: XY. Performed the experiments: PY XY SF TZ XS HF. Analyzed the data: MZ. Contributed reagents/materials/analysis tools: QL. Wrote the paper: XY PY PG.
References
1. Ferlay J, Soerjomataram I, Dikshit R, Eser S, Mathers C, Rebelo M, et al. Cancer incidence and mortal-ity worldwide: sources, methods and major patterns in GLOBOCAN 2012. Int J Cancer. 2015; 136: E359–386. doi:10.1002/ijc.29210PMID:25220842
2. Pourhoseingholi MA, Vahedi M, Baghestani AR. Burden of gastrointestinal cancer in Asia; an overview. Gastroenterol Hepatol Bed Bench. 2015; 8:19–27. PMID:25584172
3. Power DG, Kelsen DP, Shah MA. Advanced gastric cancer—slow but steady progress. Cancer Treat Rev. 2010; 36:384–392. doi:10.1016/j.ctrv.2010.01.005PMID:20176443
4. de Aretxabala X, Yonemura Y, Sugiyama K, Hirose N, Kumaki T, Fushida S, et al. Gastric cancer het-erogeneity. Cancer. 1989; 63:791–798. PMID:2914285
Table 1. Comparison of biomarker positive/negative rates using either surgical or biopsy samples. The positive/negative rate for each biomarker is comparable between the biopsy samples in this study and surgical samples profiled in our previous studies, including ATM [29] and other biomarkers [26]. A slight increase in positive rates for the biomarkers (or decrease in negative rate for ATM) was observed, which could possibly be explained by the detection of positive samples which were previously missed when analyz-ing surgical samples due to intra-tumoral heterogeneity. Both biopsy and surgical samples were collected from the same local hospital [26], except for ATM [29].
Biomarker positivity/negativity Surgical sample Biopsy sample
MET IHC positive rate 12.2% 14.0%
MET FISH positive rate 6.1% 10.3%
FGFR2 positive rate 5.2% 7.3%
HER2 positive rate 13.4% 23.0%
ATM negative rate 13.9–16.0% 14.7%
5. Yonemura Y, Matsumoto H, Ninomiya I, Ohoyama S, Kimura H, de Aletxabala X, et al. Heterogeneity of DNA ploidy in gastric cancer. Anal Cell Pathol. 1992; 4:61–67. PMID:1550795
6. Yang J, Luo H, Li Y, Li J, Cai Z, Su X, et al. Intratumoral heterogeneity determines discordant results of diagnostic tests for human epidermal growth factor receptor (HER) 2 in gastric cancer specimens. Cell Biochem Biophys. 2012; 62:221–228. doi:10.1007/s12013-011-9286-1PMID:21927816
7. Gerlinger M, Swanton C. How Darwinian models inform therapeutic failure initiated by clonal heteroge-neity in cancer medicine. Br J Cancer. 2010; 103:1139–1143. doi:10.1038/sj.bjc.6605912PMID: 20877357
8. McGranahan N, Burrell RA, Endesfelder D, Novelli MR, Swanton C. Cancer chromosomal instability: therapeutic and diagnostic challenges. EMBO Rep. 2012; 13:528–538. doi:10.1038/embor.2012.61 PMID:22595889
9. Tai W, Mahato R, Cheng K. The role of HER2 in cancer therapy and targeted drug delivery. J Control Release. 2010; 146:264–275. doi:10.1016/j.jconrel.2010.04.009PMID:20385184
10. Bang YJ, Van Cutsem E, Feyereislova A, Chung HC, Shen L, Sawaki A, et al. Trastuzumab in combina-tion with chemotherapy versus chemotherapy alone for treatment of HER2-positive advanced gastric or gastro-oesophageal junction cancer (ToGA): a phase 3, open-label, randomised controlled trial. Lan-cet. 2010; 376:687–697. doi:10.1016/S0140-6736(10)61121-XPMID:20728210
11. Naldini L, Vigna E, Narsimhan RP, Gaudino G, Zarnegar R, Michalopoulos GK, et al. Hepatocyte growth factor (HGF) stimulates the tyrosine kinase activity of the receptor encoded by the proto-onco-gene c-MET. Oncoproto-onco-gene. 1991; 6:501–504. PMID:1827664
12. Gherardi E, Birchmeier W, Birchmeier C, Vande Woude G. Targeting MET in cancer: rationale and progress. Nat Rev Cancer. 2012; 12:89–103. doi:10.1038/nrc3205PMID:22270953
13. Gavine PR, Ren Y, Han L, Lv J, Fan S, Zhang W, et al. Volitinib, a potent and highly selective c-Met inhibitor, effectively blocks c-Met signaling and growth in c-MET amplified gastric cancer patient-derived tumor xenograft models. Mol Oncol. 2015; 9:323–333. doi:10.1016/j.molonc.2014.08.015 PMID:25248999
14. Xie L, Su X, Zhang L, Yin X, Tang L, Zhang X, et al. FGFR2 gene amplification in gastric cancer predicts sensitivity to the selective FGFR inhibitor AZD4547. Clin Cancer Res. 2013; 19:2572–2583. doi:10. 1158/1078-0432.CCR-12-3898PMID:23493349
15. Lee J, Ou SH. Towards the goal of personalized medicine in gastric cancer—time to move beyond HER2 inhibition. Part II: Targeting gene mutations and gene amplifications and the angiogenesis path-way. Discov Med. 2013; 16:7–14. PMID:23911227
16. Su X, Zhan P, Gavine PR, Morgan S, Womack C, Ni X, et al. FGFR2 amplification has prognostic signif-icance in gastric cancer: results from a large international multicentre study. Br J Cancer. 2014; 110:967–975. doi:10.1038/bjc.2013.802PMID:24457912
17. Lee JH, Paull TT. Activation and regulation of ATM kinase activity in response to DNA double-strand breaks. Oncogene. 2007; 26:7741–7748. PMID:18066086
18. Shiloh Y. ATM and related protein kinases: safeguarding genome integrity. Nat Rev Cancer. 2003; 3:155–168. PMID:12612651
19. Inskip HM, Kinlen LJ, Taylor AM, Woods CG, Arlett CF. Risk of breast cancer and other cancers in het-erozygotes for ataxia-telangiectasia. Br J Cancer. 1999; 79:1304–1307. PMID:10098776
20. Ye Q, Chen L, Yin X, Liu YJ, Ji Q, Zhao E. Development of serous ovarian cancer is associated with the expression of homologous recombination pathway proteins. Pathol Oncol Res. 2014; 20:931–938. doi: 10.1007/s12253-014-9776-8PMID:24752797
21. Gilardini Montani MS, Prodosmo A, Stagni V, Merli D, Monteonofrio L, Gatti V, et al. ATM-depletion in breast cancer cells confers sensitivity to PARP inhibition. J Exp Clin Cancer Res. 2013; 32:95. doi:10. 1186/1756-9966-32-95PMID:24252502
22. Kubota E, Williamson CT, Ye R, Elegbede A, Peterson L, Lees-Miller SP, et al. Low ATM protein expression and depletion of p53 correlates with olaparib sensitivity in gastric cancer cell lines. Cell Cycle. 2014; 13:2129–2137. doi:10.4161/cc.29212PMID:24841718
23. Guo XN, D.H. S, Cheng WX, Bai Y, Ni XZ, Shen DP, et al. ATM deficiency sensitizes gastric cancer cells to the PARP inhibitior olaparib. In: In PressMol Cancer Ther 8(12 Suppl):B42, 2009.
24. Min A, Im SA, Yoon YK, Song SH, Nam HJ, Hur HS, et al. RAD51C-deficient cancer cells are highly sensitive to the PARP inhibitor olaparib. Mol Cancer Ther. 2013; 12:865–877. doi:10.1158/1535-7163. MCT-12-0950PMID:23512992
26. Liu YJ, Shen D, Yin X, Gavine P, Zhang T, Su X, et al. HER2, MET and FGFR2 oncogenic driver alter-ations define distinct molecular segments for targeted therapies in gastric carcinoma. Br J Cancer. 2014; 110:1169–1178. doi:10.1038/bjc.2014.61PMID:24518603
27. Feng Y, Ma PC. Anti-MET targeted therapy has come of age: the first durable complete response with MetMAb in metastatic gastric cancer. Cancer Discov. 2011; 1:550–554. doi: 10.1158/2159-8290.CD-11-0289PMID:22586678
28. Cunningham D, Bang YJ, Tabemero J, Shah MA, Lordick F, Hack SP. MetGastric: A randomized phase III study of onartuzumab (MetMAb) in combination with mFOLFOX6 in patients with metastatic HER2-negative and MET-positive adenocarcinoma of the stomach or gastroesophageal junction. In: In PressJ Clin Oncol 31, 2013 (suppl; abstr TPS4155), 2013.