Abstract—The identification of transcription factor binding sites (TFBSs) is important for understanding the genetic regulatory system, but weak conservation of TFBSs poses a challenge in computational biology. In this study, we propose a method based on the Ant Colony Optimization (ACO) and Expectation Maximization (EM) algorithm to discover DNA motifs (collections of TFBSs) in a set of bio-sequences. In our method, ACO builds candidate motifs to search for putative binding sites amid the given sequences. The EM algorithm is then applied to maximize the likelihood of a motif model being constructed from the corresponding binding sites. In ACO, each artificial ant mimics the foraging behavior of social insects to construct a possible motif by sensing the pheromones laid on each nucleotide. Due to stability issues with metaheuristic approaches, we incorporate the EM algorithm in our method to improve the reliability of binding site predictions. In the final step, a statistically-based procedure is applied to refine the predictions for compliance with real biological conditions. Experiments conducted on real test datasets indicate that the proposed method identifies binding sites with higher accuracy and reliability than two other motif discovery tools, namely GAME and GALF.
Index Terms—Motif Discovery, TFBS Identification, Ant Colony Optimization, Expectation Maximization
I. INTRODUCTION
ENE expression is regulated by the binding of regulatory proteins, called Transcription Factors (TFs) [1], to their corresponding binding sites. TFs bind to specific DNA sequences, namely Transcription Factor Binding Sites (TFBSs) [2], [3], to initialize, assist, or suppress transcriptional activity. TFBSs are usually small DNA sequences in the range of 6 to 30 bps and mostly reside in the cis-regulatory regions which are usually 100-3000 bps upstream of the transcription start sites. Interaction of TFBSs and TFs has a strong influence on the transcription of DNA into RNA and consequently on gene expression. Thus identification of TFBSs is a crucial part of deciphering the underlying mechanism of genetic regulation.
As of now, the most accurate and reliable method for detecting TFBSs remains biological experiments such as
Cheng-Hong Yang is with the Department of Electronic Engineering, National Kaohsiung University of Applied Sciences, Kaohsiung, Taiwan. He is also with the Department of Network Systems, Toko University, Chiayi, Taiwan. (phone: 886-7-381-4526#5639; e-mail: [email protected]).
Yu-Tang Liu is with the Department of Electronic Engineering, National Kaohsiung University of Applied Sciences, Kaohsiung, Taiwan. (e-mail: [email protected]).
Li-Yeh Chuang is with the Department of Chemical Engineering, I-Shou University, Kaohsiung, Taiwan.
DNAse footprinting assay [4] and Electrophoretic Mobility Shift Assay (EMSA) [5]. However, these methods are laborious and time-consuming. With rapid advances in biotechnology and large amounts of sequencing data, computational strategies for de novo TFBS identification are now a viable choice for pre-screening and prediction of unknown DNA motifs. Given a set of co-expressed / co-regulated sequences cut out upstream of the genes, the goal of de novo TFBS identification is to find a collection of short fragments that could be recognized by a TF’s DNA binding domain(s). A pattern generalized from the collection, i.e., a DNA motif, can be later used to search for binding sites bound by the specific TF according to similarities to the obtained motif. Recently, the Chromatin immunoprecipitation (ChIP) [6] experimental technique uses microarray technology to measure the binding of specific proteins to their associated genomic regions in a high-throughput manner. The generated sequence data will serve as a reliable source for motif discovery.
However, computational approaches to DNA motif discovery face two types of challenges. First, TFBSs are typically very short in comparison to upstream sequences (hundreds to thousands of bases). Second, the motif could be weakly conserved due to evolution and mutation. Given these considerations, both simple string comparison methods and exhaustive search of all combinations are unable to effectively provide an accurate identification of TFBSs. Despite these difficulties, over the past few decades, a wide assortment of computational methods has been developed for predicting DNA motifs. The existing methods can be organized into two broad categories according to the representation used for modeling a DNA motif:
(i) Consensus representation employs a DNA sequence to manifest the significant nucleotide at each position in a motif. The mismatch count between a motif instance and the consensus can be used as a simple criterion for evaluation. (ii) Matrix representation uses either a Position Weight Matrix (PWM) or a Position Frequency Matrix (PFM) to demonstrate the conservation of nucleotides in a motif. Information Content (IC) is a widely used measure for evaluating the conservation of a putative motif matrix.
In addition, motif discovery methods can also be classified with respect to the type of search technique employed: (i) enumerative search, (ii) deterministic methods, and (iii) stochastic methods.
(i) Enumerative search is usually applied for consensus representations. Despite the prohibitive computational loading under long motif width conditions, this technique can still provide useful candidates for further analysis. One
DNA Motif Discovery Based on Ant Colony
Optimization and Expectation Maximization
Cheng-Hong Yang,
Member, IAENG
, Yu-Tang Liu, and Li-Yeh Chuang
well-known representative in this category is Weeder [7]. (ii) Deterministic methods such as MEME [8] and Consensus [9] rely on the Expectation Maximization (EM) [10] algorithm to optimize a motif matrix. According to the theory of binding affinity, a motif of real binding sites should possess the highest IC. One obvious disadvantage to these methods is that they are highly-dependent to the initial setting, potentially leading to suboptimal motif predictions.
(iii) Stochastic methods iteratively align a set of TFBSs and generalize a motif matrix from the set. Methods such as BioProspector [11], AlignACE [12], and MotifSampler [13] that use Gibbs sampling [14] can be further categorized as single-point searches, whereas the recently developed evolutionary algorithms (EAs) [15] implemented by the GAME [16] and GALF [17] methods can be classified as population-based searches. Although these methods all perform global search, single-point searching usually requires more iterations for convergence. On the other hand, population-based search maintains a group of cooperative individuals to search for the global optima.
In this study, we propose a motif discovery method based on Ant Colony Optimization (ACO) [18] and the Expectation Maximization (EM) algorithm. ACO is a global optimization metaheuristic originating from research on the foraging behavior of some ant species. Since its introduction, applications to several different NP-hard problems [19] have empirically shown its effectiveness. EM is a standard algorithm widely used for maximum likelihood and maximum a posterior parameter estimation in statistical models. The EM algorithm is used in Consensus, one of the earliest motif discovery methods, and a generalized mixture model was later implemented in MEME. We have modified the ACO algorithm such that each individual ant builds a potential motif using the consensus representation. At each iteration, ACO considers the total contribution from each of the potential motifs built by the ants and increases or decreases the pheromones accordingly. By sensing pheromone levels, the ants have higher probability of constructing a better motif at the next iteration. Given the stochastic nature of metaheuristic algorithms, the results provided by ACO could be further refined. The underlying principle of the EM algorithm guarantees that, starting from an initial setting, the likelihood of missing variables given the observed data only increases or remains even, thus we apply it to maximize the likelihood of ACO’s motif predictions. We have conducted experiments on real biological datasets to evaluate the search capabilities of our method, and the results indicate this combined approach has promise in motif discovery.
II. FORMULATION OF MOTIF DISCOVERY
A. Approaches to Motif Discovery
The methods for motif discovery problems are broadly divided into two categories (i.e., consensus and positional) based on the approaches used to search the solution space. In the case of DNA motif discovery, a set of N sequences S = (S1, S2,…, SN) is given, where each letter is drawn from the finite alphabet Σ = {A, C, G, T}. The objective is to look for a set of w bp long subsequences in the input sequences such that the occurrences of these subsequences cannot be purely justified
by a background model. The two general approaches to the motif discovery problem are as follows:
(i) Consensus Approach: Discovers a string Sc of width w from Σand a set of subsequences M = {m1, m2,…, mN} each of which is of the same width w and extracted from corresponding sequence Si. The objective is to find a set that can minimize the sum of Hamming distances (dH).
∑
= Ni
i c H
S
m
d
1
)
,
(
(1)(ii) Positional Approach: Discovers a set of subsequences M = {m1, m2,…, mN} where each one corresponds to the motif instance from sequence Si according to the set of starting positions A = {a1, a2,…, aN}. Each motif instance mi is a subsequence starting from position ai and of width w in the input sequence Si. The objective is to find a set that can maximize the information content (IC) [20].
∑∑
==
wj b b
b b
p
j
f
j
f
IC
1
)
(
log
)
(
, (2)where fb(j) is the normalized frequency of nucleotide b in column j of all motif instances. The variable pb records the background frequency (calculated from S or the whole genome) of the same nucleotide.
B. Relation between the Two Approaches
In the consensus approach, a string representing the motif is used to scan the input sequences in search of subsequences similar to it. Theses subsequences represent a set of putative motif sites, akin to what would be provided by the positional approach. Similarly, a set of subsequences given by the positional approach can be summarized with a consensus string. Realizing that the motifs resulting from the consensus or the positional approaches are interchangeable, the choice between these two approaches is dependent upon the implementation of a motif discovery method. We have decided to use the consensus approach in our method because it is a concise way to portray a motif and a sensible choice when considering the underlying mechanism of ACO and, also, this approach searches the solution space extensively, raising the possibility that the global optima may be discovered.
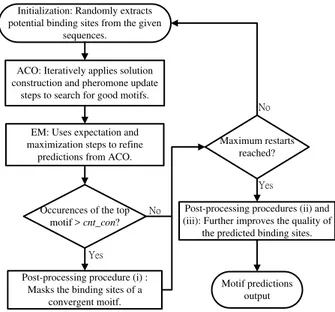
III. THE PROPOSED METHOD
algorithm into the motif discovery framework. The EM algorithm is itself a powerful motif discovery method that can guarantee to increase the likelihood of a motif model given an initial condition, i.e., a set of binding sites. However, computation of EM relies heavily on the initial conditions, which is the reason we combined ACO and EM to perform motif discovery: ACO is effective in global search while EM is efficient at maximizing likelihood of parameter estimates, which makes these two algorithms fairly complementary. Finally, we designed a suite of post-processing procedures to further improve motif predictions.
A. Ant Colony Optimization for Motif Discovery
ACO is derived from the research on the foraging behavior of ants which communicate with each other under a model termed stigmergy. Stigmergy has two major properties: the communication is mediated by the exchange of information through the modification of the environment; and the information can only be accessed when an ant visits the locus. In many ant species, a substance called pheromone is deposited on the ground when ants walk to and from a food source. The presence of pheromone is perceived by other ants and paths carrying higher concentrations of pheromone tend to be followed more often. Thus, ants are remarkably efficient when it comes to choosing the shortest route between a food source and their nest.
ACO was formalized into a metaheuristic for combinatorial optimization problems by Dorigo and co-workers [18]. Under the ACO algorithmic framework the optimization process is composed of two parts: (1) construction of solutions and (2) pheromone updating. In step (1), each artificial ant constructs a solution by choosing elements from a finite set of available solution components. In step (2), according to each solution’s quality, the pheromone levels associated with promising solutions are increased and those associated with inferior ones are decreased. This process is actually implemented by decreasing all the pheromone values through the pheromone evaporation process and then increasing the pheromone levels associated with good solutions.
Since the introduction of the first ant algorithm, ACO has grown into a whole family of algorithms. In this study, we choose one of the most successful variants, namely Ant Colony System (ACS) [21], as the backbone of our method. The main characteristic of ACS is the introduction of a local pheromone updating process performed at the end of the construction step. This local pheromone updating process is executed in addition to the original updating process (offline pheromone updating). Equation (3) explains how ACS’s offline pheromone updating is performed,
− ⋅ + ⋅∆
=
otherwise.
best tour, the
to belongs ) , ( if )
1 (
jb
jb jb
jb
b j
τ
τ ρ τ ρ
τ (3)
In (3), τjb is the quantity of pheromone associated with a consensus string having nucleotide b (∈∑) in position j. The parameter ρ (∈ (0, 1]) is the pheromone evaporation rate. ∆τjb is the pheromone amount carried by an ant which constructs a solution consisting of nucleotide b in position j. The local pheromone updating is performed according the following equation:
0
)
1
(
ϕ
τ
ϕ
τ
τ
jb=
−
⋅
jb+
⋅
, (4)where ϕ∈ (0, 1] is the pheromone decay coefficient and τ0 is the initial value of the pheromone.
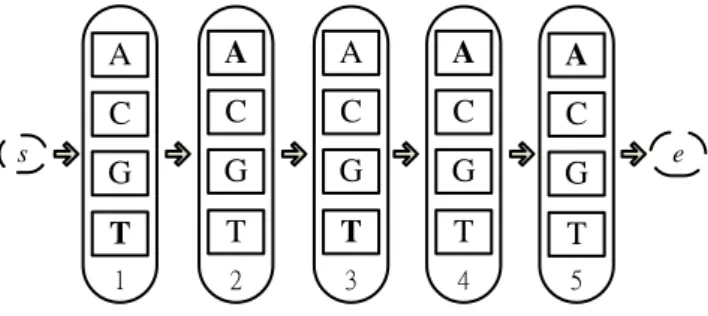
To formulate a motif discovery problem under the ACO framework, we have elected to use an ant’s route for encoding the consensus string. For example, a “TATAA” consensus string is encoded as illustrated in Fig. 1. The route starts with a null initial node s and each subsequent edge corresponds to one nucleotide in the consensus string. The route is represented by s→T→A→T→A→A→e, where e is the null final node and TATAA are five edges chosen by the ant. The iterative ACO procedure in our method works as follows: The ants first build a set of potential consensuses by randomly extracting subsequences from the input sequences. Each consensus string is compared to the input sequences to find a set of potential binding sites which minimizes the sum of hamming distances as shown in (1). The set of binding sites is used to compute the IC value by (2), and we assume that the quality of a constructed consensus is directly proportional to the IC value. Then ACO applies (3) and (4) to update the pheromone levels and the added pheromone for each constructed consensus is equal to the corresponding IC value.
B. Expectation Maximization
In the motif discovery problem, a set of observed data (mostly sequences from the upstream region of co-expressed or co-regulated genes) is given and we seek the missing positions for motif instances. The EM algorithm finds the maximum likelihood estimate (MLE) of the unknown motif sites conditional to the observed data by iteratively applying the following two steps:
(i) Expectation step: Calculate the expected value of the log likelihood function given the observed data under the current estimate of the missing motif sites.
(ii) Maximization step: Find the positions of motif instances that can maximize the log likelihood function.
Although the EM algorithm does not decrease the value of the likelihood function of the observed data, the process does not guarantee convergence to the maximum likelihood estimator. Thus some heuristic or metaheuristic approaches like random restart, swarm intelligence, and evolutionary computation are needed to reach global maxima. We chose to apply the EM algorithm to the preliminary motif site predictions resulting from the ACO step. We did not fully integrate ACO and EM for two reasons: first, the added computational load is quite heavy; second, the experimental data (not shown here) only demonstrate marginal improvement over the current setting.
5 4
3 2
1
A
G
C
T
e s
A
G
C
T
A
G
C
T
A
G
C
T
A
G
C
T
C. Post-processing Procedures for Motif Site Predictions
Having obtained results from ACO and the EM algorithm, we apply a series of procedures to refine their quality. The post-processing procedures include three components: (i) masking the binding sites of a convergent motif, (ii) site shift, and (iii) addition and removal of putative binding sites. Each procedure is described in detail as follows:
(i) Masking the binding sites of a convergent motif: To cut the computational cost and broaden the motif search, we apply this technique to ensure the proposed method does not repeatedly predict the same motif. The binding sites of the motif with the best fitness value will be hidden when the initial consensus strings are initialized. The detailed implementation uses a count cnt_cov (3, in our case) to indicate how many rounds are required for a motif to be tagged as convergent. With the masking technique, we can start a new round to find additional motifs.
(ii) Site shift: To prevent a common premature convergence scenario where all the predicted binding sites converge to positions some nucleotides apart from the real binding sites, this procedure simultaneously shifts all the predicted sites left or right one to a specific base and replaces the original prediction with the trial that achieves a higher IC value. (iii) Adding and removing putative binding sites: In the ACO and EM steps, we assumed that there would be one binding site per sequence, but this assumption sometimes fails in real biological conditions. We addressed this problem through a statistical approach. First, we defined the similarity score (sim) with the following function:
∑
=
=
wj b
jb jb
p
f
f
sim
1
, (5)
where fjb corresponds to the normalized frequency of nucleotide b appearing at the position j of a motif. The sim score can be used to calculate the similarity of a subsequence to the motif. Therefore we use (5) to compute sim scores of all the binding sites of a predicted motif, and calculate the mean,
median, and standard deviation (std) values for the sim scores. Using these statistics, all input sequences are re-scanned and the subsequences with sim scores higher than “median – std” are added to the set of predicted binding sites. Predicted binding sites with sim scores lower than “mean – std” are removed.
The overall framework of our DNA motif discovery method is illustrated in Fig. 2.
IV. EXPERIMENTS
To evaluate our method, we conducted experiments on eight real datasets previously constructed by the authors of GAME [16]. Most of these datasets are composed of sequences of 200 bps, and the embedded motif instances are within the range of 6-22 bps. Table I lists detailed information about the test datasets. In addition, we compared our method with GAME and GALF [17], two recently developed methods that use the Genetic Algorithm (GA) to approach the motif discovery problem.
The evaluation criteria used here include precision, recall, and F-score. These metrics are formulated as the following equations:
Recall Precision
Recall Precision
F
n n Recall n
n Precision
t c p
c
+ ⋅ ⋅
= −
= =
2 score
and , ,
(6)
where nc is the number of binding sites that were correctly predicted, np is the total number of predicted binding sites, and nt is the total number of actual binding sites. These criteria are of site level comparison, where a correctly predicted binding site is allowed to differentiate from the true site with a shift up to 3 bps. As it can consider both the Precision and the Recall of a predicted motif, the F-score acts as a suitable metric for evaluating the quality of a prediction.
A. Setting of Parameters
To fairly compare each method’s performance, we set the parameters so that the average execution time of our method does not exceed that of GAME or GALF. Therefore, we configured our method as follows: the population has 20 individuals, the maximal generation is set as 100, and the criterion of convergence is that there be no improvement for 50 consecutive generations. Additionally, we have configured both the parameters ρ and ϕ for ACO as 0.8. The results of GAME and GALF reported here are from experiments conducted in [22] where the running configuration is as follows: the population sizes of GAME and GALF are both
Table I THE 8 REAL DATASETS
CREB CRP E2F ERE MEF2 MyoD SRF TBP
N 17 18 25 25 17 17 20 95
# 19 23 27 25 17 21 36 95
w 8 22 11 13 7 6 10 6
L 215 105 200 200 200 200 215 200
N is the number of input sequences, # is the occurrences of binding sites in a dataset, w is the width of embedded binding sites, and L is the length of each input sequence.
Yes
Initialization: Randomly extracts potential binding sites from the given
sequences.
ACO: Iteratively applies solution construction and pheromone update
steps to search for good motifs.
EM: Uses expectation and maximization steps to refine
predictions from ACO.
Post-processing procedures (ii) and (iii): Further improves the quality of
the predicted binding sites. Maximum restarts
reached?
Post-processing procedure (i) : Masks the binding sites of a
convergent moitf.
Motif predictions output Occurences of the top
motif > cnt_con?
Yes
No
No
set at 500 and the maximal generations allowed for GAME and GALF are 3000 and 300, respectively. All the experiments were run 20 times to determine whether the given motif method can produce stable predictions.
B. Results and Discussion
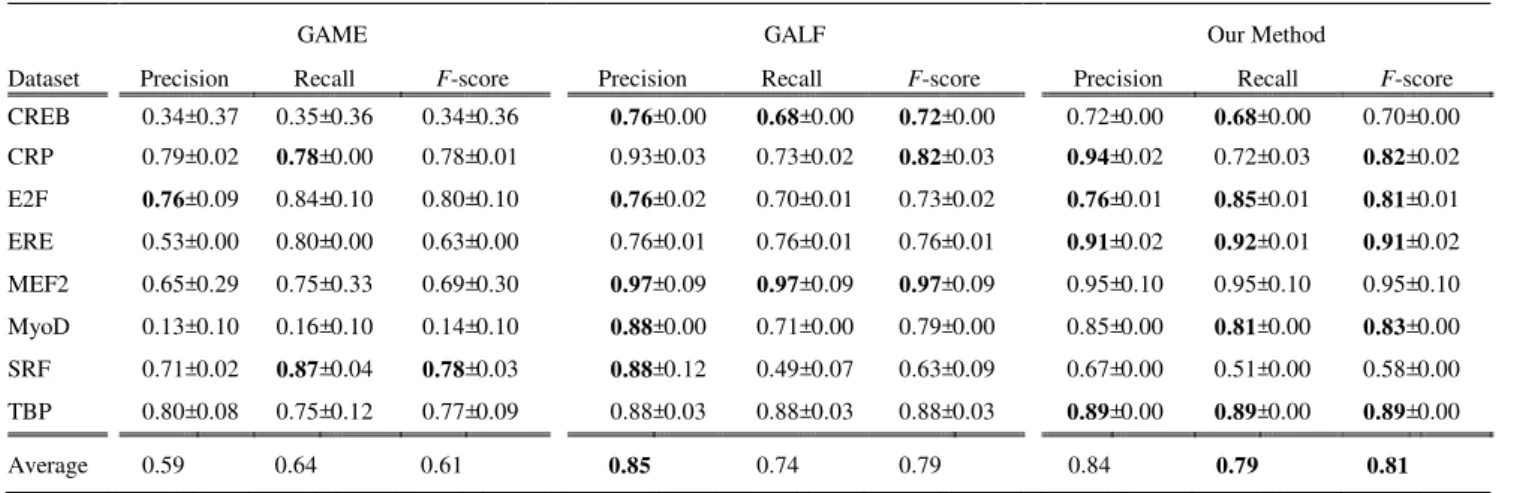
This section compares the performance of our method with GAME and GALF. The evaluation is divided into two categories: average results by each method for the eight datasets and best results achieved in each configuration.
The average performance on the eight datasets is listed in Table II, with both the mean and standard deviation of each experiment calculated from 20 runs. In comparison with GALF, our method predicted motifs of better or equal quality with respect to precision for the CRP, E2F, ERE, and TBP datasets. According to the evaluation based on recall, our method outperformed GALF in six out of the eight datasets, and only provided inferior predictions for the CRP and MEF2 datasets. In comparison with GAME, our method provided predictions of better or equal quality with respect to precision for all the datasets with one exception (the SRF dataset). According to the evaluation based on recall, our method outperformed GAME in six out of the eight datasets, and only provided inferior predictions for the CRP and SRF datasets.
Our method predicted better motifs with higher F-scores than GAME or GALF on five (CRP, E2F, ERE, MyoD, and TBP) of the eight datasets. The average leads of F-scores for these five datasets for GAME and GALF are 0.29 and 0.07, respectively. For the CREB and MEF2 datasets, our method predicted motifs inferior to those from GALF, but still slightly outperformed GAME’s. The results indicate that our method trails the other two methods for the SRF dataset. In summary, the F-scores of the average results show that our method predicts better motifs under most circumstances.
In addition to comparing average performance, we recorded the predicted motifs with the highest F-scores. The best motifs that can possibly be obtained by each method are listed in Table III. The fractions in Table III are written in accordance with (5) while the numeric values in parentheses correspond to the precision and recall. These data show that, for most of the datasets, our method can achieve better motif predictions with the exception of the E2F and TBP datasets. Observation of the predicted motifs with the highest F-scores obtained by our method indicates that they are further improved in the cases of the CREB, CRP, ERE, MEF2, and SRF datasets. Though our method still leads in five out of eight datasets, the lead with respect to the averaged F-scores over GAME and GALF has increased. We note that the SRF
Table III
BEST RESULTS IN TERMS OF F-SCORES ON EIGHT REAL DATASETS
GAME GALF Our Method
Dataset Precision Recall F-score Precision Recall F-score Precision Recall F-score
CREB 14/18 (0.78) 14/19 (0.74) 0.76 13/17 (0.76) 13/19 (0.68) 0.72 14/17 (0.82) 14/19 (0.74) 0.78
CRP 18/21 (0.86) 18/23 (0.78) 0.82 17/18 (0.94) 17/23 (0.74) 0.83 18/18 (1.00) 18/23 (0.78) 0.88
E2F 24/30 (0.80) 24/27 (0.89) 0.84 20/25 (0.80) 20/27 (0.74) 0.77 24/31 (0.77) 23/27 (0.85) 0.81
ERE 20/38 (0.53) 20/25 (0.80) 0.63 19/25 (0.76) 19/25 (0.76) 0.76 25/26 (0.96) 25/25 (1.00) 0.98
MEF2 17/19 (0.89 17/17 (1.00) 0.94 17/17 (1.00) 17/17 (1.00) 1.00 17/17 (1.00) 17/17 (1.00) 1.00
MyoD 10/21 (0.48) 10/21 (0.48) 0.48 15/17 (0.88) 15/21 (0.71) 0.79 17/20 (0.85) 17/21 (0.81) 0.83
SRF 33/45 (0.73) 33/36 (0.92) 0.81 19/20 (0.95) 19/36 (0.53) 0.68 28/36 (0.78) 29/36 (0.80) 0.79
TBP 81/101 (0.80) 81/95 (0.85) 0.83 88/95 (0.93) 88/95 (0.93) 0.93 85/96 (0.89) 85/95 (0.89) 0.89
Average 0.73 0.81 0.76 0.88 0.76 0.81 0.88 0.86 0.87
These results are collected from 20 experiments on each dataset. Bolded part represents predictions that achieve best performance with respect to the specific metric precision, recall, or F-score.
Table II
AVERAGE RESULTS ON EIGHT REAL DATASETS
GAME GALF Our Method
Dataset Precision Recall F-score Precision Recall F-score Precision Recall F-score
CREB 0.34 ± 0.37 0.35 ± 0.36 0.34 ± 0.36 0.76 ± 0.00 0.68 ± 0.00 0.72 ± 0.00 0.72 ± 0.00 0.68 ± 0.00 0.70 ± 0.00
CRP 0.79 ± 0.02 0.78 ± 0.00 0.78 ± 0.01 0.93 ± 0.03 0.73 ± 0.02 0.82 ± 0.03 0.94 ± 0.02 0.72 ± 0.03 0.82 ± 0.02
E2F 0.76 ± 0.09 0.84 ± 0.10 0.80 ± 0.10 0.76 ± 0.02 0.70 ± 0.01 0.73 ± 0.02 0.76 ± 0.01 0.85 ± 0.01 0.81 ± 0.01
ERE 0.53 ± 0.00 0.80 ± 0.00 0.63 ± 0.00 0.76 ± 0.01 0.76 ± 0.01 0.76 ± 0.01 0.91 ± 0.02 0.92 ± 0.01 0.91 ± 0.02
MEF2 0.65 ± 0.29 0.75 ± 0.33 0.69 ± 0.30 0.97 ± 0.09 0.97 ± 0.09 0.97 ± 0.09 0.95 ± 0.10 0.95 ± 0.10 0.95 ± 0.10
MyoD 0.13 ± 0.10 0.16 ± 0.10 0.14 ± 0.10 0.88 ± 0.00 0.71 ± 0.00 0.79 ± 0.00 0.85 ± 0.00 0.81 ± 0.00 0.83 ± 0.00
SRF 0.71 ± 0.02 0.87 ± 0.04 0.78 ± 0.03 0.88 ± 0.12 0.49 ± 0.07 0.63 ± 0.09 0.67 ± 0.00 0.51 ± 0.00 0.58 ± 0.00
TBP 0.80 ± 0.08 0.75 ± 0.12 0.77 ± 0.09 0.88 ± 0.03 0.88 ± 0.03 0.88 ± 0.03 0.89 ± 0.00 0.89 ± 0.00 0.89 ± 0.00
Average 0.59 0.64 0.61 0.85 0.74 0.79 0.84 0.79 0.81
These measurements are averaged separately over eight datasets. Values before ± are the mean of 20 runs and the values following ± indicate
corresponding standard deviation. Bolded part represents predictions that achieve best performance with respect to the specific metric precision, recall, or
dataset poses a problem for our method, but the difference decreases sharply when predicted motifs besides the top prediction are considered.
Overall, these comparisons suggest that our method can provide better predictions for DNA binding sites. In addition, the low standard deviations (the average is less than 0.02 for average results), indicates stable performance despite the stochastic nature of ACO. This achievement could be attributed to an ideal complement provided by the EM algorithm to ACO for finding the putative transcription factor binding sites.
V. CONCLUSIONS
In this study, we propose a motif discovery method based on the cooperation of ACO, the EM algorithm, and a specifically designed post-processing procedure for discovering the transcription factor binding sites. Our method is evaluated with real biological datasets, and the promising results show that our approach can predict binding sites with high precision and recall. Based on the analysis of both the average and best results, in most cases our method outperforms GAME and GALF in accordance with higher F-scores. By integrating both ACO’s stochastic global search ability and EM’s likelihood maximization procedure, our experiments show that this hybrid approach is very promising in addressing DNA motif discovery problems.
In the course of developing this motif discovery method, several issues has attracted our attention. The critical issue is the need to design a more effective fitness function that can distinguish false binding sites from true ones. The widely-used information content (IC) is prone to misleading motif searches into false binding sites, implying that the global search ability of metaheuristics cannot be fully utilized. Thus, a more realistic motif evaluation model giving appropriate consideration to the domain knowledge could provide better motif predictions.
Another issue is the assumption, made in the Ant Colony Optimization (ACO) and Expectation Maximization (EM) process, that there is only one binding site per sequence. This assumption is contradicted by reality under some circumstances, prompting us to design a post-processing procedure specifically for handling situations where motif instances do not exist or appear more than once in some sequences. However, we believe this procedure can be further improved with a more sophisticated mechanism. Considerably improved performance could be achieved by implementing a procedure that can self-adjust the addition and the removal of putative binding sites and by designing an efficient criterion for testing convergence.
REFERENCES
[1] D. S. Latchman, “Transcription factors: an overview,” The International Journal Of Biochemistry & Cell Biology, vol. 29, 1997, pp. 1305-12.
[2] G. D. Stormo, “DNA binding sites: representation and discovery,”
Bioinformatics, vol. 16, 2000, pp. 16-23.
[3] S. E. Halford and J. F. Marko, “How do site-specific DNA-binding proteins find their targets?,” Nucleic Acids Research, vol. 32, 2004, pp. 3040-52.
[4] D. J. Galas and A. Schmitz, “DNAse footprinting: a simple method for the detection of protein-DNA binding specificity,” Nucleic Acids Research, vol. 5, 1978, pp. 3157-70.
[5] M. M. Garner and A. Revzin, “A gel electrophoresis method for quantifying the binding of proteins to specific DNA regions: application to components of the Escherichia coli lactose operon regulatory system,” Nucleic Acids Research, vol. 9, 1981, pp. 3047-60. [6] A. D. Smith, P. Sumazin, D. Das and M. Q. Zhang, “Mining ChIP-chip data for transcription factor and cofactor binding sites,”
Bioinformatics, vol. 21, 2005, pp. i403-12.
[7] G. Pavesi, G. Mauri and G. Pesole, “An algorithm for finding signals of unknown length in DNA sequences,” Bioinformatics, vol. 17, 2001, pp. S207-14.
[8] T. L. Bailey and C. Elkan, “Fitting a mixture model by expectation maximization to discover motifs in biopolymers,” Proceedings / International Conference On Intelligent Systems For Molecular Biology ; ISMB International Conference On Intelligent Systems For Molecular Biology, vol. 2, 1994, pp. 28-36.
[9] G. D. Stormo and G. W. Hartzell, 3rd, “Identifying protein-binding sites from unaligned DNA fragments,” Proceedings Of The National Academy Of Sciences Of The United States Of America, vol. 86, 1989, pp. 1183-7.
[10] A. P. Dempster, N. M. Laird and D. B. Rubin, “Maximum Likelihood from Incomplete Data via the EM Algorithm,” Journal of the Royal Statistical Society. Series B (Methodological), vol. 39, 1977, pp. 1-38. [11] X. Liu, D. L. Brutlag and J. S. Liu, “BioProspector: discovering
conserved DNA motifs in upstream regulatory regions of co-expressed genes,” Pacific Symposium On Biocomputing Pacific Symposium On Biocomputing, vol. 2001, pp. 127-38.
[12] F. P. Roth, J. D. Hughes, P. W. Estep and G. M. Church, “Finding DNA regulatory motifs within unaligned noncoding sequences clustered by whole-genome mRNA quantitation,” Nature Biotechnology, vol. 16, 1998, pp. 939-45.
[13] G. Thijs, et al., “A Gibbs sampling method to detect overrepresented motifs in the upstream regions of coexpressed genes,” Journal Of Computational Biology: A Journal Of Computational Molecular Cell Biology, vol. 9, 2002, pp. 447-64.
[14] S. Geman and D. Geman, “Stochastic Relaxation, Gibbs Distributions, and the Bayesian Restoration of Images,” Pattern Analysis and Machine Intelligence, IEEE Transactions on, vol. PAMI-6, 1984, pp. 721-741.
[15] G. B. Fogel, et al., “Discovery of sequence motifs related to coexpression of genes using evolutionary computation,” Nucleic Acids Research, vol. 32, 2004, pp. 3826-35.
[16] Z. Wei and S. T. Jensen, “GAME: detecting cis-regulatory elements using a genetic algorithm,” Bioinformatics, vol. 22, 2006, pp. 1577-84. [17] T.-M. Chan, K.-S. Leung and K.-H. Lee. “TFBS identification by
position- and consensus-led genetic algorithm with local filtering.” in
GECCO '07: Proceedings of the 9th annual conference on Genetic and evolutionary computation, 2007, pp. 377-384.
[18] M. Dorigo, V. Maniezzo and A. Colorni, “Ant system: optimization by a colony of cooperating agents,” Systems, Man, and Cybernetics, Part B: Cybernetics, IEEE Transactions on, vol. 26, 1996, pp. 29-41. [19] M. Dorigo and T. Stützle, Ant colony optimization, MIT Press, 2004. [20] G. D. Stormo, “Computer methods for analyzing sequence recognition
of nucleic acids,” Annu Rev Biophys Biophys Chem, vol. 17, 1988, pp. 241-63.
[21] L. M. Gambardella and M. Dorigo. “Solving symmetric and asymmetric TSPs by ant colonies.” in Evolutionary Computation, 1996., Proceedings of IEEE International Conference on, 1996, pp. 622-627.