hexandrum
(Royle) Ying in the Qinling Mountains, China
Wei Liu, Dongxue Yin, Jianjun Liu*, Na Li
College of Forestry, Northwest A & F University, Yangling, China
Abstract
Sinopodophyllum hexandrum is an important medicinal plant whose genetic diversity must be conserved because it is endangered. The Qinling Mts. are aS. hexandrumdistribution area that has unique environmental features that highly affect the evolution of the species. To provide the reference data for evolutionary and conservation studies, the genetic diversity and population structure ofS. hexandrum in its overall natural distribution areas in the Qinling Mts. were investigated through inter-simple sequence repeats analysis of 32 natural populations. The 11 selected primers generated a total of 135 polymorphic bands.S. hexandrumgenetic diversity was low within populations (average He= 0.0621), but higher at the
species level (He= 0.1434). Clear structure and high genetic differentiation among populations were detected by using the
unweighted pair group method for arithmetic averages, principle coordinate analysis and Bayesian clustering. The clustering approaches supported a division of the 32 populations into three major groups, for which analysis of molecular variance confirmed significant variation (63.27%) among populations. The genetic differentiation may have been attributed to the limited gene flow (Nm= 0.3587) in the species. Isolation by distance among populations was determined by
comparing genetic distance versus geographic distance by using the Mantel test. Result was insignificant (r= 0.212, P= 0.287) at 0.05, showing that their spatial pattern and geographic locations are not correlated. Given the low within-population genetic diversity, high differentiation among within-populations and the increasing anthropogenic pressure on the species, in situ conservation measures were recommended to preserveS. hexandrumin Qinling Mts., and other populations must be sampled to retain as much genetic diversity of the species to achieve ex situ preservation as a supplement to in situ conservation.
Citation:Liu W, Yin D, Liu J, Li N (2014) Genetic Diversity and Structure ofSinopodophyllum hexandrum(Royle) Ying in the Qinling Mountains, China. PLoS ONE 9(10): e110500. doi:10.1371/journal.pone.0110500
Editor:Raffaella Balestrini, Institute for Sustainable Plant Protection, C.N.R., Italy
ReceivedMay 2, 2014;AcceptedSeptember 16, 2014;PublishedOctober 15, 2014
Copyright:ß2014 Liu et al. This is an open-access article distributed under the terms of the Creative Commons Attribution License, which permits unrestricted use, distribution, and reproduction in any medium, provided the original author and source are credited.
Data Availability:The authors confirm that all data underlying the findings are fully available without restriction. All relevant data are within the paper and its Supporting Information files.
Funding:This work was supported by the program from the Forestry Research Foundation for the Public Service Industry of China (200904004). The funders had no role in study design, data collection and analysis, decision to publish, or preparation of the manuscript.
Competing Interests:The authors have declared that no competing interests exist.
* Email: [email protected]
Introduction
Sinopodophyllum hexandrum (Royle) Ying, family Berberida-ceae, the only species of this genus in China, commonly known as Himalayan mayapple, is an endangered and medicinal perennial herb native to the Himalayan regions at elevations ranging from 2 700 m to 4 500 m [1–4]. Plants provide us with many important medicaments, including anticancer and antiinfective agents [5], and traditional Chinese medicine has contributed to identifying these substances [6]. S. hexandrum is a traditional Chinese medicine that has been used in folk medicine [7]. The roots and rhizomes ofS. hexandrumcontain large amounts of lignans. The most important lignan for human health is arguably the most active cytotoxic aryltetralin lignan, podophyllotoxin, with three times the podophyllotoxin levels compared to the American speciesPodophyllum peltatum[8,9,10], as a precursor for the semi-synthesis of the anticancer pharmaceuticals, such as etoposide (VP-16), teniposide (VM-26), GP-7, NK-611, etopophos, GL-331 and TOP-53 [9–15]. The destructive harvest of these plants addedS. hexandrum to the endangered species list of the Convention on International Trade in Endangered Species of Wild Fauna and
Flora [16].S. hexandrumwas classified as an endangered species (grade 3) in 1987 by the Chinese Plant Red Book [4].
inter-simple sequence repeats (ISSR) and amplified fragment length polymorphism (AFLP) markers [37,38,39], respectively. These reports with same results showed that S. hexandrum
populations had relatively high genetic diversity
(He= 0.2944,0.3377). However, there is a consensus that alpine
plants are faced with pollinator restriction [40]. The unclear extent of the species dispersal mechanisms makes it interesting to study the relationships between populations. Furthermore, many reports about genetic diversity of other medicinal plants, such as Calamagrostis porteri ssp. insperata [41],Aegiceras corniculatum [42], Sonneratia alba [43], Coscinium fenestratum [44], and Lilium pumilum [45], have been published based on the ISSR approach.
Molecular markers are very useful tools for genetic diversity studies. ISSR markers are molecular markers especially suited to genetic polymorphisms analyses of species without available sequence information [46,47]. Studies on the population relation-ships, genetic diversity and conservation of S. hexandrum in Qinling Mts. are requisite because climate change and local overexploitation may cause unknown endangering mechanisms. The present study aims to establish management strategies for the conservation genetics ofS. hexandrumby (1) examining the levels of genetic variability within and amongS. hexandrumpopulations sampled from Qinling Mts. where historical records showed S. hexandrum having grown naturally, (2) assessing the possible factors that affect the genetic variation observed, and (3) comparing these within and among S. hexandrum populations with data published for itself or other plant taxa with similar characteristics.
Materials and Methods
Ethics statement
The endangered species were collected, and research activities were scientifically conducted under the permits issued by the local forestry department. A detailed description of the experimental material collection and procedures is provided. The experimental procedures were approved by the Ethics Committee for Plant Experiments of Northwest A & F University and the State Forestry Administration, P. R. China. The names of the authorities that issued the permit for each location were listed in Table S1 in Text S1.
Study area
This study was performed in the Qinling Mts. (32u419to 34u599 N, 103u549to 110u349E), which are located in central of China (Figure 1). The Qinling Mts., a 1 500 Km mountain chain, run east–west and act as an important watershed divider between two great Chinese rivers, the Yangtze River and the Yellow River, which constitute a transitional zone between the northern subtropical zone and warm-temperate zone. The Qinling Mts. were considered to be a biodiversity hotspot in China [48]. As one of the distribution areas of S. hexandrum, Qinling Mts. have unique environmental features which have high impact on the evolution of the species.
Plant materials
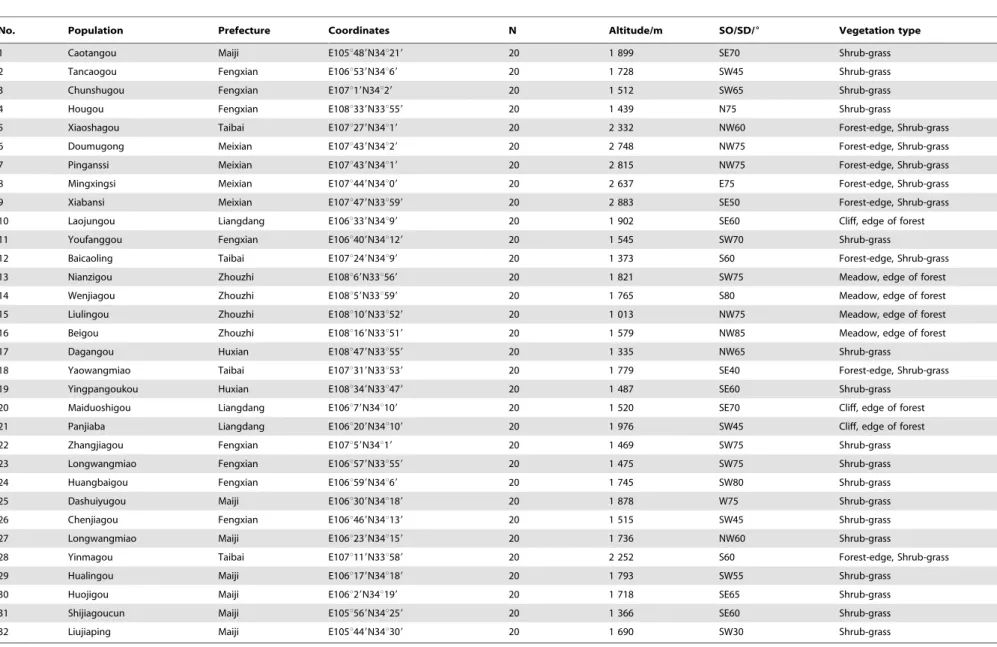
S. hexandrumdistribution pattern and extent of in Qinling Mts. were investigated from 2010 to 2011. The S. hexandrum populations are distributed in small and scattered patches. According to the field survey information, a total of 32 wild S. hexandrumpopulations were sampled for DNA analysis between July 19, 2012, and September 17, 2012, to ensure collection period consistency (Table 1). S. hexandrum has a wide geographic
distribution throughout the Qinling Mts. (Figure 1). The altitude of the sample sites ranged from 1 013 m to 2 883 m (Table1). Geographical distances between populations ranged from 5.5 km to 276.8 km. 20 plants were sampled from each population. The horizontal and vertical distances between sampled plants within each population were over 20 and 5 m, respectively, to increase the likelihood of sampling inter-individual variation within each population [37,38]. About 2 g to 10 g of fresh young leaves per plant was immediately frozen in liquid nitrogen and then kept at2 80uC until DNA isolation. The key information onS. hexandrum populations in all sampling sites is summarized in Table 1.
DNA extraction
Total genomic DNA was extracted from frozen leaves by using a plant genomic DNA rapid extraction kit (Spin-column) (BioTek Corporation, Beijing, China; http://bioteke.biogo.net/). The extracted DNA was quantified by comparing with known DNA of standard quantity (Lambda DNA) through electrophoresis in ethidium bromide-stained 1.0% agarose gels (Gene Genius Bio Imaging System; Synegene), and the extracted DNA was diluted in TE buffer to a final concentration of 50 ng/mL and stored at2
20uC before PCR amplification.
Primer screening and ISSR-PCR amplification
A total of 100 ISSR primers (synthesized by Shanghai Sheng Gong Biotechnology CO. LTD, China) were screened based on the primer set published by the Biotechnology Laboratory, University of British Columbia, Canada (UBC set No. 9) and the studies on Himalayan mayapple [34–39]. An optimum reaction system was obtained by screening DNA, Mg2+, dNTP,
primer (UBC900 was used for preliminary test), and Taq DNA polymerase concentrations and annealing temperature, and reaction conditions. The optimization showed that 20mL of reaction system is ideal. Each 20mL amplification reaction consisted of 16PCR buffer (10 mM Tris-HCl at pH 8.3, 50 mM L–1 KCl, 0.001% gelatin, and l.5 mmol L–1MgCl2), 1.6 mmol L–1dNTP mix, 0.6mmol L–1primer (UBC900 was used for preliminary test), 15 ng of template DNA, and 1.0 U Taq DNA polymerase (TaKaRa Biotechnology, Dalian, China), using a cycling profile of initial 5 min at 94uC, followed by 45 cycles of 30 s at 94uC, 45 s annealing at 50uC, and 90 s extension at 72uC, ending with a final extension of 7 min at 72uC.
The optimized PCR experiment conditions were applied for primer screening in a PTC100TM Programmable Thermal Controller (MJ Research, Waltham, MA, USA). Six populations (TCG, LJG, BG, MDS, YMG and CTG) with observable variations (morphology, habitat, etc) were selected to initially screen 100 primers by using 10 samples for each population. Primers that generated scorable bands and high levels of polymorphisms were selected by genotyping all populations. The amplification products were electrophoresed on 1.0% agarose gels buffered with 1.06TBE for 2.5 h at 100 V and were detected through ethidium bromide staining, and the gels were imaged in the Gene Genius Bioimaging System. Band size was estimated from a 0.1 kbp DNA ladder (TaKaRa Biotechnology, Dalian, China). Each primer was amplified in triplicate to confirm reliability and reproducibility. A reaction without DNA was used as negative control.
Data analyses
Amplification results were scored according to the positions of the DNA bands from electrophoresis, being labeled ‘‘1’’ for presence of the bands and ‘‘0’’ for absence of the bands in the data Genetic Diversity and Structure ofSinopodophyllum hexandrum
matrix. Only stable bands with repeatable differences were considered valid for polymorphism loci.
The resulting ISSR phenotype data matrix (binary matrix from 0 to 1) was analyzed using the POPGENE software (version 1.31) [49] to compute genetic diversity parameters, such as allele frequencies, percentage of polymorphic bands (PPB), number of alleles per locus (Ao), effective number of alleles per locus (Ae), total gene diversity (Ht), the level of gene flow (Nm), Nei’s gene diversity (He), gene distance (GD), Shannon’s information index (Ho), within-population diversity (Hs), and mean coefficient of gene differentiation (Gst). An unweighted pair groups mean arithmetic (UPGMA) mean dendrogram was constructed using PowerMarker 3.23 to examine the genetic relationship at the species level [50]. A bootstrap (resampling) test was performed 1 000 times to determine distances between the populations using PHYLIP version 3.69 (PHYLogeny Inference Package) programs [51]. Bayesian analysis of population structure was performed as implemented in STRUCTURE (version 2.2) to infer the most likely number of population genetic clusters (K) in the ISSR dataset [52]. K ranged from 1 to 10, with 10 replicate runs for each K, and a burn-in period of 26105and 56104iterations. The ‘‘no admixture model’’ and independent allele frequencies were chosen for this analysis. The most likely number of clusters was estimated according to the model values (DK) based on the second order rate of change, with respect to K, of the likelihood function [53]. To detect within-group structure, subsequent runs were performed for each obtained clusters using the same settings as previous. Population similarity was also explored and visualized through principle coordinate analysis (PCoA) using NTSYSpc 2.10e [54]. Analysis of molecular variance (AMOVA), which partitions total phenotypic variance within and among popula-tions, was performed using WIN AMOVA (version 1.55), which was provided by the Genetics and Biometry Laboratory, University of Geneva, Geneva, Switzerland [55]. The AMOVA input files with the Euclidean distance matrix were created using AMOVA-PREP 1.01 [56]. Significance level was tested by comparing the frequency distributions from the original data
and the data generated by a set of 1 000 computer simulations. A Mantel test was performed using Tools for Population Genetic Analysis (TFPGA) [56] for computing 5 000 permutations to test the isolation by distance (IBD) among populations by comparing genetic distance between all pairwise combinations of populations versus geographic distance. Geographical distance, Lab, was computed using the following formula: Lab= Arccos [cos(LATa )-COS(LONGa)cos(LATb)cos(LONGb)+ cos(LATb)sin(LONGb )co-s(LATb)sin(LONGb) + sin(LATa)sin(LATb)]6R [57]. LONGa, LATa and LONGb, LATb are the longitudes and latitudes (in radians) of sampling sites a and b, respectively; R indicates the radius of the earth, which is 6 378 km; and Lab represents the geographic distance between sampling sites a and b.
Results
Genomic DNA amplification results
For polymorphism testing of the 640S. hexandrumindividuals from 32 populations, forty-eight ISSR primers amplified visible bands and were chosen from the initial set of 100 primers to screen for reproducible markers. PCR amplification results (Table 2) show that 11 primers produced 241 clear and replicated bands (250 bp to 2 000 bp), of which 135 were polymorphic (56.02%) with 100% reproducibility. Individual primers detected between 19 (UBC825) and 29 (UBC900) loci can amplify clear bands, with an average of 21.91. The percentage of polymorphism ranged from 42.86% (UBC834) to 68.97% (UBC900), indicating that the selected primers are highly polymorphic across S. hexandrum populations. The Ht was 0.1434, whereas Hs was found to be 0.0599. The Gst value of 0.5823 indicated that 41.77% of the genetic diversity resided within the populations. The Nmamong the sampled populations was calculated as 0.3587 using Gst through the formula (0.5(12Gst)/Gst).
Population genetic diversity
Detailed statistical analyses were performed on the ISSR amplification results (Table 3). The numbers of polymorphic Figure 1. Locations of the 32S. hexandrumpopulations in Qinling Mts. sampled for this study.
Table 1.Sample information of the 32 sampling sites.
No. Population Prefecture Coordinates N Altitude/m SO/SD/6 Vegetation type
1 Caotangou Maiji E105u489N34u219 20 1 899 SE70 Shrub-grass
2 Tancaogou Fengxian E106u539N34u69 20 1 728 SW45 Shrub-grass
3 Chunshugou Fengxian E107u19N34u29 20 1 512 SW65 Shrub-grass
4 Hougou Fengxian E108u339N33u559 20 1 439 N75 Shrub-grass
5 Xiaoshagou Taibai E107u279N34u19 20 2 332 NW60 Forest-edge, Shrub-grass
6 Doumugong Meixian E107u439N34u29 20 2 748 NW75 Forest-edge, Shrub-grass
7 Pinganssi Meixian E107u439N34u19 20 2 815 NW75 Forest-edge, Shrub-grass
8 Mingxingsi Meixian E107u449N34u09 20 2 637 E75 Forest-edge, Shrub-grass
9 Xiabansi Meixian E107u479N33u599 20 2 883 SE50 Forest-edge, Shrub-grass
10 Laojungou Liangdang E106u339N34u99 20 1 902 SE60 Cliff, edge of forest
11 Youfanggou Fengxian E106u409N34u129 20 1 545 SW70 Shrub-grass
12 Baicaoling Taibai E107u249N34u99 20 1 373 S60 Forest-edge, Shrub-grass
13 Nianzigou Zhouzhi E108u69N33u569 20 1 821 SW75 Meadow, edge of forest
14 Wenjiagou Zhouzhi E108u59N33u599 20 1 765 S80 Meadow, edge of forest
15 Liulingou Zhouzhi E108u109N33u529 20 1 013 NW75 Meadow, edge of forest
16 Beigou Zhouzhi E108u169N33u519 20 1 579 NW85 Meadow, edge of forest
17 Dagangou Huxian E108u479N33u559 20 1 335 NW65 Shrub-grass
18 Yaowangmiao Taibai E107u319N33u539 20 1 779 SE40 Forest-edge, Shrub-grass
19 Yingpangoukou Huxian E108u349N33u479 20 1 487 SE60 Shrub-grass
20 Maiduoshigou Liangdang E106u79N34u109 20 1 520 SE70 Cliff, edge of forest
21 Panjiaba Liangdang E106u209N34u109 20 1 976 SW45 Cliff, edge of forest
22 Zhangjiagou Fengxian E107u59N34u19 20 1 469 SW75 Shrub-grass
23 Longwangmiao Fengxian E106u579N33u559 20 1 475 SW75 Shrub-grass
24 Huangbaigou Fengxian E106u599N34u69 20 1 745 SW80 Shrub-grass
25 Dashuiyugou Maiji E106u309N34u189 20 1 878 W75 Shrub-grass
26 Chenjiagou Fengxian E106u469N34u139 20 1 515 SW45 Shrub-grass
27 Longwangmiao Maiji E106u239N34u159 20 1 736 NW60 Shrub-grass
28 Yinmagou Taibai E107u119N33u589 20 2 252 S60 Forest-edge, Shrub-grass
29 Hualingou Maiji E106u179N34u189 20 1 793 SW55 Shrub-grass
30 Huojigou Maiji E106u29N34u199 20 1 718 SE65 Shrub-grass
31 Shijiagoucun Maiji E105u569N34u259 20 1 366 SE60 Shrub-grass
32 Liujiaping Maiji E105u449N34u309 20 1 690 SW30 Shrub-grass
Note: N means sample size; SO/SD means slope orientation/degree. doi:10.1371/journal.pone.0110500.t001
Genetic
Diversity
and
Structure
of
Sinopodophy
llum
hexandrum
PLOS
ONE
|
www.ploson
e.org
4
October
2014
|
Volume
9
|
Issue
10
|
bands are different among populations. The highest PPB (39.17%) was observed in the DMG population. However, only 20.73% of the bands were polymorphic in the SJG population. The PPB was 56.02% at the species level, whereas those of the single populations ranged from 20.73% (SJG) to 39.17% (DMG), with an average of 27.33%. Ae ranged from 1.0182 (HJG) to 1.2643 (BG), with 1.1630 at the population level and 1.3732 at the species level. He within populations was lower (0.0621) than that of the species level (0.1434). Within each population, the He of most populations ranged from 0.0226 to 0.0971. Only in the population HG, a high He (0.1229, Table 3) was observed. Ho ranged from 0.0244 to 0.1038, with an average of 0.0637 at the population level and 0.2362 at the species level. Allele frequencies calculated using Popgene software were shown in Table S2 in Text S2.
Genetic structure and differentiation of the populations
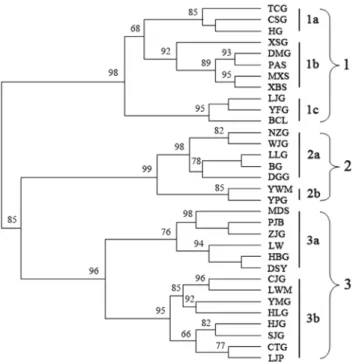
UPGMA cluster analysis. UPGMA clustering analysis
defined three major groups among 32 populations (Figure 2). Group 1 included 11 populations, which were further divided into three subgroups. Populations TCG, CSG and HG were in subgroup 1a; populations XSG, DMG, PAS, MXS and XBS were in subgroup 1b; and populations LJG, YFG, and BCL were in subgroup 1c. Populations NZG, WJG, LLG and BG (Zhouzhi County), population DGG (Huxian County), population YWM (Taibai County) and population YPG (Huxian County) were grouped in cluster 2. Group 3 contained 14 populations, which were sampled from two adjacent cities, Baoji and Tianshui, and were subdivided into two clusters. Populations MDS, PJB, ZJG, LW, and HBG (Baoji) and DSY (Tianshui) were in subgroup 3a. Populations LWM, HLG, HJG, SJG, CTG, and LJP (Tianshui) and CJG, YMG (Baoji) were in subgroup 3b. Seven populations including DSY, LWM, HLG, HJG, SJG, CTG, and LJP in Group 3 were from Gansu Province. The other populations clustered in Groups 1, 2, and 3 were from Shaanxi Province. The S. hexandrum population was not clustered on the UPGMA tree according to geographic distance, which may indicate no obvious correlation between geographic distribution and genetic distance.
Principle coordinate analysis. PCoA was used for
ordina-tion and exploraordina-tion of the similarity between populaordina-tions. All samples were clearly separated into three major groups on the first (PCo1) and second (PCo2) principal coordinates (Figure 3). PCo1 explained 13.6% of the total variance, and PCo2 explained 8.7% of the total variance. Groups 1 and 2 are clustered within each other’s vicinity even though clearly separated, indicating higher similarity between these two groups. The clustering of the populations was in agreement with the UPGMA dendrogram.
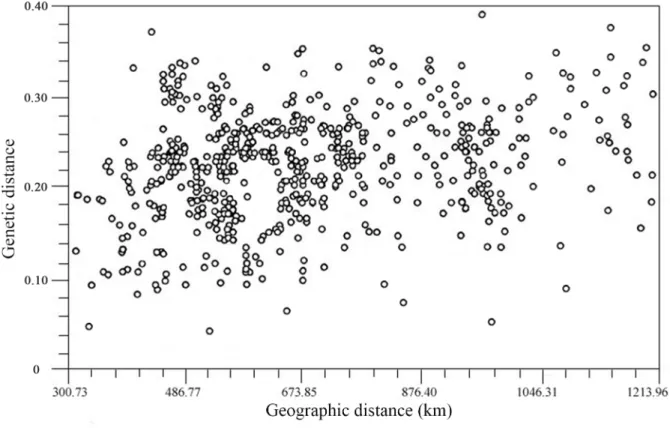
Mantel test for IBD. A Mantel test for IBD was performed
to assess the correlation between the genetic distance matrix and the corresponding geographic distance matrix of the wild S. hexandrum populations. The correlation coefficient r of genetic distance and geographic distance was 0.212 (P= 0.287), and the correlation analysis diagram (Figure 4) was comprised of many disordered and scattered points, indicating that the IBD of the wild S. hexandrumpopulations in Qinling Mts. was not significant at the level of 0.05. The Mantel test did not indicate correlation between genetic distance and geographical provenance.
Bayesian clustering. The genetic structure of the S.
hexandrum samples were further analyzed using Bayesian clustering algorithm in the STRUCTURE software. The DK method indicated that the most likely K value was 3 (Figure 5). Sharp divisions were observed for the three clusters (Figure 6). The assignments of the populations to Groups 1, 2, and 3 were stable and consistent with UPGMA and PCoA clustering.
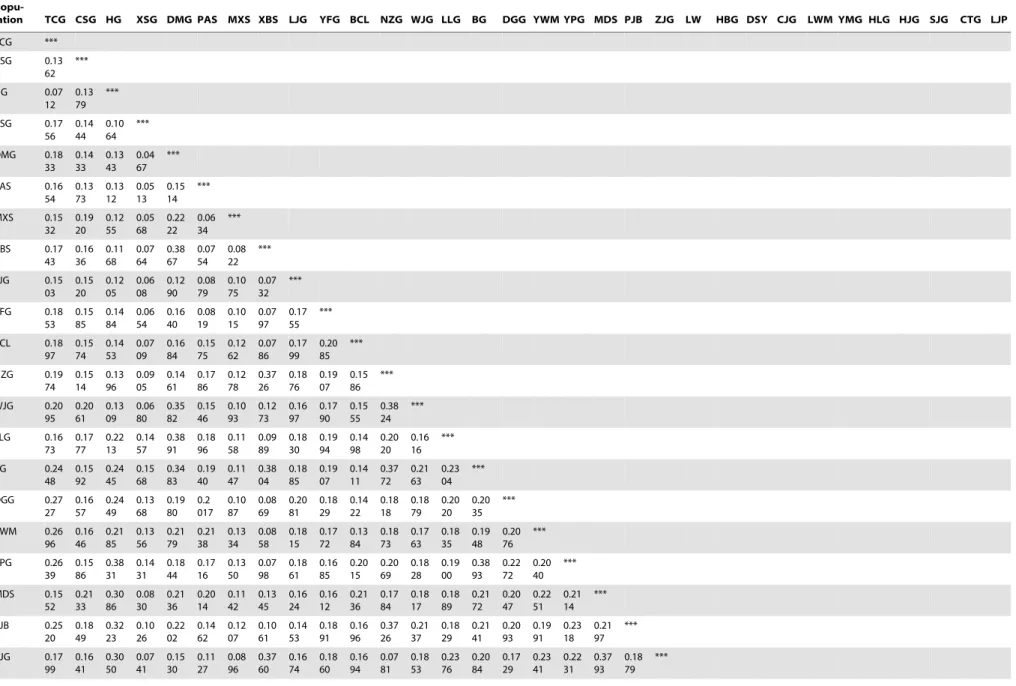
Analysis of molecular variance. The pairwise GD values (Table 4) were small and ranged from 0.0467 (XSG and DMG) to 0.3997 (BG and LW), indicating low differentiation within populations. Low population differentiation indicated that gene flow within each clustered group may be high or that isolation time was recent.
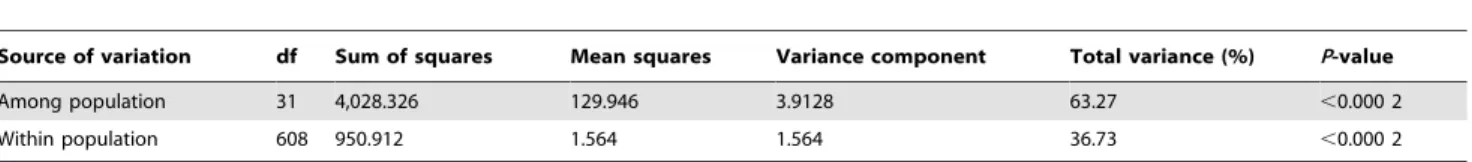
AMOVA (Table 5) was also performed for population differ-entiation to further evaluate genetic structure. Highly significant (P,0.000 2) genetic variance was expectedly observed among the populations and explained 63.27% of the total variance, support-ing the results from the hierarchical and Bayesian clustersupport-ing. Only 36.73% of the total genetic variance occurred within populations, indicating higher genetic differentiation between the populations than within each population and the emergence of genetic differentiation among populations. The Gst value (0.5823)
(Table 2) showed there were more variation among populations than that within populations, confirming the AMOVA results.
Discussion
Genetic diversity ofS. hexandrumin Qinling Mts The ISSR markers developed in this study effectively revealed low genetic diversity within theS. hexandrumpopulations sampled in Qinling Mts. Populations are isolated given the population differentiation and clear clustering. The comparison of the average genetic diversity to that of S. hexandrum from Northwestern Himalayan region [34,36,38] and other Berberidaceae species [58,59] based on the ISSR approach showed thatS. hexandrum populations of Qinling Mts. have low genetic diversity (average He= 0.0621). TheS. hexandrumin the Northwestern Himalayan
Table 3.Descriptive statistics summary of theS. hexandrumpopulations.
Population Code PPB (%) Ao Ae He Ho
Tancaogou TCG 23.63 1.3546 1.1684 0.0559 0.0737
Chunshugou CSG 22.62 1.2687 1.1556 0.0337 0.0689
Hougou HG 25.66 1.5642 1.2357 0.1229 0.1038
Xiaoshagou XSG 25.32 1.5721 1.1957 0.0777 0.0733
Doumugong DMG 39.17 1.3905 1.1404 0.0296 0.0255
Pinganssi PAS 33.95 1.4397 1.1833 0.0567 0.0442
Mingxingsi MXS 26.94 1.4720 1.1667 0.0381 0.0667
Xiabansi XBS 23.51 1.4986 1.231 0.0542 0.0614
Laojungou LJG 28.52 1.2199 1.1937 0.0426 0.0566
Youfanggou YFG 21.95 1.3688 1.1846 0.0533 0.0755
Baicaoling BCL 28.84 1.5579 1.1795 0.0603 0.0715
Nianzigou NZG 25.18 1.473 1.2166 0.0868 0.0508
Wenjiagou WJG 31.99 1.4238 1.1737 0.0797 0.0321
Liulingou LLG 26.85 1.5053 1.2000 0.0882 0.0733
Beigou BG 29.01 1.5319 1.2643 0.0670 0.0680
Dagangou DGG 27.07 1.5912 1.2128 0.0448 0.0781
Yaowangmiao YWM 32.03 1.5309 1.2024 0.0728 0.0972
Yingpangoukou YPG 24.93 1.6054 1.2290 0.0778 0.0799
Maiduoshigou MDS 24.63 1.1576 1.0445 0.0226 0.0656
Panjiaba PJB 32.95 1.1872 1.1293 0.0252 0.0277
Zhangjiagou ZJG 26.17 1.2364 1.1722 0.0523 0.0464
Longwangmiao LW 24.46 1.2953 1.2199 0.0498 0.0636
Huangbaigou HBG 24.07 1.3276 1.1913 0.0684 0.0994
Dashuiyugou DSY 31.74 1.2435 1.0573 0.0804 0.0704
Chenjiagou CJG 28.75 1.4232 1.2048 0.0643 0.0544
Longwangmiao LWM 33.62 1.2577 1.0735 0.0422 0.0722
Yinmagou YMG 23.52 1.4565 1.2381 0.0971 0.061
Hualingou HLG 23.34 1.1842 1.1088 0.0387 0.0603
Huojigou HJG 30.96 1.0761 1.0182 0.0541 0.0244
Shijiagoucun SJG 20.73 1.1253 1.0611 0.0412 0.0431
Caotangou CTG 26.42 1.1088 1.0826 0.0315 0.0533
Liujiaping LJP 25.93 1.2165 1.0802 0.0573 0.0961
Average 27.33 1.3645 1.1630 0.0621 0.0637
Total 56.02 1.7801 1.3732 0.1434 0.2362
Note: Ao, observed number of alleles per locus; Ae, effective number of alleles per locus; He, Nei’s gene diversity; Ho, Shannon’s information index; PPB, percentage of polymorphic bands.
doi:10.1371/journal.pone.0110500.t003
Genetic Diversity and Structure ofSinopodophyllum hexandrum
region [34,36,38] showed high genetic variation (He= 0.2944, 0.092, respectively). S. hexandrum is native to the Himalayan region, growing in valleys with secondary vegetation, or under shrubs or around trees [2]. Their habitat is significantly different from that of Qinling Mts. S. hexandrum reproduces through vegetative reproduction and seeds. Insects and birds are limited in
the high altitude regions, implying thatS. hexandrumpollination is easier than in the Qingling Mts. The sizes of wild populations ofS. hexandrumare very small and declines each year in Qinling Mts. because of habitat fragmentation and deterioration caused by human disturbance (overcollection due to economic interests). The rapid decrease in individuals in wild populations may also cause loss of the genetic diversity of this endangered species. Another Berberidaceae species, Dysosma versipellis, is an endangered species endemic to China and has been listed as a key protected wild plant in China due to habitat fragmentation or destruction. Qiu et al. found this species had high level of genetic diversity in China (He= 0.378) [58].Dysosma pleiantha, a threatened medic-inal plant species distributed in southeastern China, sexually and asexually reproduces. High He(0.364) was observed in this species [59]. The relatively high level of genetic variation observed within two species suggested that the balance between vegetative reproduction and sexual reproduction was more in favor of sexual reproduction in the populations D. versipellis and D. pleiantha than in theS. hexandrumpopulations. The Hefound in this study was 0.1434 at the species level, lower than those of some strictly self-pollinating soybean species (He= 0.1714) [60] and the self-pollinatingOryza granulata(He= 0.210) [61], which also indicat-ed that potential selfing system in these populations rindicat-educindicat-ed genetic diversity ofS. hexandrum populations. Historical events are also responsible for the variation in genetic diversity [62].
Genetic diversity is affected by multiple factors, such as geographical distribution, mating system, life form, pollen and seed dispersal [63,64]. Low genetic variation within populations could be attributed to seed dispersal and the predominant clonal reproduction in S. hexandrum in this high mountainous area. However, the genetic diversity ofS. hexandrumis not much lower than other endangered species analyzed using ISSR markers, such asLeontice microrhyncha(Berberidaceae) (He= 0.021), which is a polycarpic perennial herb found in deciduous or coniferous forests Figure 2. UPGMA clustering of S. hexandrum populations in
Qinling Mts.
doi:10.1371/journal.pone.0110500.g002
Figure 3. Distribution of individuals of the 32S. hexandrumpopulations from Qinling Mts., according to the first (PCo1) and second (PCo2) principal coordinates.PCo1 and PCo2 account for 13.6 and 8.7% of the total variation, respectively.
in Korea and Northeast China [65]. For speciesL. microrhyncha, each pollinated flower produces an 8 mm berry and seed dispersal is restricted due to its heavy berry [66]. The genetic diversity ofS. hexandrum was also higher than those of two other species, the endangeredPinus squamata(He= 0.020) [67] and the first-degree endangered species Manglietia decidua (He= 0.0637) [68]. P. squamataandM. deciduaare extremely rare and endangered tree species in China. The extremely low genetic diversity of this two species could have resulted from the severe bottleneck effect
during their evolutionary process. The gene drift and inbreeding may further decrease their genetic diversity in the shrinking populations. The weak competitive ability against broad - leaved trees and human activities may also accelerated the decrease of genetic variation.
S. hexandrum is reasonably long lived because its rhizomes easily reproduce, which could slow down the loss of genetic diversity. Pollen dispersal is generally restricted to a small region due to the large pollen size, which limits gene flow to increase or Figure 4. Mantel regression of the pairwise relationship between genetic and geographical distances forS. hexandrumpopulations.
doi:10.1371/journal.pone.0110500.g004
Figure 5. The probable K value estimated by likelihood of the probability of data L(K) and ad hoc quantityDK.
doi:10.1371/journal.pone.0110500.g005
Genetic Diversity and Structure ofSinopodophyllum hexandrum
maintain genetic diversity. S. hexandrum is native to the Himalayan region, including China, India, Nepal, and Myanmar. No other genetic diversity studies ofS. hexandrumexist in other locations. Further research should include more populations in other regions of China and countries.
High genetic differentiation and distinct genetic structure
High level of genetic differentiation and clear population structure was detected in this study. K = 3 in the Bayesian clustering as a meaningful value because group 1, 2 and 3 could be divided by detecting the within-group substructure. This result is also supported by distance-based clustering and PCoA. Groups 1 and 2 are genetically close but significantly different. Estimation of the number of clusters K should be treated with care because it is computationally difficult to obtain accurate estimates and the method merely provides an ad hoc approximation [52].
All sampled individuals were strongly assigned to their original populations, and all data strongly support the conclusion that the 32S. hexandrumpopulations distributed in the Qinling Mts. are clustered into three major groups. These methods consistently showed that high genetic differentiation existed among S. hexandrumpopulations, which is consistent with genetic variation studies in certain selfing species [69]. This would mean that S. hexandrum should be a selfing species or a selfing predominant species, which is consistent with previous studies onS. hexandrum by Ma et al. [70]. Aside from the breeding system, the high genetic differentiation across populations may also be caused by genetic drift [71]. Wright [72] noted that genetic drift would lead a small population to emerge with a distinct genetic differentiation when the Nmvalue is lower than 1.0. The NmofS. hexandrum(0.3587) determined using the POPGENE software was lower than 1.0 in the present study, which suggested that some genetic drift may have emerged among the populations of this species. The distribution of S. hexandrum populations obviously tend to fragment based on the field investigation, which is consistent with the possibility of genetic drift.
Migration of plant populations can occur through dispersal of pollen and seed [73]. But a number of factors such as fragmented geographical distribution, lack of pollinators or seed dispersers can be a barrier to gene flow between populations [74,75]. Limited gene flow among S. hexandrum populations may be related to inbreeding of the species and limited seed propagation distance. Some studies have found that seed dispersal is the primary factor influencing variation of gene flow and population structure [76].
Heavy mature berries ofS. hexandrumusually drop to the ground because of rain or wind, settling some seeds in the soil, whereas others are dispersed by cattle, birds, or humans. Therefore, the short distance of seed dispersal ofS. hexandrumprobably resulted in limited gene flow among populations. Mountain ranges and rivers are possible barriers to either dispersal of pollen or rhizomes of S. hexandrum, reproductively isolating the populations. The restriction of gene flow associated with geographical distance is consistent with the results of previous studies on this species [34,35,36].
Implications for conservation
S. hexandrum is a rare and threatened species [4] in China. Assessment of genetic diversity is important for designing conservation strategies for threatened and endangered species [77,78]. The results of this study showed that there was low genetic diversity amongS. hexandrumpopulations and genetic differen-tiation among populations was higher than within populations. Genetic diversity loss has deleterious effects on species fitness and threatens the population survival and could be the key reason that explains the endangerment of S. hexandrum in Qinling Mts. [79,80]. The estimation of the genetic diversity and population genetic structure could provide bases forS. hexandrum conserva-tion and its reasonable utilizaconserva-tion. The results will help determine what to conserve and where and how to conserve this species.
The field survey showed that the habitats of some populations have been destroyed by human disturbance for great medical value. Damage to natural habitats would led to a decrease in population sizes and probably a subsequent increase in inbreeding, decreasing its genetic diversity. In situ conservation effectively and sustainably prevents this problem. The establishment of S. hexandrum reserves should be the primary method because the Qinling Mts. are situated in state forest conservation areas, where cutting and hunting are restricted. The management for the conservation of genetic variability in this species should aim to preserve not only large populations but also as many of the small populations outside nature reserves as possible. Reduced levels of genetic variation, especially in the smaller populations, will affect the species’ ability to adapt to changes in its habitat [81]. Positive correlations between population size, expected heterozygosity, and plant fitness were found in Gentiana pneumonanthe [82] and Arnica Montana[81]. Thus, policy plans should also be developed to stimulate seedling recruitment in the small populations (e.g., PAS and MXS). It may be dangerous to mix highly divergent populations because it could cause loss of adaptive diversity [45]. Therefore, it is necessary to improve gene flow among populations Figure 6. Bayesian clustering for infering population structure ofS. hexandrumpopulations from Qinling Mts.
Table 4.Pairwise genetic distance estimates from 241 ISSR markers inS. hexandrum.
Popu-lation TCG CSG HG XSG DMG PAS MXS XBS LJG YFG BCL NZG WJG LLG BG DGG YWM YPG MDS PJB ZJG LW HBG DSY CJG LWM YMG HLG HJG SJG CTG LJP
Popu-lation TCG CSG HG XSG DMG PAS MXS XBS LJG YFG BCL NZG WJG LLG BG DGG YWM YPG MDS PJB ZJG LW HBG DSY CJG LWM YMG HLG HJG SJG CTG LJP
within each group through some artificial means, such as transplanting individuals (by seed, rhizomes from one population to another). Furthermore, to avoid human overcollection, greater awareness forS. hexandrumprotections must be emphasized, and related forest departments should be encouraged to undertake conservation through an integrated conservation strategy based on demographic, ecological, and genetic aspects.
As a supplement to in situ conservation, ex situ conservation would also be feasible as underlined by other studies on endangered species [83,84,85]. Populations may be partially preserved through seed banks or in vitro germplasm collections. S. hexandrum has favorable sexual reproduction. Each plant produces approximately 60 seeds, with a maximum of approxi-mately 180 seeds [70]. Seed collection is easier forS. hexandrum than other endangered species. Thus, a strategy involving extensive collection to ensure full sampling of genetic diversity, subsequent cultivation in a garden at least 1000 m above sea level [7], and reintroduction into their original wild habitats seems feasible, although S. hexandrum mainly grows wild on high altitude mountain ranges. For S. hexandrum populations in Qinling Mts., there are some preserved forest farms which could be used for relocation. However, ex situ conservation has many drawbacks because it is impossible to recreate the habitat as a whole. The new environment may have important ecological differences compared with the original habitat, and the approach is technically challenging and is often expensive. Therefore, ex situ conservation is recommended only to supplement in situ conser-vation or as a last resort. In vitro techniques are also proven to be an effective alternative means of propagation that facilitates the recovery of the rare and endangered S. hexandrum [33]. At
present, an effective protocol of in vitro propagation, involving multiple shoot formation from zygotic embryos and subsequent rooting, could be available forS. hexandrum. In vitro propagation may well be used as a means to rescue zygotic embryos for this species. In vitro techniques induce variability, but plants raised from tissue cultures may be screened for useful somaclonal variants and exploited to obtain plants or cultures with high podophyllo-toxin contents, which possibly reduces the pressure on naturalS. hexandrumpopulations.
Most of the genetic diversity of the important medicinal and endangered species S. hexandrum in Qinling Mts. must be guaranteed with these combined and sustained efforts.
Supporting Information
Text S1 Description of the sampling procedures.
(DOC)
Text S2 Allele frequencies per locus.
(DOC)
Acknowledgments
The authors are also grateful to Genlu Bai, Guowei Xia and all the colleagues in the same laboratory for the assistance in the work.
Author Contributions
Conceived and designed the experiments: WL JJL. Performed the experiments: WL DXY NL. Analyzed the data: WL. Contributed reagents/materials/analysis tools: JJL. Contributed to the writing of the manuscript: WL.
References
1. Editorial committee, Chinese Academy of Sciences (2010) Vol. 29, Flora of China. Beijing: Science Press. 249–251 p. (In Chinese.).
2. Ying TS (1979) Study on Dysosma Woodson and Sinopodophyllum Ying (new genus) of the Berberidaceae. Acta Phytotax Sin 17: 17–23. (In Chinese with English abstract.).
3. Chatterjee R (1952) Indian podophyllum. Econ Bot 6: 342–354.
4. Fu LG (1992) Plant red book of China: Rare threatened plant. Beijing: Science Press. (In Chinese.).
5. Cragg GM, Newman DJ, Snader KM (1997) Natural products in drug discovery and development. J Nat Prod 60: 52–60.
6. Dong JE, Ma XH, Wei Q, Peng SB, Zhang SC (2011) Effects of growing location on the contents of secondary metabolites in the leaves of four selected superior clones ofEucommia ulmoides. Ind Crop Prod 34: 1607–1614. 7. Li GM (1975) Introduction a medicine plant:Sinopodophyllum emodi Wall. var.
Chinense Sprague. Journal of Botony 2: 28. (In Chinese with English abstract.). 8. Fay DA, Ziegler HW (1985) Botanical source differentiation of Podophyllum resin by high performance liqid chromatography. J Liq Chromatogr 8: 1501– 1506.
9. Giri A, Narasu ML (2000) Production of podophyllotoxin fromPodophyllum hexandrum: a potential natural product for clinically useful anticancer drugs. Cytotechnology 34: 17–26.
10. Stahelin HF, Von Warhurg A (1991) The chemical and biological route from podophyllotoxin glucoside to etoposide: ninth cain memorial avard lecture. Cancer Res 51: 5–11.
11. Kamil WM, Dewick PM (1986) Biosynthetic relationship of aryltetralin lactone lignans to dibenzylbutyrolactone lignans. Phytochemistry 25: 2093–2102. 12. Holthuis JJM (1988) Etoposide and teniposide. Pharm Weekbl 10: 101–116.
13. Imbert TF (1998) Discovery of podophyllotoxin. Biochimie 80: 207–222. 14. Moraes RM, Lata H, Bedir E, Maqbool M, Cushman K (2002) The American
mayapple and its potential for podophyllotoxin production. In: Janick J, Whipkey A, editors. Trends in new crops and new uses. Alexandria, VA: ASHS Press. pp. 527–532.
15. Yousefzadi M, Sharifi M, Behmanesh M, Moyano E, Bonfill M, et al. (2010) Podophyllotoxin: current approaches to its biotechnological production and future challenges. Eng Life Sci 4: 281–292.
16. Lata H, Moraes RM, Bertoni B, Pereira Ana MS (2010) In vitro germplasm conservation ofPodophyllum peltatumL. under slow growth conditions. In Vitro Cell Dev Biol–Plant 46: 22–27.
17. Lin MC, Lin JH, Chen SK, Cheng YW, Cheng HW (2008) Simultaneous determination of podophyllotoxin, quercetin and kaempferol in podophyllin by liquid chromatography tandem mass spectrometry. J Food Drug Anal 16: 29–40.
18. Zhou Y, Jiang SY, Ding LS, Cheng SW, Xu HX, et al. (2008) Chemical fingerprinting of medicinal plants ‘‘Gui-jiu’’ by LC-ESI multiple-stage MS. Chromatographia 68: 781–789.
19. Purohit MC, Bahuguna R, Maithani UC, Rawat MSM (1999) Variation in podophylloresin and podophyllotoxin content in different populations of Podophyllum hexeandrum. Curr Sci India 77: 1078–1079.
20. Zhao CQ, Cao W, Nagatsu A, Ogihara Y (2001) Three new glycosides from Sinopodophyllum emodi(Wall.) Ying. Chem Pharm Bull 49: 1474–1476. 21. Kong Y, Xiao JJ, Meng SC, Dong XM, Ge YW, et al. (2010) A new cytotoxic
flavonoid from the fruit ofSinopodophyllum hexandrum. Fitoterapia 81: 367– 370.
Table 5.Analysis of molecular variance (AMOVA) for 640 individuals in 32 populations ofS. hexandrumusing 11 selected ISSR primers.
Source of variation df Sum of squares Mean squares Variance component Total variance (%) P-value
Among population 31 4,028.326 129.946 3.9128 63.27 ,0.000 2
Within population 608 950.912 1.564 1.564 36.73 ,0.000 2
doi:10.1371/journal.pone.0110500.t005
Genetic Diversity and Structure ofSinopodophyllum hexandrum
22. Zhao CQ, Zhu YY, Chen SY, Ogihara Y (2011) Lignan glucoside from Sinopodophyllum emodiand its cytotoxic activity. Chinese Chem Lett 22: 181– 184.
23. Sun YJ, Li ZL, Chen H, Liu XQ, Zhou W, et al. (2011) Three new cytotoxic aryltetralin lignans fromSinopodophyllum emodi.Bioorg Med Chem Lett 21: 3794–3797.
24. Qin Y, Gui MY, Yu LN, Ru H, Jin YR, et al. (2009) RP-HPLC determination of lignans inSinopodophyllum emodiWall. Chin J Pharm Anal 29: 1490–1493. (In Chinese with English abstract.).
25. Huang K, Jiang W, Zhao JF, Wang CH, Liu X, et al. (2012) Determination of podophyllotoxin and total lignans inSinopodophyllum emodi. China journal of Chinese material medicia 37: 1360–1365. (In Chinese with English abstract.). 26. Inamori Y, Kubo M, Tsujibo H, Ogawa M, Baba K, et al. (1986) The biological
activities of podophyllotoxin compounds. Chem pharm Bull 34: 3928–3932. 27. Goel HC, Prasad J, Sharma A, Singh B (1998) Antitumour and radioprotective
action ofPodophyllum hexandrum. Indian J Exp Biol 36: 583–587.
28. Chattopadhyay S, Bisaria VS, Panda AK, Srivastava AK (2004) Cytotoxicity of invitro produced podophyllotoxin fromPodophyllum hexandrum on human cancer cell line. Nat Prod Res 18: 51–57.
29. Reddy PB, Paul DV, Agrawal SK, Saxena AK, Kumar HMS, et al. (2008) Design, synthesis, and biological testing of 4b-[(4-Substituted)-1,2,3-triazol-1-yl] podophyllotoxin analogues as antitumor agents. Arch Pharm Chem Life Sci 341: 126–131.
30. Zhu CG, Yang J, Xiong Y (2004) Research progress in natural antineoplastic podophyllotoxin and its derivatives. Drug Eval 1: 306.
31. Wang DW, Guo FX, Ma XY (1997) The antitumor activity ofSinopodophyllum emodi. Chinese medicine matria 20: 571–574. (In Chinese with English abstract.).
32. Li GY (2005) Effects of ethanol extracts from Podophylum emodi var. on proliferation and apoptosis of breast careinoma cell line MCF–7. Chinese Journal of New Drugs 26: 2185–2188. (In Chinese with English abstract.). 33. Nadeem M, Palni LMS, Purohit AN, Pandey H, Nandi SK (2000) Propagation
and conservation ofPodophyllum hexandrumRoyle: an important medicinal herb. Bio Conserv 92: 121–129.
34. Alam MA, Naik PK, Gulati P, Gulati AK, Mishra GP (2008) Characterization of genetic structure of Podophyllum hexandrum populations, an endangered medicinal herb of Northwestern Himalaya, using ISSR-PCR markers and its relatedness with podophyllotoxin content. Afr J Biotechnol 7: 1028–1040. 35. Alam MA, Gulati P, Aswini KG, Gyan PM, Pradeep KN (2009) Assessment of
genetic diversity amongPodophyllum hexandrumgenotypes of Northwestern Himalayan region for podophyllotoxin production. Indian J Biotechnol 8: 391– 399.
36. Naik PK, Alam MA, Singh H, Goyal V, Parida S, et al. (2010) Assessment of genetic diversity through RAPD, ISSR and AFLP markers inPodophyllum hexandrum: a medicinal herb from the Northwestern Himalayan region. Physiol Mol Biol Plants 16: 135–148.
37. Xiao M, Li Q, Guo L, Luo T, Duan WX, et al. (2006) AFLP analysis of genetic diversity of the endangered speciesSinopodophyllum hexandrumin the tibetan region of Sichuan province, China. Biochem Genet 44: 47–59.
38. Xiao M, Li Q, Wang L, Guo L, Li J, et al. (2006) ISSR analysis of the genetic diversity of the endangered speciesSinopodophyllum hexandrum(Royle) Ying from Western Sichuan province, China. J Integr Plant Bio 48: 114021146. 39. Li Y, Zhai SN, Qiu YX, Guo YP, Ge XJ, et al. (2011) Glacial survival east and
west of the ‘Mekong–Salween Divide’ in the Himalaya–Hengduan mountains region as revealed by AFLPs and cpDNA sequence variation inSinopodophyllum hexandrum(Berberidaceae). Mole Phylogenet Evol 59: 4122424.
40. Totland Ø (1999) Effects of temperature on performance and phenotypic selection on plant traits in alpineRanunculus acris.Oecologia 120: 242–251. 41. Esselman EJ, Li J, Crawford DJ, Winduss JL, Wolfe AD (1999) Clonal diversity
in the rareCalamagrostis porteri ssp. insperata(Poaceae): Comparative results for allozymes and random amplified polymorphic DNA (RAPD) and inter-simple sequence repeat (ISSR) marker. Mol Ecol 8: 443–451.
42. Ge XJ, Sun M (1999) Reproductive biology and genetic diversity of a cryptoviviparous mangroveAegiceras corniculatum(Myrsinaceae) using allo-zyme and inter-simple sequence repeat (ISSR) analysis. Mol Ecol 8: 2061–2069. 43. Li HS, Chen GZ (2004) Genetic diversity ofSonneratia albain China detected
by inter-simple sequence repeat (ISSR) analysis. Acta Bot Sin 46: 515–521. 44. Thriveni HN, Sumangala RC, Shivaprakash KN, Ravikanth G, Vasudeva R,
et al. (2014) Genetic structure and diversity ofCoscinium fenestratum: a critically endangered liana of Western Ghats, India. Plant Syst Evol 300: 403–413. 45. Tang N, Mo G, van Tuyl JM, Arens P, Liu JJ, et al. (2014) Genetic diversity and
structure ofLilium pumilumDC. in southeast of Qinghai–Tibet plateau. Plant Syst Evol 300: 1453–1464.
46. Bornet B, Branchard M (2001) Nonanchored inter simple sequence repeat (ISSR) markers: reproducible and specific tools for genome fingerprinting. Plant Mol Biol Rep 19: 209–215.
47. Nagaoka T, Ogihara Y (1997) Applicability of inter-simple sequence repeat polymorphisms in wheat for use as DNA markers in comparison to RFLP and RAPD markers. Theor Appl Genet 94: 597–602.
48. Li JJ, Zhu ZC, Min ZL (1989) Comprehensive survey of the Taibai Mountain preserve (1st ed). Xi’an: Shaanxi Normal University Press. 1–9 p. (In Chinese.). 49. Yeh FC, Yang RC, Boyle T, Ye ZH, Mao JX (1997) POPGENE: The user friendly shareware or population genetic analysis. Molecular Biology and Biotechnology Center, University of Alberta, Edmonton.
50. Liu KJ, Muse SV (2005) PowerMarker: an integrated analysis environment for genetic marker analysis. Bioinformatics 21: 2128–2129.
51. Felsenstein J (1985) Confidence limits on phylogenies: an approach using the bootstrap. Evolution 39: 783–791.
52. Pritchard JK, Stephens M, Donnelly P (2000) Inference of population structure using multilocus genotype data. Genetics 155: 945–959.
53. Evanno G, Regnaut S, Goudet J (2005) Detecting the number of clusters of individuals using the software Structure: a simulation study. Mol Ecol 14: 2611– 2620.
54. Jensen RJ (1989) Ntsys-Pc-numerical taxonomy and multivariate analysis system-version 1.40. Q Rev Biol 64: 250–252.
55. Exeoeffr L, Smouse PE, Quattro JM (1992) Analysis of molecular variance inferred from metric distances among DNA haplotypes: applications to human mitochondrial DNA restriction data. Genetics 131: 479–491.
56. Miller MP (1997) Tools for Population Genetic Analysis (TFPGA), Vesion 1.3. USA: Department of Biological Sciences, Northern Arizona University, Ariozna. 57. Larson SR, Palazzo AJ, Jensen KB (2003) Identification of western wheatgrass cultivars and accessions by DNA fingerprinting and geographic provenance. Crop Sci 43: 394–401.
58. Qiu YX, Li JH, Liu HL, Chen YY, Cheng XF (2006) Population structure and genetic diversity ofDysosma versipellis(Berberidaceae), a rare endemic from China. Biochem Syst Ecol 34: 745–752.
59. Zong M, Liu HL, Qiu YX, Yang SZ, Zhao MS, et al. (2008) Genetic diversity and geographic differentiation in the threatened speciesDysosma pleianthain China as revealed by ISSR analysis. Biochem genet 46: 180–196.
60. JinY, Zhang WJ, Fu D X, Lu BR (2003) Sampling strategy within a wild soybean population based on its genetic variation detected by ISSR markers. Acta Bot Sin 45: 995–1002. (In Chinese with English abstract.).
61. Wu CJ, Chen ZQ, Huang XQ, Yin SH, Cao KM, et al. (2004) Genetic diversity among and within populations of Oryza granulatafrom Yunnan of China revealed by RAPD and ISSR markers: implications for conservation of the endangered species. Plant Sci 167: 35–42.
62. Karron JD (1991) Patterns of genetic variation and breeding systems in rare plant species. In: Falk DA, Holsinger, KE, editors. Genetics and conservation of rare plants. New York: Oxford University Press. pp. 87–98.
63. Hamrick JL, Godt MJW, Sherman-Broyles SL (1992) Factors influencing levels of genetic diversity in woody plant species. New Forest 6: 95–124.
64. Ohsawa T, Saito Y, Sawada H, Ide Y (2008) Impact of altitude and topography on the genetic diversity of Quercus serrata populations in the Chichibu Mountains, central Japan. Flora 203: 187–196.
65. Lee TB (1980) Illustrated flora of Korea. Seoul: Hyang-mun Pub. Co. (In Korean.).
66. Chang CS, Kim H, Park TY, Maunder M (2004) Low levels of genetic variation among southern peripheral populations of the threatened herb, Leontice microrhyncha(Berberidaceae) in Korea. Biol Conserv 119: 387–396. 67. Zhang ZY, Li DZ (2003) Conservation genetics of extremely endangered pine,
Pinus squamata.Acta Botanica Yunnanica 25: 544–55. (In Chinese with English abstract.).
68. Liao WF, Xia NH, Deng YF, Zheng QY (2004) Study on genetic diversity of Manglietia decidua. Acta Botanica Yunnanica 26: 58–64. (In Chinese with English abstract.).
69. Nybom H, Bartish IV (2000) Effects of life history traits and sampling strategies on genetic diversity estimates obtained with RAPD markers in plants. Plant Ecol Evol Syst 3: 93–114.
70. Ma SB, Xu ZY, Hu ZH (1997) A contribution to the reproductive biology of Sinopodophyllum hexandrum(Role) Ying (Berberidaceae). Acta Bot Boreal – Occident Sin l7: 49–55. (In Chinese with English abstract.).
71. Hamrick JL, Godt MJW (1989) Allozyme diversity in plant species. In: Brown AHD, Clegg MT, Khaler AL, Weir BS, editors. Plant population genetics, breeding and genetic resources. Sunderland: Sinauer Associates, Inc., Publisher. pp. 43–63.
72. Wright S (1965) The interpretation of population structure by F-statistics with special regard to systems of mating. Evolution 19: 395–420.
73. Ennos RA (1994) Estimating the relative rates of pollen and seed migration among plant-populations. Heredity 72: 250–259.
74. Slatkin M (1985) Gene flow in natural-populations. Annu Rev Ecol Syst 16: 393–430.
75. Zhou TH, Qian ZQ, Li S, Guo ZG, Huang ZH, et al. (2010) Genetic diversity of the endangered Chinese endemic herbSaruma henryi Oliv. (Aristolochiaceae) and its implications for conservation. Popul Ecol 52: 223–231.
76. Kalisz S, Hanzawa FM, Tonsor SJ, Thiede DA, Voigt S (1999) Ant-mediated seed dispersal alters pattern of relatedness in a population of Trillium grandifloru. Ecology 80: 2620–2634.
77. Hamrick JL (1983) The distribution of genetic variation within and among natural plant populations. In: Schonewald-Cox CM, Chambers SM, McBryde B, Thomas WL, editors. Genetics and conservation. Menlo Park: Benjamin Cummings Publishing Company. pp. 335–348.
78. Francisco-Ortega J, Santos-Guerra A, Kim SC, Crawford DJ (2000) Plant genetic diversity in the Canary Islands: a conservation perspective. Am J Bot 87: 909.
80. Reed DH (2003) Correlation between fitness and genetic diversity. Conserv Biol 17: 230–237.
81. Luijten SH, Dierick A, Oostermeijer JGB, Raijmann LEL, Den Nijs JCM (2000) Population size, genetic variation and reproductive success in the rapidly declining, self-incompatible perennial (Arnica montana) in the Netherlands. Conserv Biol 14: 1776–1787.
82. Oostermeijer JGB, Van Eijck MW, Van Leeuwen NC, Den Nijs JCM (1995) Analysis of the relationship between allozyme heterozygosity and fitness in the rareGentiana pneumonantheL. J Evol Biol 8: 739–757.
83. Bunn E (2005) Development of in vitro methods for ex situ conservation of Eucalyptus impensa, an endangered mallee from southwestern Western Australia. Plant Cell Tiss Org 83: 97–102.
84. Cochrane JA, Crawford AD, Monks LT (2007) The significance of ex situ seed conservation to reintroduction of threatened plants. Aust J Bot 55: 356–361. 85. Li QM, Xu ZF, He TH (2002) Ex situ genetic conservation of endangered
Vatica guangxiensis(Dipterocarpaceae) in China. Biol Conserv 106: 151–156. Genetic Diversity and Structure ofSinopodophyllum hexandrum