Rev Saúde Pública 2005;39(2) www.fsp.usp.br/rsp
Spatial analysis of socioeconomic
determinants of homicide in Brazil
M aria Luiza C de Limaa, Ricardo A de A Ximenesa, Edinilsa Ramos de Souzab, Carlos Feitosa Lunac and M aria de Fátima P M ilitão de Albuquerquec
aFaculdade de Ciências Médicas. Universidade de Pernambuco. Recife, PE, Brasil. bCentro
Latino-Americano de Estudos de Violência e Saúde Jorge Careli. Escola Nacional de Saúde Pública.
Fundação Oswaldo Cruz. Rio de Janeiro, RJ, Brasil. cCentro de Pesquisas Aggeu Magalhães. Fundação
Oswaldo Cruz. Recife, PE, Brasil
Research financed by the Fundação de Amparo à Ciência e Tecnologia of the state of Pernambuco (Facepe - Grant n. 23-CD-08/00-01/01-26).
Received on 18/12/2002. Reviewed on 20/6/2004. Approved on 24/8/2004. Correspondence to:
Maria Luiza C. de Lima
R. Frei Jaboatão, 280 Apto 604 Bloco P Torre 50710-030 Recife, PE, Brasil
E-mail: [email protected]
Keywords
Homicide. Residence characteristics. Socioeconomic factors. Spatial Analysis.
Abstract
Objective
To investigate the association between homicide rates and socio-economic variables taking into account the spatial site of the indicators.
Methods
An ecological study was conducted. The dependent variable was the rate of homicides among the male population aged 15 to 49 years, residing in the districts of the State of Pernambuco from 1995 to 1998. The independent variables were an index of the living conditions, per capita family income, Theil inequality index, Gini index, average income of the head of the family, poverty index, rate of illiteracy, and demographic density. The following techniques were used in the analysis: a spatial autocorrelation test determined by the Moran index, multiple linear regression, a spatial regression model (CAR) and a generalized additive model for the detection of spatial trend (LOESS).
Results
The illiteracy and the poverty index explained 24.6% of the total variability of the homicide rates and there was an inverse relationship. Moran´s I statistics indicated spatial autocorrelation between municipalities. The multiple linear regression model best fitted for the purposes of this study was the Conditional Auto Regressive (CAR) model. The latter confirmed the association between the poverty index, illiteracy and homicide rates.
Conclusions
The inverse association observed between socio-economic indicators and homicides may be expressing a process that propitiates improvement in living conditions and that is linked predominantly to conditions that generate violence, such as drug traffic.
INTRODUCTION
As a public health concern, violence has been ap-proached as a social phenomenon of multiple closely coupled determining elements that eventually lie on an unequal and unfair social structure.1
Studies in Brazil have shown a relationship between homicide violence and living conditions, highlight-ing the role of indicators of social inequality.2-9
Based on a social inequality approach it has been suggested that relatively high homicide rates derive from individuals’ perception of their economic sta-tus comparatively to ideal standards of social suc-cess. Hence, violence would result from these indi-viduals’ frustration of finding themselves in a posi-tion of relative poverty while trying to achieve so-cially legitimate goals.3
Rev Saúde Pública 2005;39(2) www.fsp.usp.br/rsp Socioeconomic determinants of homicides
Lima MLC et al
*Data collected from the Brazilian Ministry of Health website, http: www\ datasus.gov.br [Sept 2002]
island with no direct connection with the other mu-nicipalities.
Mortality data were collected from the Brazilian Ministry of Health Mortality Information System (SIM)* for the period between 1995 and 1998.
Homicides rates were estimated based on the 1991 Demographic Census population and the 1996 popu-lation estimate from the Brazilian Institute of Geog-raphy and Statistics (IBGE).12 In the years between
censuses the population was estimated by projection using a geometrical method.
The study dependent variable was homicide rates. The independent variables were as follows: living condition index (LCI), human development index at local level (HDI-L), Gini coefficient, Theil inequal-ity index, per capita family income, average income of the head of the family, poverty index (proportion of those aged 10 years or more categorized by aver-age monthly income of less than one minimum waver-age), illiteracy rates (proportion of those aged 15 years and more who are not able to read or write) and demo-graphic density. The indicators were selected from the United Nations Development Program (UNDP)13
and the 1991 Demographic Census.12
Multivariate exploratory analysis of independent variables was performed using a correlation matrix to describe the direction and magnitude of associations between indicators.
The spatial autocorrelation was measured by Moran’s I index, which ranges from -1 to +1 and pro-vides the autocorrelation strength. The index is posi-tive for direct correlation and negaposi-tive for inverse correlation. Moran’s index assesses whether linked areas have stronger similarity to the studied indica-tor than that expected in a random distribution.14
In order to assess the relationships between depend-ent and independdepend-ent variables, multivariate linear regression models were analyzed. It was used the for-ward approach for selecting variables. The spatial analysis was carried out using the conditional autoregression (CAR) model,14,15 which provides the
spatial dependency of variables. The effects of spa-tial autocorrelation are associated to the ε error term and the model can be expressed as:
Y = Xβ + ε, ε = λWε + ξ,
where Wε is the error component with spatial ef-fects, λ is the autoregression component and ξ is the point out to other determinants that have strongly
contributed to homicide growth: expanding boot-legging and f irearm possession, illicit drug use, drug trafficking and rivalry over the control of drug-selling points, debt collections and organized groups such as death squads or professional kill-ers. It also should be noted an existing state of non-enforcement of law, slowness of justice, dilapida-tion, loss of prestige and corruption of public law enforcement institutions as well as downfall of ethi-cal principles.1,5,10,11
These factors, among others, are associated in dif-ferent ways to various circumstances that, even if a single model was likely to fully incorporate this com-plex issue, generalization would be restricted to the specific scenario under investigation.
Choosing the method to investigate such a com-plex phenomenon is not a simple undertaking. As there is no all-inclusive explanatory model available on homicides, there have been developed interven-tion proposals but they are almost always skewed and reflect the sectorial viewpoint of their makers.
Technology advances in geoprocessing have al-lowed to incorporating the spatial construction of variables and have benefited to investigate this issue as a specific social phenomenon in its socioeconomic, cultural and environmental setting.
Besides enhancing the explanatory ability, such analysis methods allow to identifying population groups, risk areas and providing guidance to further far-reaching interventions.
The purpose of the present study was to investigate the association between socioeconomic variables and homicide rates taking into account the spatial posi-tion of indicators.
M ETH O D S
In order to investigate homicides using a quantita-tive epidemiological approach, an ecological design was set and spatial analyses were carried out to assess the association of explanatory variables at the group level (socio-economic variables).
!
Rev Saúde Pública 2005;39(2) www.fsp.usp.br/rsp
Socioeconomic determinants of homicides Lima MLC et al
error component with constant non-correlated variance. The null hypothesis for non-autocorrelation is that
λ=0, i.e., the error term has no spatial correlation.15
The quality of the adjustment of the spatial regres-sion model (CAR), similar to that of the multiple re-gression model, is assessed through residual analysis using Moran’s index.
For spatial regression models the determination coefficient cannot be estimated.
After the spatial dependence has been assessed in the CAR model, the model was adjusted by estimat-ing the spatial trend through additive models. The relationship between the response variable and the independent variable is measured using a non-linear function, usually a non-parametric smoothing method such as LOESS method.15 In this model, the response
variable is described by each one of the socio-eco-nomic indicators and the independent variables by the position on the xy coordinates, using the LOESS function as a link:
Y = LOESS (latitude) + LOESS (longitude). The LOESS function is a linear regression where the weight of the observations decreases as it devi-ates from the estimated point. It is thus a local weighted regression.15
After trend was excluded, the CAR model was reapplied.
The following software programs were used in the statistical analysis: SPSS-8.0, S-Plus 2000 with Arcview 3.2.
RESU LTS
The exploratory analysis of correlations between indicators using a correlation matrix (Table 1)
showed that:
• Homicide mortality rates had statistically significant associations with most demographic and living condition indicators, except for the Theil inequality index;
• Among the explanatory variables, the indicators of demographic density, Gini coefficient and Theil index showed weak association with homicide rates (correlation coefficients of 0.25, 0.17 and 0.09 respectively) where as the local human development index (HDI-L), living condition index (LCI), per capita family income and average income of the head of the family showed a positive association of over 0.4. The poverty index and illiteracy rate had also an association of over 4.0, though a negative one, with homicide rates. • The independent variables were strongly
correlat-ed, leading to the exclusion of synthetic indicators such as LCI and HDI-L from the multivariate line-ar regression model, preventing thus multi-collinearity.
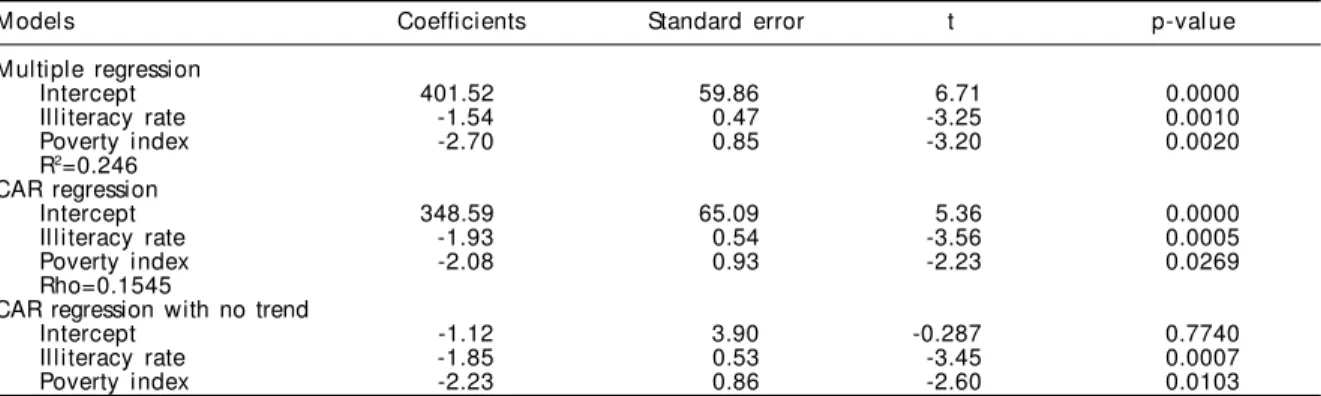
In the multivariate linear regression analysis, after applying the forward approach for variable selection, the ultimate model had only two explanatory vari-ables: illiteracy rate and poverty index. The determi-nation coefficient (R2) found in the adjusted model
showed that 24.6% of the total variation of homi-cides among men aged 15 to 49 years in the munici-palities of the state of Pernambuco can be explained by illiteracy rate and poverty index (Table 2).
The residual analysis of the multiple linear regres-sion model showed a residual disperregres-sion suggesting a non-random distribution. Moran’s statistical test resulted in a 0.254 spatial residual autocorrelation (p=0.000) indicating the need for adjusting vari-ables to a model taking into account a spatial ar-rangement – the CAR.
The CAR model coefficients were close to those found in the multiple linear regression model and
Table 1 - Correlation matrix of indicators of social inequality and homicide rates (1995-98). State of Pernambuco.
Variables Homicide HDI-L LCI Per capita Theil Gini H ead’s Poverty Il l i teracy Demographic
rate family index coeffi ci ent mean index rate density
1995-98 income income
Homicide rate 95-98/100,000 inhabit. 1.000* 0.505* 0.473* 0.439* 0.092 0.175* 0.468* -0.456* -0.457* 0.255*
HDI-L 0.505* 1.000* 0.953* 0.907* 0.385* 0.498* 0.891* -0.793* -0.907* 0.601*
LCI 0.473* 0.953* 1.000* 0.835* 0.290* 0.468* 0.824* -0.751* -0.894* 0.538*
Family income per capita 0.439* 0.907* 0.835* 1.000* 0.379* 0.477* 0.956* -0.848* -0.707* 0.660* Theil inequality index 0.092 0.385* 0.290* 0.379* 1.000* 0.600* 0.299* -0.071 -0.344* 0.206* Gini coefficient 0.175* 0.498* 0.468* 0.477* 0.600* 1.000* 0.473* -0.322* -0.518* 0.289* Average income of the head
of the family 0.468* 0.891* 0.824* 0.956* 0.299* 0.473* 1.000* -0.805* -0.709* 0.682* Poverty index 0.456* 0.793* 0.751* -0.848* -0.071 -0.322* -0.805* 1.000* 0.631* -0.442* Illiteracy rate -0.457* 0.907* 0.894* -0.707* -0.344* -0.518* -0.709* 0.631* 1.000* -0.463* Demographic density 0.255* 0.601* 0.538* 0.660* 0.206* 0.289* 0.682* -0.442* -0.463* 1.000
" Rev Saúde Pública 2005;39(2) www.fsp.usp.br/rsp Socioeconomic determinants of homicides
Lima MLC et al
P E T R O L I N A O U R I C U RI
FL O R E S T A
IN A J A
S E R T A N IA E X U
B O D O C O
IB I M IR I M P A R N A M I R IM
A R A R IP IN A
A FR A N IO
S E R R A TA LH A D A S E R R IT A
IT A IB A B U IQ U E CA B R O B O
S A N T AM A R IAD AB O A V IS T A
FL O R E S
B E T A N IA IP U B I
CU S TO D IA
P E D R A SA L G U E IR O
CAR U A R U
TAC A R A TU
IA T I MIR A N D I B A
P E T R OL AN D I A
IG U A R A C I
PE S Q U E I R A
O R O CO IP O JU C A
B O M C O N S E L H O JA T A U B A
BE L E M D OS A OFR A N C I S C O
A G U A S B E L A S JU P I SA O JO S E D O B E L M O N TE
B O N I TO
S A L O A G R A N I TO
TA B IR A
S UR U BIM
B E L O JA R D IM
G O IA N A
TU P A N A TI N G A
P A S S IR A CA R N A IB A
G RA V ATA TR I UN F O
M O R E IL A N D I A
CA P O E IR A S
A GU A P R E TA A L TI N H O
M A R A I A L
IT A M B E
E S C A D A S A OJO S ED O E G I TO
S IR I N H A E M IG A R A S S U
G A RA N HU NS Q U I P A P A VE RD E J A N TE
B EZ E R R O S IT A P E T IM
V E N T UROS A
A L IAN C A
P A L M E R I N A CU M A R U
IT A C U R U B A P A N E L A S
B R E JO D A M A D RED EDE U S
TI MB A UB A
G A M E L E I RA PA L M AR E S P O C A O
REC IF E TR I ND A D E
A R CO V ER D E IN GA ZE IR A
O RO B O
P A U D A LH O CE D R O
P OM B O S M ORE N O
S A O C A I TA N O
CO R R E N T E S CU P IR A
B A R R E I R O S CA E TE S JU R E M A
CO R T E S TA Q U A R I TI N GAD ON O RTE
N
E
W
S
Approximate scale 1: 4.600.00
Adjusted values of CAR with no trend -83.315 - -27.487 -27.487 - -6.514 -6.514 - 12.078 12.078 - 39.488 39.488 - 94.52
Figure - Risk of homicides in the municipalities of the state of Pernambuco, 1995-98 (adjusted to the CAR model and Loess function).
both were statistically significant (Table 2). The re-sidual analysis of the spatial model had a non-ran-dom variable distribution and Moran’s statistical test (-0.1736, p=0.000) showed autocorrelation. The ulti-mate CAR model, after excluding the spatial trend, showed a marked, though negative or inverse, asso-ciation between illiteracy, poverty and homicide rates (Table 2).
The risk from homicide rates adjusted by the CAR model, after excluding the spatial trend, showed clus-tering. Municipalities with higher risk of homicides were concentrated in the metropolitan development area and in other scattered areas such as the semi-desertic rural area and São Francisco backwoods (Figure).
D ISCU SSIO N
Inconsistent results were found in different studies on the association of violence and socio-economic indicators.16
Variables such as population size and density, Gini coefficient, poverty and unemployment can be either positively or negatively associated with violence17 or
have no association at all with criminal violence, which indicates both the specificity of violence – violence against people’s assets or inflicted to others – and the relationship with other explanatory variables.
In the last two decades an apparently contradictory development has been evidenced: some rich countries where quality of life has been improving (measured by education, health and macroeconomic indicators, wom-en’s social condition, expenditures with national secu-rity, demographic characteristics, political stability, democratic participation and cultural diversity) have shown increasing homicide rates as well.18
Most of all in the 1980s and 1990s, indicators have improved in all development areas13 of the state of
Pernambuco, not only in the living condition index (LCI) but also in other socio-economic indicators such as illiteracy rate among those aged 15 years and more,
Table 2 - Multiple and spatial regression (CAR) models with and with no trend component of homicide rates (1995-98) and the indicators illiteracy rate and poverty index. State of Pernambuco.
M odels Coefficients Standard error t p-val ue
M ultiple regression
Intercept 401.52 59.86 6.71 0.0000
Illiteracy rate -1.54 0.47 -3.25 0.0010
Poverty index -2.70 0.85 -3.20 0.0020
R2=0.246 CAR regression
Intercept 348.59 65.09 5.36 0.0000
Illiteracy rate -1.93 0.54 -3.56 0.0005
Poverty index -2.08 0.93 -2.23 0.0269
Rho=0.1545
CAR regression with no trend
Intercept -1.12 3.90 -0.287 0.7740
Illiteracy rate -1.85 0.53 -3.45 0.0007
Poverty index -2.23 0.86 -2.60 0.0103
#
Rev Saúde Pública 2005;39(2) www.fsp.usp.br/rsp
Socioeconomic determinants of homicides Lima MLC et al
average schooling of those aged 25 years and more, density of more than two people living in the same household, water supply and adequate sewage system. Nonetheless, in 1991, the average illiteracy rate among those aged 15 years and more was still 32.9% and the poverty index among those aged 10 years and more, estimated by the average monthly income of less than one minimum wage, was 76.8%. These statistics point out to persisting structural violence backing mostly the growth of delinquency, characterized by offenses against people and their properties.
In this scenario, homicide rates have increased in Pernambuco by geographic areas showing an inland movement of violence.19
The present study diverges from other previous stud-ies conducted in capitals and states of Brazil in re-gard to both its methods and results. The study find-ing of an inverse association between socio-economic indicators and homicides disagrees with most research findings.2-4,6,9 Concerning the methods, spatial
analy-ses, such as the autoregressive model (CAR) that take into account the spatial position of indicators at the local level, were introduced.2-4,6,9
If, on one side, the association found shows the effect of socio-economic factors, on the other side, the inverse association stresses the complexity of the phenomenon studied. It is thus evidenced a much wider set of connections concerning determination, which was partially spotted by local indicators of spatial autocorrelation (LISA), when clusters were identified in two regions: one in an area known as Polígono da Maconha (marijuana polygon) where municipalities are concentrated in three backwoods development areas (São Francisco backwoods,
Itaparica, Pajeú/Moxotó) and the other in the metro-politan area.20 It should be highlighted the role of
drug trafficking and urbanization in these areas. The inverse association found between the im-provement of relative poverty and illiteracy and homi-cide growth can indicate an existing progression to-ward better living conditions that is mostly linked to circumstances generating violence. It can be hypoth-esized that the process of producing, distributing and dealing marijuana in the polygon region contributed to the increase of the local population’s average in-come, which has been diminished by low value crops, at the expense of escalating violence. In the metro-politan area of the capital Recife, urbanization and marijuana use and trafficking have produced a fertile ground for violence.
It is assumed that, from the findings of studies men-tioned before and the present study, in more industri-alized and urbanized Brazilian states, such as São Paulo and Rio de Janeiro, social inequality could result in a diverse impact from that found in Pernambuco. Also, it should be noted that there could have been aggregation bias due to heterogeneity of the size of the study unit (municipality). However, it would be expected a change in the magnitude of the correlation coefficient instead of the inverse associa-tion seen in the study.
ACKN O W LED GM EN TS
The authors wish to thank Prof. Marília de Sá Carvalho and Prof. Oswaldo Gonçalves Cruz, from the Escola Nacional de Saúde Pública (Fiocruz), for
the references provided concerning the application of the spatial regression model and guidance in the spatial analysis respectively.
REFEREN CES
1. Minayo MCS. Inequality, violence and ecology in Brasil. Cad Saúde Pública 1994;10:241-50.
2. Barata RB, Ribeiro MCSA. Relação entre homicídios e indicadores econômicos em São Paulo, Brasil, 1996. Rev Panam Salud Publica 2000;7:118-24.
3. Beato Filho CC. Determinantes da criminalidade em Minas Gerais. Rev Bras Cienc Soc 1998;13:74-87.
4. Lima MLC, Ximenes RAA. Violência e morte: diferen-ciais da mortalidade por causas externas no espaço urbano do Recife, 1991. Cad Saúde Pública 1998;14:829-40.
5. Drumond Junior M. Homicídios e desigualdades sociais na cidade de São Paulo: uma visão epidemio-lógica. Saúde Soc 1999;8:63-81.
6. Paim JS, Costa MCN, Mascarenhas JCS, Silva LMV. Distribuição espacial da violência: mortalidade por causas externas em Salvador (Bahia), Brasil. Rev Panam Salud Publica 1999;6:321-32.
7. Macedo AC. Violência e desigualdade social: mortalidade por homicídios e condições de vida em Salvador, Brasil. Rev Saúde Pública 2001;35:515-22.
8. Santos SM. Homicídios em Porto Alegre,1996: análise ecológica de sua distribuição e contexto sócio-espacial [dissertação]. Rio de Janeiro: Escola Nacional de Saúde Pública, Fundação Oswaldo Cruz; 1999.
$ Rev Saúde Pública 2005;39(2) www.fsp.usp.br/rsp Socioeconomic determinants of homicides
Lima MLC et al
15. Anselin L. Spatial data analysis with Gis: an introduction to application in the social sciences [monografia on-line]. Santa Bárbara: National Center for Geographic Information and Analisis; 1992. [Technical Report 92-10]. Disponível em URL: http:// www.statlab.stat.yale.edu/ssda/world_spatial.html [abr 2002]
16. Land KC, MCCall PL, Conhen LE. Structural covariates of homicide rates: are there any invariances accross time and social space? Am Soc Rev 1990;95:922-63.
17. Messneer SF. Poverty, inequality, and the urban homicide rate. Criminology 1982;20:103-14.
18. Lester D. Suicide, homicide and the quality of life in various countries. Acta Psychiatr Scand 1990;81:332-4.
19. Lima MLC, Souza ER, Ximenes RAA, Albuquerque MFPM, Bitoun J, Barros MDA. Evolução dos homicídi-os em Pernambuco: análise por área geográfica, de 1980 a 1998. Rev Saúde Pública 2002;36:426-9.
20. Lima MLC, Ximenes RAA, Souza ER, Luna CF, Souza WV et al. Death from homicides in the state of Pernambuco, Brazil, beyond the socioeconomic determinants. Pan Am J Public Health. In press; 2005. 10. Szwarcwald CL, Castilho E. Mortalidade por armas
de fogo no Estado do Rio de Janeiro, Brasil: uma análise espacial. Rev Panam Salud Pública 1998;4:161-70.
11. Dellasoppa E, Bercovich AM, Arriaga E. Violência, direitos civis e demografia no Brasil na década de 80: o caso da área metropolitana do Rio de Janeiro. Rev Bras Cienc Soc 1999;14:155-76.
12. Fundação Instituto Brasileiro de Geografia e Estatísti-ca [IBGE]. Censo demográfico do Brasil 1991. Pernambuco; 1994. p. 291-305.
13. Programa das Nações Unidas para o desenvolvimen-to/Instituto de Pesquisa Econômica e Aplicada [PNUD/IPEA ]. Relatório sobre o desenvolvimento humano no Brasil. Brasília (DF): PNUD/IPEA; 1996.