Vilma Pinheiro GawryszewskiI Herlander Manoel Mendes CoelhoII
Sandro ScarpeliniIII Renato ZanIV
Maria Helena Prado de Mello JorgeV
Eugênia Maria Silveira RodriguesVI
I Centro de Vigilância Epidemiológica. Secretaria de Saúde do Estado de São Paulo (SES/SP). São Paulo, SP, Brasil
II Hospital Geral do Grajaú. SES/SP. São Paulo, SP, Brasil
III Faculdade de Medicina de Ribeirão Preto. Universidade de São Paulo (USP). Ribeirão Preto, SP, Brasil
IV Irmandade da Santa Casa de Misericórdia de São Paulo. São Paulo, SP, Brasil V Faculdade de Saúde Pública-USP. São
Paulo, SP, Brasil
VI Organização Pan-Americana de Saúde. Washington, D.C., USA
Correspondence:
Vilma Pinheiro Gawryszewski Av. Dr. Arnaldo, 351 sala 609 Cerqueira César
01246-902 São Paulo, SP, Brasil E-mail: [email protected] Received: 10/11/2007 Revised: 7/8/2008 Approved: 8/7/2008
Land transport injuries among
emergency department visits in
the state of São Paulo, in 2005
ABSTRACT
OBJECTIVE: To analyze the characteristics of visits resulting from land transport injuries.
METHODS: A total of 5,934 visits in four hospital emergency departments (ED) were analyzed, in the state of São Paulo, in 2005. A questionnaire based on the following three models was used to collect data: World Health Organization (WHO), Center for Disease Control and Prevention (CDC), and Pan American Health Organization (PAHO). Variables analyzed were as follows: type of road user (vehicle occupant, pedestrian, motorcyclist, and cyclist), sex, age group, and type of injury suffered. Logistic regression analysis was employed to test associations between variables. Odds ratios with their respective 95% confi dence intervals were calculated.
RESULTS: The majority of victims were males (74.2%) in the 20-to-29-year age group (35.0%). Vulnerable road users totaled 72.4% of all cases (29.8% were motorcyclists, 24.1% pedestrians, and 18.5% cyclists). Victims aged between zero and 14 years who had suffered injuries were mostly pedestrians and cyclists; motorcyclists predominated among those aged between 15 and 39 years; and pedestrians among those aged over 50 years. About half of the cases suffered minor injuries (strains, dislocations, contusions and cuts), while the other half was comprised by fractures, traumatic brain injuries and internal injuries. Extremities were the most affected body parts, particularly among motorcyclists. The majority of victims were discharged at triage (87.6%). Compared to women, men were 1.5 times more likely to be admitted or transferred, or to die. Pedestrians, vehicle occupants and motorcyclists were, respectively, 2.7, 2.4 and 1.9 times more likely to be admitted or transferred, or to die than cyclists.
CONCLUSIONS: Measures aimed to protect vulnerable road users should be among the priorities to reduce land transport-related injuries.
DESCRIPTORS: Traffi c Accidents. Risk Factors. First Aid. Emergency Medical Care. External Causes.
INTRODUCTION
Land transport accidents refer to injuries associated with the fl ow of vehicles and people on public roads, according to the classifi cation from the International Classifi cation of Diseases, 10th Revision (ICD-10). Such accidents represent a
released a world report12 with mortality rates from
several countries, where Brazil came in fi fth place in the world ranking. This report also pointed out this problem’s iniquity of impact, once the majority of injuries and deaths occurred in developing countries, affecting pedestrians, cyclists, and public transport us-ers particularly, many of whom lack the resources to acquire a motor vehicle. In addition, this report made public an important concept for prevention policies, that of vulnerable road users, including pedestrians, cyclists, and motorcyclists.
Currently, traffi c protection policies are still geared toward motor vehicle users. However, only by guaran-teeing equal protection to vulnerable road users can a reduction in land transport-related injuries be achieved. Estimates from developed countries suggest that 80% of the total costs associated with vehicle collisions can be attributed to non-fatal events.1 Thus, this type of study
is essential to establish evidence-based interventions. In December of 2005, there were over 14 million regis-tered motor vehicles in the state of São Paulo, including cars, trucks, buses and other types of vehicles, represent-ing 37% of the total number of vehicles nationwide.a
This means a proportion of about 2.8 inhabitants per vehicle in this state. In the city of São Paulo this pro-portion was almost two inhabitants per vehicle,a which
led to the “urban mobility crisis”,15 one of the factors
that contributed to the motoboy boom (professional motorcycle messengers). It is not diffi cult to imagine that this increase in motor-vehicle use can cause several problems for the population, including injuries. In terms of fatal injuries, analysis of data available in the Sistema de Informações de Mortalidade (SIM – Mor-tality Information System) of the Ministry of Health/
DATASUS (Unifi ed Health System’s Computer Depart-ment), for the state of São Paulo, in 2005, revealed that mortality rates from land transport-related injuries were 17.7 per 100,000 inhabitants, coming in second place among external causes. However, analysis on type of road user does not provide accurate information, once the majority of deaths were classifi ed as ”other land transport accidents” (45.8%). Previous studies showed that these problems are also important causes of hospitalizations in the Sistema Único de Saúde (SUS – Unifi ed Health System).7,10 These represent a substantial cost to the SUS, once hospitalizations resulting from land transport accident injuries are more expensive than those due to natural causes as a whole.10 However, there are few
stud-ies showing morbidity in emergency departments. Thus, seeking to fi ll the gap of knowledge about the more general characteristics of these problems, the present study aimed to analyze the characteristics of
a Secretaria de Estado dos Transportes de São Paulo. Os transportes no Estado de São Paulo: balanço anual dos acidentes rodoviários, São Paulo 2005. [Report]
morbidity resulting from land transport-related injuries in hospital emergency department services, emphasiz-ing the analysis of categories of road users.
METHODS
The data analyzed are part of a study entitled “Non-fatal violence victims”, coordinated by the São Paulo State Department of Health. Data on visits made due to all external causes, in emergency departments selected in the state of São Paulo, were collected.8
This study has a cross-sectional design, and the target population is comprised by all the emergency depart-ment visits resulting from land transport-related inju-ries. Four emergency departments (ED) participated in the data collection, of which three (ED 1, ED 2, ED 3) are in the city of São Paulo and one in the countryside (city of Ribeirão Preto – ED 4). These hospitals were selected because they are large hospitals with 24-hour ED, whose service is highly regarded in their area. The defi nition considered to categorize a case as land transport-related injury was that recommended by the WHO:12 “collision involving at least one motor vehicle
in motion, on a public or private road, resulting in at least one person with fatal or non-fatal injury”. A road user was considered to be “an individual using any part of the road system as a motor vehicle occupant or otherwise”.12 Cases were classifi ed into fi ve categories
of road users, according to the National Electronic Injury Surveillance System (NEISS) concepts,18 used
by the surveillance system at emergency departments in the United States:
Motor vehicle occupant: Injury to a driver or pas-•
senger of a motor vehicle caused by a collision, rollover, crash, or other event involving another vehicle, an object, or a pedestrian and occurring on a public highway, street, or road (i.e., originating on, terminating on, or involving a vehicle partially on the highway). This category includes occupants of cars, pickup trucks, vans, heavy transport vehicles, buses, and sport utility vehicles (SUVs).
Motorcyclist: Injury to a driver or passenger of •
a motorcycle resulting from a collision, loss of control, crash, or other event involving a vehicle, object, or pedestrian. This category includes drivers or passengers of motorcycles (i.e., classic style), sidecars, mopeds, motorized bicycles, and motor-powered scooters.
Pedestrian (struck by/against a vehicle): Injury to •
a motor vehicle, railway train, motorcycle, bicycle, airplane, streetcar, animal-drawn vehicle, or other vehicle. This category includes people struck by cars, pickup trucks, vans, heavy transport vehicles, buses, motorcycles, bicycles, and SUVs.
Cyclist: Injury to a cyclist from a collision, loss •
of control, crash, or an event involving a moving vehicle or pedestrian. This category includes riders of bicycles, tricycles, and mountain bikes, but excludes injuries unrelated to transportation (i.e., moving) (e.g., repairing a bicycle).
Other transport: Injury to a person boarding, •
alighting, or riding in or on all other transport vehicles involved in a collision or other event with another vehicle, pedestrian, or animal not described previously.
Data collection was carried out during the period of one year in ED 1 to 4 (December 2004 to November 2005) and six months in ED 2 (January to June 2005) and ED 3 (July to December 2005). Different periods of study were due to operational reasons. The instrument used to collect data was a questionnaire designed from models provided by the World Health Organization (WHO),10
Centers for Disease Control and Prevention (CDC) and Pan American Health Organization (PAHO), which have been used for data collection in emergency depart-ments, in some Latin American countries.
An application to input data into the EpiInfo 2002 soft-ware program, version 3.3.2., was designed. Variables selected were the following: 1) demographics (sex, age, ethnicity, profession and level of education); 2) type of road user (motor vehicle occupant, motorcyclist, pedestrian, cyclist, or other); 3) injury characteristics (primary diagnosis and affected body part); 4) discharge status (treated and released, admitted/transferred or deceased). This information was analyzed as crude numbers and proportions.
A logistic regression model was used, aiming to assess variables associated with the discharge status. The de-pendent variable was discharge status, compiled into two categories (discharged and admitted, transferred or deceased). Independent variables were as follows: sex, compiled age group (<15 years, 15 to 29 years, 30 to 49 years and 50 years or older) and type of road user. Odds ratios (OR) were calculated, with their respective 95% confi dence intervals (CI). Tests were conducted with a 5% signifi cance level. Analyses were performed in the SPSS software program, version 13.0.
The research project was approved by the Comitê de
Ética em Pesquisa da Irmandade Santa Casa de Miser-icórdia de São Paulo (City of São Paulo’s Holy House of Mercy Brotherhood Research Ethics Committee).
RESULTS
There were 5,934 cases of injuries associated with land transport, corresponding to 11.6% of all visits resulting from external causes, in the period of study. The Tables and Figure only show the cases with in-formation provided.
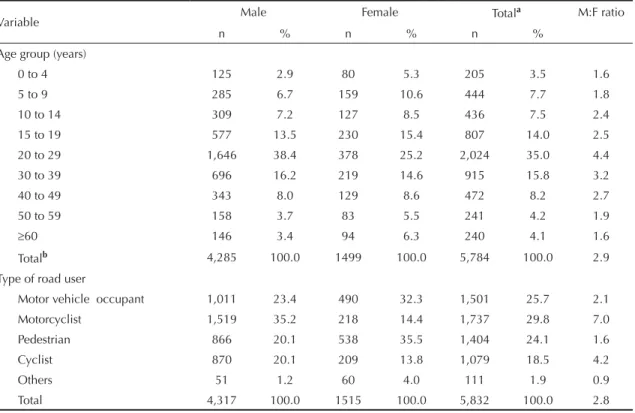
Table 1 show the distribution of visits, according to sex, age group and type of road user and/or public road. Men comprised 74.2% of all visits and women, 25.8%. Sex was not informed for 102 cases (1.7% of the total). The male/female ratio was 2.9, though it varied according to age group, being higher in the 20-to-29-year group and lower among infants aged less than fi ve years and adults aged 60 years or older. This ratio also varied in terms of type of road user, reaching 7.0 among motorcyclists and 4.2 among cyclists. Young adults, aged between 20 and 29 years, concen-trated the highest proportion of cases, followed by the 30-to-39-year and 15-to-19-year age groups. However, the ratio of number of visits to age group revealed the importance of these injuries among the younger groups. The 20-to-29-year age group remained in the fi rst place with 202.4 visits/year of age, followed by the 15-to-19-year age group with 161.4 visits/year of age, the 30-to-39-year age group with 91.5 visits/ year of age, and the 5-to-9-year age group with 88.8 visits/year of age.
Table 2 shows road user categories according to the age group, level of education, primary diagnosis, af-fected body part and discharge status. In terms of level of education, the majority of individuals aged over 18
years reported having completed elementary school, even though the proportion of cases varied according to the road user category. Among motorcyclists, the majority reported having completed high school. Body extremities were the most affected body parts in all road user categories, but particularly among motorcyclists. About half of the cases showed injuries that could be classifi ed as less severe (strains, dislocations, contu-sions, and cuts), whereas the other half was comprised by more severe injuries, such as fractures, traumatic brain injuries and internal injuries.
The majority of cases were treated and released (87.6%), while 11.0% were either admitted or trans-ferred and 1.4% deceased. The percentages of admit-tance and deaths were higher among pedestrians. Table 3 shows logistic regression results; men were 1.5 times more likely to be admitted or transferred or to die than women. Compared to the youngest age group (zero to 14 years), individuals aged 50 years or older were 1.54 times more likely to be admitted or transferred or to die, whereas this chance was 64% lower in the 15-to-29-year age group. Compared to cyclists, pedestrians were 2.73 times more likely to be admitted or transferred or to die; motor vehicle occupants, 2.36 times; and motorcyclists, 1.93 times.
Table 1. Distribution of visits due to land transport-related injuries, according to age group and type of road user. State of São Paulo, Southeastern Brazil, 2005.
Variable Male Female Total
a M:F ratio
n % n % n %
Age group (years)
0 to 4 125 2.9 80 5.3 205 3.5 1.6
5 to 9 285 6.7 159 10.6 444 7.7 1.8
10 to 14 309 7.2 127 8.5 436 7.5 2.4
15 to 19 577 13.5 230 15.4 807 14.0 2.5
20 to 29 1,646 38.4 378 25.2 2,024 35.0 4.4
30 to 39 696 16.2 219 14.6 915 15.8 3.2
40 to 49 343 8.0 129 8.6 472 8.2 2.7
50 to 59 158 3.7 83 5.5 241 4.2 1.9
≥60 146 3.4 94 6.3 240 4.1 1.6
Totalb 4,285 100.0 1499 100.0 5,784 100.0 2.9
Type of road user
Motor vehicle occupant 1,011 23.4 490 32.3 1,501 25.7 2.1
Motorcyclist 1,519 35.2 218 14.4 1,737 29.8 7.0
Pedestrian 866 20.1 538 35.5 1,404 24.1 1.6
Cyclist 870 20.1 209 13.8 1,079 18.5 4.2
Others 51 1.2 60 4.0 111 1.9 0.9
Total 4,317 100.0 1515 100.0 5,832 100.0 2.8
a Total does not include 102 cases for which there was no information about sex.
b Total does not include 150 cases for which there was no information about sex and age.
Figure. Proportional distribution of emergency departments visits due to land transport-related injuries, according to age group and type of road user. State of São Paulo, Southeastern Brazil, 2005.
0.0 10.0 20.0 30.0 40.0 50.0 60.0 70.0
0 to 4
5 to 9
10 to 14
15 to 19
20 to 29
30 to 39
40 to 49
50 to 59
60 and older Years
%
Motor vehicle occupant Motorcyclist
DISCUSSION
In the fi ndings of this study, the group of motorcyclists was responsible for the majority of ED visits. Most of them are young workers, with low professional quali-fi cation, whose services have become often required in urban areas of the state. There is an inherent risk in this type of work, as it is currently performed, which lies in the demand for fast deliveries. Urgency is “as important in the work of a motoboy as to guarantee their job”.17 A
qualitative study in the city of Campinas, in the state of São Paulo, while discussing the relationship between motorcyclists and traffi c violations, pointed out that the motorcycle was viewed by them as a symbol of adventure and challenge.5 Among several intervention
strategies to reduce these injuries are: the creation of
motorcycle-only lanes on high-risk roads; qualifi ca-tion courses for motoboys, given by more experienced motorcyclists;13 use of bright-colored clothing and
accessories; promotion of traffi c rules of sociability;13
and the involvement of employers and service clients with safety issues. The lowest percentage of head/ face injuries among motorcyclists, compared to other road users, found in this study, for example, may have resulted from the fact that helmet use is mandatory in Brazil. The United Kingdom reached a 25% reduction in injuries among young motorcyclists by restricting access to more powerful motorcycles.1
In major urban areas, pedestrians usually represent a considerable proportion of those injured in traffi c.14 In
New York city, between 1998 and 2002, pedestrians
Table 2. Distribution of frequencies of types of road users, according to level of education, primary diagnosis, affected body part and discharge status. State of São Paulo, Southeastern Brazil, 2005.
Variable
Vehicle
occupant Motorcyclist Pedestrian Cyclist Others Total
n % n % n % n % n % n %
Level of educationa
Illiterate 11 1.5 5 0.5 31 5.1 7 2.8 2 3.4 56 2.1
Elementary school 327 46.3 401 41.5 347 57.3 157 62.8 33 55.9 1,265 48.9
High-school 302 42.7 521 53.9 215 35.5 80 32.0 21 35.6 1,139 44.0
University 67 9.5 40 4.1 13 2.1 6 2.4 3 5.1 129 5.0
Total 707 100.0 967 100.0 606 100.0 250 100.0 59 100.0 2,589 100.0
Primary diagnosis
Fracture 149 10.0 292 17.0 196 13.9 166 15.2 14 12.4 817 14.1
Strain/dislocation/
contusion 395 26.6 622 36.3 374 26.6 339 31.1 54 47.8 1,784 30.7
Cut 249 16.7 338 19.7 212 15.1 298 27.4 12 10.6 1,109 19.1
TBI 242 16.3 155 9.0 213 15.1 181 16.6 19 16.8 810 13.9
Internal injury 19 1.3 10 0.6 13 0.9 6 0.6 - - 48 0.8
Others 432 29.1 299 17.4 400 28.4 99 9.1 14 12.4 1,244 21.4
Totalb 1,486 100.0 1,716 100.0 1,408 100.0 1,089 100.0 113 100.0 5,812 100.0
Affected body part
Head/face 476 41.0 240 17.2 346 32.3 361 37.5 28 28.9 1451 30.9
Thorax/abdomen/
pelvis 147 12.7 77 5.5 91 8.5 66 6.8 15 15.4 396 8.5
Extremities 537 46.3 1,081 77.3 634 59.2 537 55.7 54 55.7 2,843 60.6
Totalb 1,160 100.0 1,398 100.0 1,071 100.0 964 100.0 97 100.0 4,690 100.0
Discharge status
Treated and released 1,280 86.2 1,519 89.1 1,154 82.7 995 92.9 102 94.4 5,050 87.6
Admitted/transferred 178 12.0 168 9.9 209 15.0 72 6.7 6 5.6 633 11.0
Deceased 27 1.8 17 1.0 33 2.3 4 0.4 - - 81 1.4
Totalb 1,485 100.0 1,704 100.0 1,396 100.0 1,071 100.0 108 100.0 5,764 100.0
aIncludes the population aged 18 years or older exclusively.
bTotals do not include cases with unknown information on variable under study (122 cases without information on primary
accounted for almost half of the deaths.14 In the
pres-ent study, they represpres-ented a signifi cant number of ED visits in all age groups. In addition, logistic regression showed that, compared to cyclists, pedestrians were the road users with highest probability of injuries resulting in admittance or death. Such fact is expected, given the fragility of the human body in a collision with a vehicle. The risk of a pedestrian dying as a result of a run-over is approximately 80% if the vehicle is moving at 50 kilometers an hour (km/h), and 10% if the vehicle is at 30km/h.12 In this way, traffi c jams, common in large
cities of the state of São Paulo, can contribute to protect motor vehicle occupants, by preventing vehicles from moving at high speeds, but not pedestrians. Educational campaigns have been suggested as a key component to prevent pedestrian injuries, especially among children and the elderly.12 In Brazil, differently from several
developed countries, it is still necessary to promote respect for basic traffi c rules among all road users, such as respect for pedestrian crosswalks and traffi c signs. Some measures have proved to be effective, such as speed reduction in high-risk locations, residential areas and around schools.1 A study aimed at measuring the
impact before and after the introduction of speed bumps in Ghana showed a reduction of 51% in annual pedestrian deaths in this country.1 The introduction of speed
cam-eras in locations at high risk of collision led to a reduction of 56% in fatal and non-fatal injuries among pedestrians in the United Kingdom and 28% in South Korea.1
High proportions of injuries among motorcyclists and pedestrians are expected. However, there was a sub-stantial percentage of cyclists attended, even though these road users are not usually in Brazilian studies on
this issue. In the present study, these events were more important among children aged between fi ve and 14 years, and it was not possible to determine how much of these injuries occurred during leisure activities. Bi-cycles do not usually move at high speeds, compared to motorcycles. Thus, some of these cases probably do not result from collisions, but rather from a loss of control of the bicycle, among other possibilities. This would explain the higher proportion of discharges in this group, compared to other road users. In addition, US emergency departments’ 2004 data on injuries among cyclists showed that the age group between ten and 14 years was at higher risk for such injuries.9 It also showed that
the body extremities and, subsequently, the head/face were the most affected body parts.9 The use of helmets
among cyclists is low worldwide, despite the evidence that its use can reduce the risk of traumatic brain injury in this group to between 63% and 88%.12 Bicycle lanes
are also a measure with proven effectiveness.12
By interpreting the results from this study, some limi-tations stand out. One of them was the impossibility to use a more accurate severity measure, such as the Glasgow Coma Scale or another equivalent scale, as this would imply the use of a more complex question-naire and training courses for doctors, which could compromise data collection viability. Another limita-tion of the study concerns data generalizalimita-tion, which is compromised because the hospitals selected are not a representative sample of the state of São Paulo, thus not enabling rate calculation. On the other hand, sev-eral fi ndings of the present study are consistent with scientifi c literature data and can be generalized. The predominance of land transport-related injuries among males and young people is a common fi nding in Brazil7
and abroad.12,18 Data from the cities of Catanduva3 and
Londrina,2 Southeast and Southern Brazil, respectively,
also showed that motorcyclists accounted for the high-est proportions of land transport-related, non-fatal ED visits. The importance of pedestrians in the public sys-tem’s mortality and hospitalizations was also indicated by other studies.7,16 The predominance of cyclists, aged
19 years or younger, among non-fatal victims of land transport-related injuries was also observed in a hospital of the state of Minas Gerais.6
Finally, it is necessary to point out that the repercus-sions of traffi c on human health go beyond injuries. One intervention named “traffi c calming”, more com-monly adopted by European countries, have proved to be promising to reduce fatal and non-fatal injuries.4
This concept concerns a set of strategies used by urban traffi c engineers and planners that aim to slow down or reduce traffi c. This improves pedestrians and cyclists’ safety, and the environment for residents, and it also contributes to the reduction of noise and air pollution. In addition, better enforcement of current laws is an important factor to be considered. It is estimated that,
Table 3. Odds ratio (OR) comparing cases that were treated and released and cases that were admitted, transferred, or deceased. State of São Paulo, Southeastern Brazil, 2005.
Variable Adjusted OR p
(95% CI)
Sex
Male 1.51 (1.24;1.84) <0.01
Female 1.00
Age group (years)
0 to 14 1.00
15 to 29 0.64 (0.50;0.83) <0.05
30 to 49 1.05 (0.81;1.35) NS
≥50 1.54 (1.14;2.10) <0.05
Type of road user
Motor vehicle occupant 2.36 (1.75;3.18) <0.01
Motorcyclist 1.93 (1.42;2.62) <0.01
Pedestrian 2.73 (2.05;3.63) <0.01
Cyclist 1.00 <0.01
if all traffi c safety laws in the European Union were effectively enforced, related deaths and injuries would be reduced by 50%.1
Findings from the present study were consistent with WHO evidence that vulnerable road users represent
the majority of traffi c-injured victims,11 especially in
low- and average-income countries.1 In the state of São
Paulo, in particular, due to the large number of motor vehicles and inhabitants, to share the road system in a safe way is one of the greatest challenges for society and governmental authorities.
1. Ameratunga S, Hijar M, Norton R. Road-traffi c injuries: confronting disparities to address a global-health problem. Lancet. 2006;367(9521):1533-40. DOI:10.1016/S0140-6736(06)68654-6
2. Bastos YGL, Andrade SM, Soares DA. Características dos acidentes de trânsito e das vítimas atendidas em serviço pré-hospitalar em cidade do Sul do Brasil, 1997/2000. Cad Saude Publica. 2005;21(3):815-22. DOI:10.1590/S0102-311X2005000300015
3. Batista SEA, Baccani JG, Silva RAP, Gualda KPF, Viana Jr RJA. Análise comparativa entre os mecanismos de trauma, as lesões e o perfi l de gravidade das vítimas, em Catanduva - SP. Rev Col Bras Cir. 2006;33(1):6-10. DOI:10.1590/S0100-69912006000100003
4. Bunn F, Collier T, Frost C, Ker K, Roberts I, Wentz R. Area-wide traffi c calming for preventing traffi c related injuries. Cochrane Database Syst Rev. 2003;(1):CD003110.
5. Diniz EPH, Assunção AA, Lima FPA. Prevenção de acidentes: o reconhecimento das estratégias operatórias dos motociclistas profi ssionais como base para a negociação de acordo coletivo. Cienc Saude Coletiva. 2005;10(4):905-16. DOI: 10.1590/S1413-81232005000400014
6. Gaspar VLV, Lamounier JA, Cunha FM, Gaspar JC. Fatores relacionados a hospitalizações por injúrias em crianças e adolescentes. J Pediatr (Rio J). 2004;80(6):447-52. DOI:10.1590/S0021-75572004000800005
7. Gawryszewski VP, Rodrigues EM. The burden of injury in Brazil, 2003. Sao Paulo Med J. 2006;124(4):208-13. DOI:10.1590/S1516-31802006000400007
8. Gawryszewski VP, Scarpelini S, Dib JA, Mello Jorge MHP, Pereira Junior GA, Morita M. Atendimentos de emergência por lesões decorrentes de causas externas: características das vítimas e local de ocorrência, Estado de São Paulo, Brasil, 2005. Cad Saude Publica. 2008;24(5):1121-9. DOI: 10.1590/S0102-311X2008000500019
9. Haileyesus T, Annest JL, Dellinger AM. Cyclists injured while sharing the road with motor vehicles. Inj Prev. 2007;13(3):202-6. DOI:10.1136/ip.2006.014019
10. Holder Y, Peden M, Krug E, Lund J, Gururaj G, Kobusingye O. Injury surveillance guidelines. Geneva: World Health Organization; 2001.
11. Jorge MHPM, Koizumi MS. Gastos governamentais do SUS com internações hospitalares por causas externas: análise no Estado de São Paulo, 2000. Rev Bras Epidemiol. 2004;7(2):228-38. DOI:10.1590/S1415-790X2004000200012
12. Peden M, Scurfi eld R, Sleet D, Mohan D Hyder AA, Jarawan E, et al. World report on road traffi c injury prevention. Geneva: World Health Organization; 2004.
13. Queiroz MS, Oliveira PCP. Acidentes de trânsito: uma análise a partir da perspectiva das vítimas em Campinas. Psicol Soc. 2003;15(2):101-23. DOI: 10.1590/S0102-71822003000200008
14. Nicaj L, Wilt S, Henning K. Motor vehicle crash pedestrian deaths in New York City: the plight of the older pedestrian. Inj Prev. 2006;12(6):414-16. DOI:10.1136/ip.2005.010082
15. Scaringella RS. A crise da mobilidade urbana em São Paulo. Sao Paulo Perspec. 2001;15(1):55-9. DOI:10.1590/S0102-88392001000100007
16. Souza ER, Lima MLC. The panorama of urban violence in Brazil and its capitals. Cienc Saude Coletiva. 2006;11(2):363-73. DOI:10.1590/S1413-81232006000200014
17. Veronese AM, Oliveira DLLC. Os riscos dos acidentes de trânsito na perspectiva dos moto-boys: subsídios para a promoção da saúde. Cad Saude Publica. 2006;22(12):2717-21. DOI:10.1590/S0102-311X2006001200021
18. Vyrostek SB, Annest JL, Ryan GW. Surveillance for fatal and nonfatal injuries – United States, 2001. MMWR Surveill Summ. 2004;53(7):1-57.
REFERENCES