Nádia Kunkel
Walter Ferreira de Oliveira Marco Aurélio Peres
Programa de Pós-Graduação em Saúde Pública. Centro de Ciências da Saúde Universidade Federal de Santa Catarina. Florianópolis, SC, Brasil
Correspondence:
Nádia Kunkel
Centro de Ciências da Saúde, Programa de Pós-Graduação em Saúde Pública Universidade Federal de Santa Catarina Campos Universitário Trindade 88040-970 Florianópolis, SC, Brasil E-mail: [email protected] Received: 21/11/2007 Revised: 11/9/2008 Approved: 29/9/2008
Overweight and health-related
quality of life in adolescents of
Florianópolis, Southern Brazil
ABSTRACT
OBJECTIVE: To assess health- related quality of life and its association to excess weight in adolescents.
METHODS: Cross-sectional study including 467 adolescents aged 15 to 18 years enrolled in a public school in Florianopolis, Southern Brazil, and their parents, conducted in 2007. Overweight and obesity were defi ned according to the body mass index. The combination of overweight and obesity was defi ned as excess body weight. Health-related quality of life was assessed using the Pediatric Quality of life Inventory (PedsQL) 4.0 for adolescents and their parents. Descriptive statistics and unadjusted and adjusted logistic regression analyses were performed.
RESULTS: The response rate was 99.4% among adolescents and 53.4% among their parents. The prevalence of overweight was 12.2% and obesity was 3.6%. The group of adolescents with excess weight had lower health-related quality of life when compared with those who were not excess weight, except for the emotional domain in the adolescents, and the psychosocial health domain for the parents. After adjusting, adolescents with excess weight were 3.54 (95% CI 1.4;6.47) folds more likely to have low quality of life than those with no excess weight. Female adolescents had lower quality of life scores.
CONCLUSIONS: Health-related quality of life was signifi cantly lower in adolescents with excess weight excess. Public health actions directed to weight control in adolescents and instruments for quality of life measures are major instruments for a better thorough understanding of this important public health problem.
DESCRIPTORS: Adolescent. Overweight. Obesity. Quality of Life. Questionnaires, utilization. Adolescent Health. Cross-Sectional Studies.
INTRODUCTION
Obesity is a public health concern worldwide affecting children, adolescents, adults, and the elderly.19 In Brazil the prevalence of excess body weight
(over-weight plus obesity) in adolescents increased from 2.6% to 11.8% in boys and from 5.8% to 15.3% in girls between 1975 and 1997.17 Based on the same
clas-sifi cation criteria, the Family Budget Survey (POF) conducted by the Brazilian Institute of Geography and Statistics (IBGE) in 2002–20003 found a prevalence of 23.6% and 17.1% of overweight and 3.3% and 2,9% of obesity in same-age male and female adolescents, respectively, in urban areas of southern Brazil.a
A 2003 study including school adolescents in the city of Florianópolis reported 12% prevalence of overweight.5
a Klatchoian DA. Confi abilidade da versão brasileira do questionário genérico de qualidade de vida pediátrica versão 4.0 (pedsql 4.0) [doctorate thesis]. São Paulo: Universidade Federal de São Paulo; 2007.
It is estimated that 50% of obese children will become obese adults.14 In addition, they are very likely to
de-velop other related conditions such as diabetes mellitus, cardiovascular diseases, atherosclerosis, arterial hyper-tension, orthopedic and joint disorders, skin diseases, and higher surgical risk, among other complications.2
Increased prevalence of excess body weight during childhood and adolescence has stirred renewed interest in the study of psychosocial outcomes of these condi-tions at this age group because they may have major psychosocial consequences.20 A critical time point for
the development of obesity is early adolescence,8 a life
phase when adolescents have constant concern about their body weight, envisaging an ideal of beauty, im-posed by the lean, slender body type. Non-acceptance of one’s own body can make adolescents feel socially marginalized.20
Studies on health-related quality of life (HRQL) in obese individuals have become increasingly common. Most have investigated adults but those few focusing on adolescents have showed a strong consistent association between low HRQL and obesity.9,11,21 Further studies are
needed in this population in Brazil. A search conducted in Medline, Lilacs, and Scielo database in July 2006 did not fi nd any Brazilian study investigating weight and HRQL issues in adolescents.
To test the hypothesis that HRQL is lower among adolescents with excess body weight compared to their peers with non-excess body weight, the objective of the present study was to assess quality of life of adolescents and its association with excess body weight.
METHODS
A cross-sectional analytical study was carried out in students attending a public high school in the city of Florianópolis, southern Brazil, in 2007. The sample size was estimated considering a 1:4 ratio of exposed/non-exposed (excess body weight/non-excess body weight) and negative HRQL of 15% in non-exposed and 30% in exposed. To that it was added 20% to compensate losses and refusals. The sample had 80% power at a 95% level of confi dence. Sample selection was proportional to the number of students enrolled in each grade. A systematic sampling was carried out in each class.
The inclusion criteria were: being under the age of 18 and enrolled in the study school. There were ex-cluded pregnant adolescents and those with physical disabilities that prevented or affected anthropometric measures. Of about 2,400 students enrolled in the high school program, 470 were drawn to participate in the study.
The outcome was HRQL measured using the Pediatric Quality of Life Inventory (PedsQL) 4.0, validated in Brazil.a This questionnaire has a module format
de-signed to assess HRQL of children and adolescents aged between two and 18 years.15 It was conceived to
mea-sure scores of physical, mental, and social health dimen-sions as described by the World Health Organization and taking into consideration their school functioning as well.16 A self-administered PedsQL for adolescents
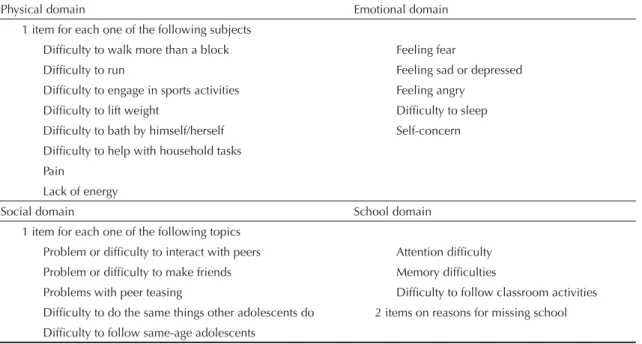
aged between 13 and 18 years was used. It comprised 23 items divided into four domains: physical, emotional, social and school functioning. Table 1 describes the items of each domain. This instrument consists of two parallel questionnaires, one for adolescents and one for parents. This latter was designed to assess parents’ perception of their children HRQL.
Quality of life was measured through psychometric analysis using a fi ve-point Likert scale: 0 = never was a problem; 1 = almost never; 2 = sometimes; 3 = fre-quently; 4 = always). Items were scored, and linearly converted into a 0 to 100 scale (0 = 100; 1 = 75; 2 = 50; 3 = 25; and 4 = 0). All items were then summed up and divided by the number of questions answered. The higher the score, the better the quality of life.16
Besides the PedsQL scale, partial physical (physi-cal health subs(physi-cale) and psychosocial health (mean emotional, social, and school subscales) scales were measured.15
Excess body weight (overweight plus obesity) was measured using the body mass index (BMI = weight [kg] / height [m2]) by gender and age. The classifi
ca-tion criterion applied for the diagnosis of overweight and obesity was based on the BMI cutoff ≥25 kg/m2 for
adults (Cole et al3). Weight was measured using a digital
scale (Tanita) with 150-kg capacity and 0.2-kg precision that was regularly checked. Measures were taken with subjects in the standing position wearing light clothing and preferably barefoot. When a subject did not agree to be barefoot, there were subtracted from the weight measured 500 g of footwear for males and 250 g for females. All data were collected by a skilled nutritionist with experience in anthropometric measures. Height was self-referred by adolescentes6,7 because the pilot
study showed that adolescents had diffi culty referring their weight but not their height.
There were collected independent and control variables using self-administered complementary questionnaires: gender, age, self-referred skin color, living situation (with whom they lived).
The questionnaires were pre-standardized and pre-tested in 25 students (and one of their parents – mother or father – or guardian) attending 10th grade of a secondary public
school. After due adjustments, a pilot study comprising 130 students of two public state schools in the city of Florianópolis was carried out to test the study procedures and standardize anthropometric measures. Instead of self-referred weight it was opted for measuring it since most adolescents did not know their weight.
Subjects fi lled out the study questionnaires in the class-room. At that time questionnaires were also handed to their parents and they were asked to return them on the next day.
The questionnaires were then coded and reviewed and data was entered using Epi Data program. Data analysis was performed using SPSS for Windows version 10.0.
Those adolescents who completed less than 50% of the HRQL instrument were excluded from the analysis.
It was set a cutoff of one standard deviation below the mean score of non-excess body weight subjects and low HRQL was then dichotomized.11 Descriptive statistics
were used to summarize all variables studied and the associations between outcome and exploratory vari-ables were tested using the chi-square test and ANOVA. Additionally, paired comparison of normal weight, overweight, and obesity groups was performed using the Mann-Whitney U test. Those variables with p-value ≤0.20 were selected and included in the multiple model. Nonconditional logistic regression analysis was carried
out stratifi ed by gender. The variables were included in the model in an ascending order by their statistical signifi cance in the chi-square test. Odds ratio (OR) was the measure of effect used to estimate the likelihood of adolescents with excess body weight to have different HRQL than those with non-excess body weight. Crude and adjusted ORs were estimated and variables with p<0.05 after adjustment were considered signifi cantly associated. Simple linear correlation analysis was car-ried out between total PedsQL scores reported by adolescents and BMI values for the entire sample and stratifi ed by gender.
The study was approved by the Research Ethics Com-mittee of Universidade Federal de Santa Catarina and complied with ethical principles.
RESULTS
A total of 467 adolescents (99.4% of the sample) partici-pated in the study. Two adolescents were excluded due to physical disabilities that prevented anthropometric measurements and one was excluded from the analysis because he did not complete at least 50% of PedsQL. All their parents received the questionnaire and 251 completed it (46.3% response rate).
Mean total HRQL score reported by adolescents whose parents answered the questionnaire was 74.78 (standard deviation [SD]: 12.00) while mean score among those whose parents did not complete the questionnaire was 76.66 (SD: 11.66), a difference that was not statistically signifi cant (p>0.05). There were 34 (13.6%) adolescents
Table 1. Description of PedsQL 4.0 instrument items in each domain.
Physical domain Emotional domain
1 item for each one of the following subjects
Diffi culty to walk more than a block Feeling fear
Diffi culty to run Feeling sad or depressed
Diffi culty to engage in sports activities Feeling angry
Diffi culty to lift weight Diffi culty to sleep
Diffi culty to bath by himself/herself Self-concern
Diffi culty to help with household tasks Pain
Lack of energy
Social domain School domain
1 item for each one of the following topics
Problem or diffi culty to interact with peers Attention diffi culty Problem or diffi culty to make friends Memory diffi culties
Problems with peer teasing Diffi culty to follow classroom activities Diffi culty to do the same things other adolescents do 2 items on reasons for missing school Diffi culty to follow same-age adolescents
with excess body weight among those whose parents completed the questionnaire and 40 (18.5%) among those whose parents did not complete it, a difference that was also not signifi cant (p= 0.18).
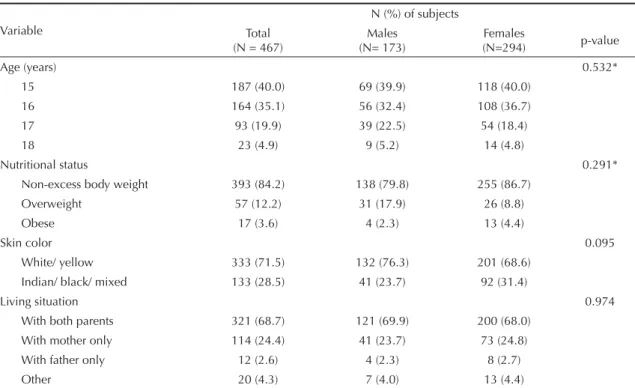
Demographic and nutritional characteristics of ado-lescents are presented in Table 2. Mean age was 15.9 years (SD: 0.89) and females were 63.0% of the sample studied. The prevalence of overweight and obesity was 12.2% and 3.6%, respectively. Male adolescents had higher prevalence of overweight than females (17.9%
and 8.8%, respectively) while obesity was higher among females (4.4% versus 2.3%), but these differ-ences were not statistically signifi cant. There were no signifi cant differences between males and females by age, skin color, and living condition.
As for parental schooling, 2.8% of family heads were illiterate, 10.0% had at least four years of schooling, 28.3% at least eight years, and 56.6% nine years or more. Mean per capita income was R$ 424.15.
Table 2. Frequencies of demographic and nutritional variables according to sex among high school adolescents. Florianópolis,
Southern Brazil, 2007.
Variable
N (%) of subjects Total
(N = 467)
Males (N= 173)
Females
(N=294) p-value
Age (years) 0.532*
15 187 (40.0) 69 (39.9) 118 (40.0)
16 164 (35.1) 56 (32.4) 108 (36.7)
17 93 (19.9) 39 (22.5) 54 (18.4)
18 23 (4.9) 9 (5.2) 14 (4.8)
Nutritional status 0.291*
Non-excess body weight 393 (84.2) 138 (79.8) 255 (86.7)
Overweight 57 (12.2) 31 (17.9) 26 (8.8)
Obese 17 (3.6) 4 (2.3) 13 (4.4)
Skin color 0.095
White/ yellow 333 (71.5) 132 (76.3) 201 (68.6)
Indian/ black/ mixed 133 (28.5) 41 (23.7) 92 (31.4)
Living situation 0.974
With both parents 321 (68.7) 121 (69.9) 200 (68.0)
With mother only 114 (24.4) 41 (23.7) 73 (24.8)
With father only 12 (2.6) 4 (2.3) 8 (2.7)
Other 20 (4.3) 7 (4.0) 13 (4.4)
* p-value of linear trend
Figure. Correlation between health-related quality of life and body mass index by sex among high school adolescents.
Floria-nópolis, Southern Brazil, 2007.
Females
40,00 60,00 80,00 100,00
r=-0,256 p<0,01
BMI
20,00 30,00 40,00
HRQL Males
40,00 60,00 80,00 100,00
r=-0,067 p=0,378
BMI
20,00 30,00 40,00
HRQL HRQL
BMI
20,00 30,00 40,00 40,00
60,00 80,00 100,00
Entire sample
r=-0.178 p<0.01
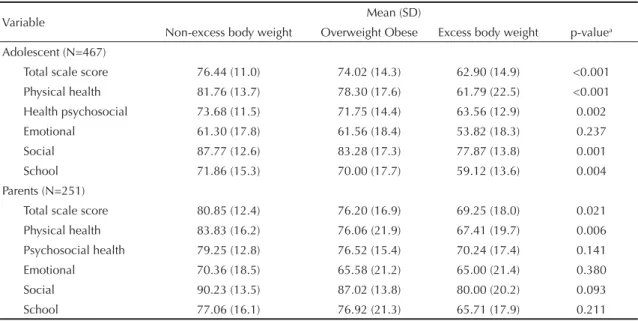
Table 3 shows a signifi cant difference between excess and non-excess weight groups in all HRQL domains except the emotional one. As for parents’ perception, total and physical score signifi cantly varied between the groups studied. The paired comparison analysis using the Mann-Whitney U test showed that the difference between non-excess body weight and overweight group was not signifi cant. However, the comparison between non-excess body weight and obesity group revealed a signifi cant difference in all domains (p<0.05 for the emotional domain and p<0.01 for all others). The comparison between overweight and obesity groups showed a signifi cant difference in the total and physi-cal health domains (p<0.01), psychosocial and school (p<0.05) but not signifi cant in all others. According to the parents’ perception, there was no signifi cant differ-ence in the paired comparison of all domains.
Mean total PedsQL scores of adolescents and their parents/guardians for the entire sample, non-excess, and excess body weight subjects were compared by gender, age, skin color, and living situation (Table 4). Female adolescents had signifi cantly lower HRQL than males. And among parents, child’s mixed and black skin color was associated to low quality of life.
After dichotomizing HRQL scores (cutoff value: 65.43) into low and adequate, it was found 13.0% of low HRQL in the non-excess body weight and 29.3% in the excess body weight group.Table 5 presents ORs stratifi ed by gender and adjusted for age, skin color, and living situation. Female adolescents with excess body weight were signifi cantly more likely to report low HRQL than those with non-excess body weight in all domains, except the emotional one. As for the
parents’ perception, a signifi cant difference was seen in the total physical and social score. With respect to male adolescents, this difference remained signifi cant only for the total scale score in the self-report and for the physical domain in their parents’ perception.
BMI values had a negative correlation with total Ped-sQL scores reported by adolescents (Figure). Higher correlation was seen among female adolescents (r = –0.256 in females and r = –0,067 in males). Only the correlation coeffi cient between BMI and HRQL in the entire sample and among female adolescents was statistically signifi cant (p<0.01).
DISCUSSION
The present study fi ndings indicate a signifi cant asso-ciation between excess body weight and low HRQL in school adolescents under 18 in the city of Florianópolis. HRQL scores measured using PedsQL were higher in non-excess body weight, followed by overweight and obese adolescents. It suggests a positive association between severity of excess body weight and low qual-ity of life. Adolescents with excess body weight had lower HRQL not only in the total scale score but also in the physical, psychosocial, social, and school domains compared to their peers with non-excess body weight, which suggests this condition has a global impact on the adolescent’s daily life. Apart from the emotional domain, the study fi ndings are consistent with those of recent American studies using the same instrument. They reported obese children and adolescents under treatment had lower HRQL in all domains (physical, emotional, social, and school) compared to their peers with normal weight.11,21 Similar scores were described
Table 3. Means and standard deviations of total and PedsQL subscale scores reported by adolescents and their parents by
nutritional status of high school adolescents. Florianópolis, Southern Brazil, 2007.
Variable Mean (SD)
Non-excess body weight Overweight Obese Excess body weight p-valuea
Adolescent (N=467)
Total scale score 76.44 (11.0) 74.02 (14.3) 62.90 (14.9) <0.001
Physical health 81.76 (13.7) 78.30 (17.6) 61.79 (22.5) <0.001
Health psychosocial 73.68 (11.5) 71.75 (14.4) 63.56 (12.9) 0.002
Emotional 61.30 (17.8) 61.56 (18.4) 53.82 (18.3) 0.237
Social 87.77 (12.6) 83.28 (17.3) 77.87 (13.8) 0.001
School 71.86 (15.3) 70.00 (17.7) 59.12 (13.6) 0.004
Parents (N=251)
Total scale score 80.85 (12.4) 76.20 (16.9) 69.25 (18.0) 0.021
Physical health 83.83 (16.2) 76.06 (21.9) 67.41 (19.7) 0.006
Psychosocial health 79.25 (12.8) 76.52 (15.4) 70.24 (17.4) 0.141
Emotional 70.36 (18.5) 65.58 (21.2) 65.00 (21.4) 0.380
Social 90.23 (13.5) 87.02 (13.8) 80.00 (20.2) 0.093
School 77.06 (16.1) 76.92 (21.3) 65.71 (17.9) 0.211
in a study with children and adolescents diagnosed with cancer.11 The non-signifi cant difference in the emotional
domain may be associated to the fact that adolescence is a stage of major changes, confl icts, and lack of self-confi dence, which makes adolescents more vulnerable to social and cultural contradictions involving body image-related emotional issues.
The adolescents’ parents studied reported a slightly higher HRQL compared to that self-perceived by excess and non-excess body weight subjects. Total and physi-cal domain scores obtained from parents were also sig-nifi cantly lower among those with excess body weight. This fi nding contrasts with that found in clinical studies of obese adolescents reporting parental perception of
Table 4. Means and standard deviations of total and PedsQL subscale scores reported by adolescents and their parents
according to socioeconomic and demographic variables by nutritional status of high school adolescents. Florianópolis, Southern Brazil, 2007.
Variable Mean (SD)
Total Non-excess body weight Excess body weight Total scale score – adolescents (N= 467)
Gender
Male 79.47 (10.62)** 80.29 (9.57)** 76.22 (3.71)**
Female 73.40 (12.01) 74.35 (11.19) 67.20 (5.13)
Age (years)
15 76.16 (11.35) a 76.78 (10.80) a 72.34 (3.94) a
16 74.73 (12.26) 76.23 (10.74) 65.49 (6.63)
17 76.11 (11.88) 75.96 (11.78) 76.68 (2.58)
18 76.24 (13.42) 77.01 (12.55) 74.04 (6.74)
Skin color
White/ Yellow 75.86 (11.65)a 76.29 (11.32)a 73.50 (3.17)a
Indian/ Black/ Mixed 75.17 (12.47) 76.89 (10.23) 66.96 (18.14)
Living situation
With both parents 76.09 (11.47)a 76.64 (10.78)a 72.71 (14.75)a
With mother only 75.06 (12.17) 76.28 (11.01) 69.67 (15.55)
With father only 73.80 (11.79) 77.64 (8.49) 68.42 (14.57)
Other 73.07 (16.20) 73.53 (15.44) 70.47 (23.96)
Total scale score – parents (N= 251) Gender
Male 85.51 (10.78)** 86.38 (9.57)** 81.50 (15.03)**
Female 77.77 (13.56) 78.73 (12.77) 70.32 (17.24)
Age (years)
15 82.13 (12.90)a 83.00 (11.59)a 71.17 (18.40)a
16 78.80 (12.90) 79.67 (12.28) 71.50 (17.29)
17 78.48 (13.58) 79.81 (12.85) 70.91 (16.19)
18 75.89 (16.68) 74.35 (16.71) 91.30 ( - )
Skin color
White/ Yellow 81.47 (12.68)** 81.82 (12.39)a 79.20 (14.52)*
Indian/ Black/ Mixed 76.40 (14.18) 78.47 (12.34) 62.79 (18.47)
Living situation
With both parents 80.77 (12.60)a 81.45 (12.17)a 74.71 (15.58)a
With mother only 78.70 (15.04) 79.98 (13.64) 73.40 (19.50)
With father only 79.35 (3.87) 80.43 (3.92) 76.09 ( - )
Other 79.18 (10.43) 77.60 (9.7) 93.48 ( - )
* p<0.05 ** p<0.01
their children’s HRQL to be lower than that reported by the adolescents.11,21 These American studies found
signifi cantly lower scores in all domains for obese adolescents according to their parents’ perception.11,21
However, the results of the present study are consistent with those of another study with schoolchildren where parents reported higher HRQL scores.18 The differences
found between clinical and school samples suggest that parents have greater concern, care, and interest regard-ing their children’s daily life routine and behaviors as they start a clinical treatment.
In the present study, mean total scale score of obese subjects was similar to that reported by Zeller & Modi21
and Schwimmer et al11 in United States studies with
clinical samples. Williams et al18 reported contrasting
results in a population-based study with elementary schoolchildren in Victoria, Australia. Compared to stud-ies with clinical samples, they found smaller differences between overweight and obese children and those with normal weight. An adequate comparison is not possible as there are no Brazilian studies with clinical samples. But the predominance of female adolescents in the sample studied that showed signifi cantly lower HRQL than males may explain lower total scores found.
When mean total HRQL scores self-reported by adoles-cents and perceived by their parents were stratifi ed by gender, a signifi cant difference was seen. Quality of life of female adolescents compared to that of males was lower among both excess weight and non-excess weight groups. These results are expected since many studies have shown that female adolescents have greater con-cern with their body image.4,10 Branco et al,1 in a study
conducted in São Paulo investigating body perception and satisfaction among adolescents and their association with nutritional status, reported body image dissatisfac-tion was more prevalent among overweight and obese adolescents, especially among females, as well as greater dissatisfaction among eutrophic adolescents.
Parents’ perception also revealed a signifi cant differ-ence in mean total scale score by skin color. Parents per-ceived non-white children as having lower HRQL than white ones. This fi nding may indicate greater sensitivity to discrimination by the parents that is projected onto their children. However, it cannot be properly inferred as it is out of the scope of the present study.
HRQL is intended to assess overall physical and psychosocial functioning.13,15 Although not designed
to explore all domains that may be particularly associ-ated to obesity, this instrument can provide an overall picture of how obese people perceive their health and well-being. HRQL assesses major aspects of health that are not covered by conventional physiological and clinical dimensions.
The present study has some limitations. There may have been errors regarding self-referred height, most likely overestimating it and therefore underestimating over-weight and obesity. In addition, it was not checked when height was last measured and how it was measured. But studies have shown that self-referred weight and height in adolescents are valid measures.6,7 In addition,
morbid conditions and socioeconomic conditions were not controlled for as this information was not properly provided by parents/guardians. The classroom was
Table 5.Odds ratio and 95% confi dence interval of low health-related quality of life among excess and non-excess body weight
male and female high school adolescents. Florianópolis, Southern Brazil, 2007
Variable Adjusted OR
a (95% CI)
Male Female
Adolescent (N=467)
Total scale score 2,94 (1,12-7,73) 4,59 (2,16-9,74)
Physical health 1.87 (0.73;4.79) 3.08 (1.42;6.68)
Psychosocial health 1.52 (0.64;3.63) 3.14 (1.49;6.59)
Emotional 1.33 (0.54;3.26) 2.32 (0.98;5.52)
Social 1.59 (0.65;3.91) 3.33 (1.45;7.62)
School 1.45 (0.61;3.47) 2.32 (1.08;4.98)
Parents (N=251)
Total scale score 4.83 (0.88;26.5) 2.59 (1,23;5,44)
Physical health 5.73 (1.2;27.43) 2.78 (1.31;5.93)
Psychosocial health 2.23 (0.42;11.8) 2.04 (0.99;4.23)
Emotional 1.41 (0.29;6.89) 2.01 (0.99;4.11)
Social 1.84 (0.36;9.40) 2.28 (1.09;4.77)
School 0.67 (0.10;4.38) 1.89 (0.92;3.88)
a Brazilian Ministry of Health. Banco de Dados do Sistema Único de Saúde (DATASUS) [internet]. [cited 2007 Aug 12]. Available from: http:// tabnet.datasus.gov.br/cgi/deftohtm.exe?ibge/cnv/estsc.def.
b Brazilian Institute of Geography and Statistics. 2000 Population Census. Rio de Janeiro; 2001. not the most adequate environment for the instrument
administration as it was noisy and may have disturbed adolescents’ concentration. Also, being close to their peers may have made adolescents embarrassed.
A comparison between schooling of Florianópolis population in 1996a and that of family heads of the
adolescents studied showed similarities. IBGE datab
showed that, in 1996, 39.6% of adults aged 20 to 59 years had at least eight years of schooling compared to 38.3% in the present study. Mean per capita income was R$ 424.15, which is lower than R$ 701.40 seen in Florianópolis in 2000.b It suggests that the study
popula-tion had lower socioeconomic condipopula-tion that the aver-age population living in Florianópolis, thus preventing further extrapolation of results citywide.
Despite these limitations, the study generated relevant fi ndings and corroborated other international studies: excess body weight signifi cantly affects the quality of life of adolescents, especially girls. The instrument administered proved to be easy to use and provided con-sistent results. The study fi ndings stress the importance of assessing HRQL before, during, and after obesity management. This measure can be used as a parameter to assess effectiveness of obesity management. It can
also help understand the consequences of obesity in adolescents and support public policies targeting this specifi c population as well. The instrument adminis-tered to parents is a useful tool to evaluate and promote family involvement.
Ravens-Sieberer et al12 claim that interventions
target-ing obese children and their families would require bet-ter understanding of life aspects that are most affected by obesity. HRQL assessment can help health provid-ers better undprovid-erstand these aspects. These authors12
conclude that HRQL evaluation of obese children is a major tool for assessing treatment success.
It is recommended to further investigate HRQL in population-based and clinical samples of adolescents and in other age groups and to assess depression in this population as well.
ACKNOWLEDGEMENTS
Branco LM, Hilário MOE, Cintra IP. Percepção e 1.
satisfação corporal em adolescentes e a relação com seu estado nutricional. Rev Psiquiatr Clin. 2006;33(6):292-96. DOI: 10.1590/S0101-60832006000600001
Carneiro JRI, Kushnir MC, Clemente ELS, Brandão 2.
MG, Gomes MB. Obesidade na adolescência: fator de risco para complicações clínico-metabólicas. Arq Bras Endocrinol Metab. 2000;44(5):390-96. DOI:10.1590/S0004-27302000000500005
Cole TJ, Bellizzi MC, Flegal KM, Dietz WH. 3.
Establishing a standard defi nition for child overweight and obesity worldwide: international survey. BMJ. 2000;320(7244):1240-3. DOI: 10.1136/ bmj.320.7244.1240
Conti MA, Frutuoso MFP, Gambardella AMD. 4.
Excesso de peso e insatisfação corporal em adolescentes. Rev Nutr. 2005;18(4):491-7. DOI: 10.1590/S1415-52732005000400005
Farias JFJ, Lopes AS. Prevalência de sobrepeso em 5.
adolescentes. Rev Bras Ci e Mov. 2003;11(3):77-84. Farias Jr JC.
6. Validade das medidas auto-referidas de peso e estatura para o diagnóstico do estado nutricional de adolescentes. Rev Bras Saude Mater Infant. 2007;7(2):167-74. DOI: 10.1590/S1519-38292007000200007
Goodman E, Hinden BR, Khandelwal S. Accuracy 7.
of teen and parental reports of obesity and body mass index. Pediatrics. 2000;106(1 Pt 1):52-8. DOI: 10.1542/peds.106.1.52
Muller RCL. Obesidade na adolescência.
8. Pediatr
Mod. 2001;37(n esp):45-8.
Pinhas-Hamiel O, Singer S, Pilpel N, Fradkin A, 9.
Modan D, Reichman B. Health-related quality of life among children and adolescents: associations with obesity. Int J Obes (Lond). 2006;30(2):267-72. DOI: 10.1038/sj.ijo.0803107
Rand CS, Resnick JL. The “good enough” body size 10.
as judged by people of varying age and weight. Obes Res. 2000;8(4):309-16. DOI: 10.1038/ oby.2000.37
Schwimmer JB, Burwinkle TM, Varni JW. Health-11.
related quality of life of severely obese children and adolescents. JAMA. 2003;289(14):1813-9. DOI: 10.1001/jama.289.14.1813
Ravens-Sieberer U, Redegeld M, Bullinger M. Quality 12.
of life after in-patient rehabilitation in children with obesity. International J Obes Relat Metab Disord. 2001;25(Supl 1):S63-5. DOI: 10.1038/sj.ijo.0801702 Testa MT, Simonson DC. Assessment of quality of life 13.
outcomes. N Engl J Med. 1996;334(13):835-40. DOI: 10.1056/NEJM199603283341306
Vanhala M, Vanhala P, Kumpusalo E, Halonen P, 14.
Takala J. Relation between obesity from childhood to adulthood and metabolic syndrome: population based study. BMJ. 1998;317(7154):319.
Varni JW, Seid M, Rode CA. The PedsQl
15. TM:
Measurement model for the pediatric quality of life inventory. Med Care. 1999;37(2):126-39. DOI: 10.1097/00005650-199902000-00003
Varni JW, Seid M, Kurtin PS. The PedsQl
16. TM 4.0:
Reliability and validity of the pediatric quality of life inventory version 4.0: generic core scales in healthy and patient populations. Med Care. 2001;39(8):800-12. DOI: 10.1097/00005650-200108000-00006 Veiga GV, Cunha AS, Sichieri R. Trends in 17.
overweight among adolescents living in the poorest and richest regions of Brazil. Am J Public Health. 2004;94(9):1544-8. DOI: 10.2105/AJPH.94.9.1544 Williams J, Wake M, Hesketh K, Maher E, Waters E. 18.
Health-related quality of life of overweight and obese children. JAMA. 2005;293(1):70-6. DOI: 10.1001/ jama.293.1.70
World Health Organization. Obesity: preventing and 19.
managing the global epidemic. Geneve; 1998. Zametkin AJ, Zoon CK, Klein HW, Munson S. 20.
Psychiatric aspects of child and adolescent obesity: A review of the past 10 years. J Am Acad Child Adolesc Psychiatr. 2004;43(2):134-50. DOI: 10.1097/00004583-200402000-00008
Zeller MH, Modi AC. Predictors of health-related 21.
quality of life in obese youth. Obesity (Silver Spring). 2006;14(1):122-30. DOI: 10.1038/oby.2006.15
REFERENCES
Article based on N Kunkel’s master’s dissertation submitted at the Postgraduate Program in Public Health, Universidade Federal de Santa Catarina, in 2007.