Flávio SarnoI
Rafael Moreira ClaroI Renata Bertazzi LevyII
Daniel Henrique BandoniI,III
Sandra Roberta Gouvêa FerreiraIII
Carlos Augusto MonteiroII,III
I Programa de Pós-Graduação de Nutrição em Saúde Pública. Faculdade de Saúde Pública (FSP). Universidade de São Paulo (USP). São Paulo, SP, Brasil
II Núcleo de Pesquisas Epidemiológicas em Nutrição e Saúde. FSP-USP. São Paulo, SP, Brasil
III Departamento de Nutrição. FSP-USP. São Paulo, SP, Brasil
Correspondence: Carlos Augusto Monteiro
Av. Dr. Arnaldo, 715– Cerqueira César 01246-904 São Paulo, SP, Brasil E-mail: [email protected] Received: 5/13/2008 Revised: 7/30/2008 Approved: 9/5/2008
Estimated sodium intake by the
Brazilian population, 2002-2003
ABSTRACT
OBJECTIVE: To estimate the magnitude and distribution of sodium intake in
Brazil and to identify major dietary sources contributing to this intake.
METHODS: Estimates were based on data from a Brazilian household budget
survey carried out between July 2002 and June 2003. A total of 969,989 food purchase records from a probabilistic sample of 48,470 households located in 3,984 census tracts across the country were analyzed. Purchase records were converted into nutrients using food composition charts. Mean sodium availability per person per day and mean adjusted availability considering a 2,000 kcal daily energy intake were calculated, as well as the contribution of selected food groups to total household sodium availability. Estimates were presented according to geographical region, urban or rural status of the household, and income stratum.
RESULTS: Mean daily sodium availability in Brazilian households was 4.5
g per person (or 4.7 g considering a daily calorie intake of 2,000 kcal), thus exceeding by more than two times the recommended levels of intake for this nutrient. Although most of the sodium available for intake across all income strata was derived from kitchen salt or salt-based condiments (76.2%), the fraction derived from processed foods with added salt showed a strong linear increase as household purchasing power increased, representing 9.7% of total sodium intake in the lower quintile of the per capita income distribution and 25.0% in the upper quintile.
CONCLUSIONS: Results indicate that sodium intake in Brazil widely exceeds
the maximum recommended intake level for this nutrient in all of the country’s macro regions and across all income strata.
DESCRIPTORS: Sodium, Dietary. Food Consumption. Socioeconomic
Factors. Brazil.
INTRODUCTION
There is extensive evidence linking excess sodium intake with the develop-ment of chronic diseases.16 It is estimated that, between age 25 and 55 years,
reducing daily sodium intake by only 1.3 g would lead to a 5 mmHg decrease in systolic arterial pressure, signifying a 20% decrease in prevalence of arterial hypertension. Such reduction would also lead to substantial decrease in mortality related to cerebrovascular event (14%) and coronary disease (9%), representing 150 thousand lives saved worldwide.5 Excess salt intake is also associated with
gastric cancer,19 and may contribute to the development of osteoporosis.7
(WHO),21 most of this sodium originating from
pro-cessed foods.1,3,9 In developing countries, information
on sodium intake are still scarce given the complexity of evaluating individual consumption.
Indirect estimates, calculated based on the amount of salt per inhabitant commercialized by Brazilian industries in the sector, indicate that sodium intake in Brazil exceeds the recommended limit.a,b Studies
car-ried out in three Brazilian cities also arrived at similar conclusions based on family food purchase profi les4
or on direct estimates obtained through evaluation of urinary sodium excretion.11,12
The aim of the present study was to estimate sodium intake among the Brazilian population, and to identify the major dietary sources contributing to this intake.
METHODS
The data analyzed are derived from the Pesquisa de
Or-çamentos Familiares (Household Budget Survey, HBS)
carried out between July 2002 and June 2003 by the
Instituto Brasileiro de Geografi a e Estatística – IBGE
(Brazilian Federal Bureau of Geography and Statistics). Briefl y, the HBS is a survey aimed at obtaining informa-tion on the income and expenses of Brazilian families. The 2002/03 edition surveyed a probabilistic sample representative of all Brazilian households as well as of each of the country’s fi ve macroregions according to the urban/rural status of the household. Sampling was based on a complex strategy involving the prior defi nition of 443 sociogeographic strata that integrated census tracts within a same territorial domain (region, state, and urban/ rural status) that were homogeneous in terms of head-of-household schooling (information obtained from the 2000 Demographic Census). Subsequently, census tracts were randomly selected from within each stratum, and households were randomly selected from within each tract. Finally, in order to make data collection uniform among the year’s four trimesters, the interviews carried out within each stratum were spread out across the 12 months of the survey. A detailed description of the HBS sampling strategy is available elsewhere.c
We analyzed the records of all food and drink pur-chases made during a period of seven consecutive days by the households sampled in the 2002-03 HBS (969,989 records contributed by 48,470 households
a Ministério da Saúde. Secretaria de Atenção à Saúde. Coordenação-Geral da Política de Alimentação e Nutrição. Guia alimentar para a população brasileira: promovendo a alimentação saudável. Brasília; 2005.
b Serviço Nacional de Aprendizagem Industrial. Plano de apoio ao desenvolvimento da cadeia produtiva do sal [internet] [cited 2008 Apr 18]. Available from: http://www.fi ern.org.br/servicos/estudos/mossoro/cadeia_produtiva_sal.htm
c Instituto Brasileiro de Geografi a e Estatística. Coordenação de Índices de Preços. Pesquisa de orçamentos familiares 2002-2003: análise da disponibilidade domiciliar e estado nutricional no Brasil. IBGE: Rio de Janeiro;2004.
d Instituto Brasileiro de Geografi a e Estatística. Estudo Nacional da Despesa Familiar – ENDEF 1974/75. Rio de Janeiro; 1978.
e Universidade Estadual de Campinas. Núcleo de Estudos e Pesquisas em Alimentação. Tabela brasileira de composição de alimentos – TACO: versão 1. Campinas; 2004.
f Ministério da Saúde. Secretaria de Atenção à Saúde. Coordenação-Geral da Política de Alimentação e Nutrição. Guia alimentar para a população brasileira: promovendo a alimentação saudável. Brasília; 2005.
located in 3,984 census tracts). Given that a seven-day reference period is insuffi cient for characterizing the food-purchase pattern of each household, we adopted as the survey unit, rather than individual households, each of the groups of households corresponding to the 443 HBS strata. These strata comprise household units that are homogeneous in terms of territorial domain and family socioeconomic status, and which were surveyed uniformly throughout the four trimesters of the year. The mean number of households surveyed in each HBS stratum was 109.6, ranging from 9 to 804. The sampling weight of each survey unit (household stra-tum) corresponds to the sum of the sampling weights of households included in the stratum.
Initially, we excluded, when necessary, any non-edible fraction from the crude quantity in grams of each food item purchased by the household using the correction factors recommended by IBGE.d The edible portion
of each food item was then converted into energy (kcal) and sodium (grams) using the Brazilian Food Composition Table [Tabela Brasileira de Composição
dos Alimentos], version 1e or, in its absence, the United
States offi cial food composition table, version 15. In the specifi c case of foods preserved in salt, such as salted/ dried beef (charque, carne seca, and carne de sol) and salted fi sh, we considered the equivalent portion of the food after hydration and the sodium concentration referring to the desalted product.
After the conversion of weekly food purchase records into nutrients, we calculated, for each survey unit (household stratum), the daily per capita availability of energy and sodium. In addition, in order to correct for the difference between household sodium availability and actual intake – given that both meals outside home and the fraction of the food purchase that is not eaten – we calculated the adjusted sodium availability considering a total energy consumption of 2,000 kcal, which cor-responds to the Brazilian recommendation for daily per
capita energy intake.f Mean sodium availability (with
respective standard errors) is presented for the country as a whole, for each of the fi ve geographic macroregions, separated into urban and rural, and for fi fths of the per
capita income distribution observed in the 443 strata.
a Núcleo de Pesquisas Epidemiológicas em Nutrição e Saúde. Conversor de aquisições de alimento em energia e nutrientes (AQUINUT): versão 1.0 [internet] [cited 2007 Oct 12]. Available from: ttp://www.fsp.usp.br/nupens
To achieve this, we classifi ed food purchases into four groups: 1) salt and salt-based condiments; 2) processed foods with added salt; 3) in natura foods, or processed foods without added salt; and 4) ready-made meals. Linear regression analysis was used to test the relation-ship between family income (fi fths of the distribution) and the contribution of each of these groups to total sodium intake.
In order to convert crude amounts (g or ml) of pur-chased foods into nutrients (kcal and sodium), we used the AQUINUTa application. For all other procedures
and for statistical analysis, we used Stata software v. 9.2, taking into account the sampling weight of each survey unit.
RESULTS
Table 1 presents estimated household sodium avail-ability for Brazil and for each macroregion. For the
country as a whole, the amount of sodium available for consumption was 4.5 g per person per day, (g/p/d), more than twice the 2 g/p/d maximum recommended intake level. Sodium availability was not lower than 4 g/p/d in any of the fi ve macroregions. In all fi ve macroregions, sodium availability was higher in rural areas. Sodium availability was lowest in the urban Center-West, even though exceeding maximum recommended intake by 70%. Adjustment of daily sodium intake based on a 2,000 kcal diet did not alter substantially the intake sce-nario in any of the country’s fi ve regions, although it did attenuate the additional excess found in rural areas.
Table 2 presents estimated household availability ac-cording to fi fths of the per capita income distribution of household strata. Household sodium availability adjusted for a 2,000 kcal/p/d diet was two-and-a-half times higher than the maximum recommended intake in the two lower quintiles of the income distribution, and slightly over two times higher in the three upper quintiles.
Table 1. Household energy and sodium availability based on food purchases according to macroregion and urban/rural status of the household. Brazil, 2002-03.
Macroregion/household status
Energy (kcal/p/day) Sodium (g/p/day) Sodium (g/p/2,000 kcal) Mean (Standard-error) Mean (Standard-error) Mean (Standard-error) North
Urban 1848.6 (75.0) 4.3 (0.4) 4.7 (0.4) Rural 2951.6 (142.2) 11.4 (3.9) 7.4 (2.2) Total 2111.9 (107.5) 6.0 (1.1) 5.4 (0.6) Northeast
Urban 1720.6 (27.2) 3.9 (0.1) 4.5 (0.1) Rural 2092.3 (52.3) 6.5 (0.4) 6.2 (0.4) Total 1818.4 (30.9) 4.6 (0.2) 5.0 (0.2) Southeast
Urban 1760.8 (61.8) 3.8 (0.2) 4.3 (0.1) Rural 2623.4 (316.2) 7.0 (1.0) 5.8 (1.3) Total 1830.0 (64.3) 4.0 (0.2) 4.4 (0.2) South
Urban 1858.5 (67.1) 4.4 (0.2) 4.8 (0.2) Rural 3008.7 (244.5) 8.0 (0.9) 5.4 (0.4) Total 2045.8 (94.5) 5.0 (0.3) 4.9 (0.1) Center-West
Urban 1654.3 (47.0) 3.4 (0.2) 4.1 (0.3) Rural 2588.3 (136.5) 8.7 (2.1) 6.4 (1.3) Total 1763.7 (61.6) 4.0 (0.4) 4.3 (0.3) Brazil
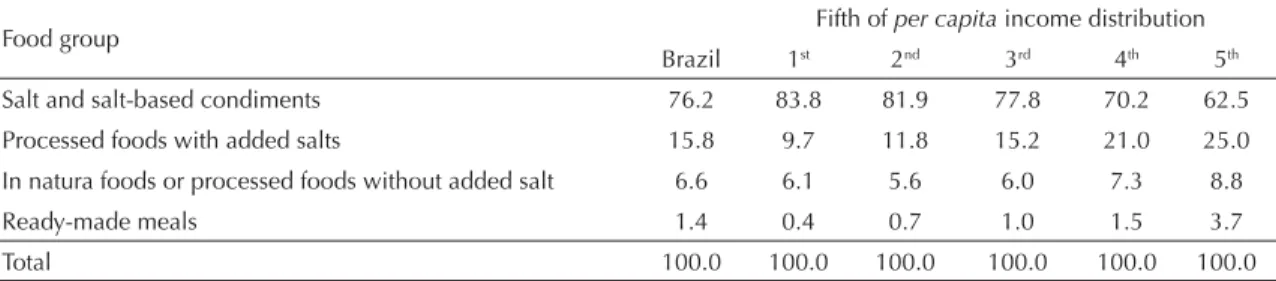
Table 3 describes the contribution of different groups of foods to total household sodium availability. Consider-ing the entirety of households, roughly three-quarters of available sodium originates from purchases of kitchen salt (71.5%) or salt-based condiments (4.7%). The re-maining sodium available for consumption originated from purchases of processed foods with added salt (15.8%), in natura foods, or processed foods without added salt (6.6%), and ready-made meals (1.4%). Though still predominant in all income groups, the contribution of kitchen salt decreased linearly with increased income (p < 0.001), ranging from 83.8% in the lowest income fi fth to 62.5% in the highest. On the other hand, the contribution of processed foods with added salt showed a direct relationship with per
capita income (p < 0.001), increasing 2.5-fold between
the lowest (9.7% of total sodium) and highest (25.0% of total sodium) fi fth. The contribution of ready-made meals to total household sodium availability, although small, also increased markedly with income (p < 0.001), representing 0.4% of total sodium in the lowest fi fth and 3.7% in the highest. The contribution of in natura foods and processed foods without added salt to total sodium was relatively low. This contribution remained stable at around 6% for the fi rst three income fi fths, increasing to 7.3% and 8.8% in the two upper fi fths.
DISCUSSION
Our results indicate that the amount of sodium available for consumption in Brazilian households is more than two-fold higher than maximum recommended ingestion
Table 2. Household energy and sodium availability based on food purchases according to increasing fi fths of per capita family income. Brazil, 2002-03.
Per capita income fi fth Energy (kcal/p/day) Sodium (g/p/day) Sodium (g/p/2,000 kcal) Mean (Standard-error) Mean (Standard-error) Mean (Standard-error)
1st 1950.6 (59.3) 4.9 (0.3) 5.0 (0.2)
2nd 1976.7 (87.7) 5.1 (0.4) 5.0 (0.2)
3rd 1922.9 (93.2) 4.6 (0.4) 4.7 (0.3)
4th 1735.0 (92.2) 3.8 (0.2) 4.4 (0.1)
5th 1787.7 (46.1) 3.8 (0.2) 4.3 (0.2)
Brazil 1875.1 (34.7) 4.5 (0.1) 4.7 (0.1)
Table 3. Distribution (%) of household sodium availability based on food purchases according to increasing fi fths of the per capita income distribution and to food group. Brazil, 2002-03.
Food group Fifth of per capita income distribution Brazil 1st 2nd 3rd 4th 5th Salt and salt-based condiments 76.2 83.8 81.9 77.8 70.2 62.5 Processed foods with added salts 15.8 9.7 11.8 15.2 21.0 25.0 In natura foods or processed foods without added salt 6.6 6.1 5.6 6.0 7.3 8.8
Ready-made meals 1.4 0.4 0.7 1.0 1.5 3.7
Total 100.0 100.0 100.0 100.0 100.0 100.0 levels.21 Excessive availability was detected in all fi ve
Brazilian macroregions, in both rural and urban settings, and across all income strata. Although most of the avail-able sodium in all income strata originates from kitchen salt and salt-based condiments, the portion derived from processed foods increases in importance as household purchasing power increases, representing 9.7% of all sodium in the lowest, and 25.0% in the highest fi fth of
the per capita income distribution.
We must emphasize the fact that HBS data refer to the household availability of sodium, rather than to actual consumption levels, given that food eaten away from home is not included and the fraction of food purchased but not consumed is not excluded. As an attempt to counter these limitations, we present estimates for so-dium availability adjusted to a fi xed calorie availability of 2,000 kcal/p/d. The effi cacy of such an adjustment is based on two underlying assumptions: 1) that the sodium content of home and away from home meals is similar; and 2) that the wasted fraction of different foods does not depend on sodium content.
Although we are unaware of Brazilian studies compar-ing the sodium content of home and away from home meals, the salt content of outside meals is generally as-sumed to be higher.8 If this is also true in Brazil, actual
2002/03 HBS, we estimated that food ingested outside home represent 24% of total food expenditures among urban households, and 12% among rural ones.
There are two domestic culinary procedures that may lead to greater wasting of kitchen salt – the major source of sodium in the Brazilian diet – when compared to other foods, namely cooking foods in salted water and the preparation of salted foods. In Brazil, the food items most often cooked in salted water are pasta, potatoes, and carrots. Considering the mean amount of these foods purchased by Brazilian families,a the usual
con-centration of salt in cooking water6,b and the estimated
fraction of the total salt retained by these foods after cooking,17 we estimate that cooking pasta, potatoes,
and carrots wastes approximately 9% of all sodium purchased by Brazilian families. This degree of waste would not be enough to change our conclusions with regard to excess sodium intake in Brazil.
It is diffi cult to estimate the potential impact of the preparation of salted foods on salt waste. In any case, the rarity of such a practice in urban settings suggests that this effect would be small on estimates made for the four-fi fths of the Brazilian population that live in cities. The potentially higher frequency of food salting at home in rural settings could, on the other hand, account for the greater sodium availability in rural households.
In spite of the limitations typical of household budget surveys, mean intake estimates from different food groups based on food purchasing surveys tend to agree with results obtained by individual intake surveys.2,13
Furthermore, in the case of items used as cooking in-gredients, such as oil, sugar, and condiments, household budget surveys are believed to provide better estimates of actual individual intake, since it may be diffi cult for individuals to accurately estimate the amount of such ingredients that they ingest as part of prepared meals.2
Another limitation concerning our sodium intake es-timations, which is common to all dietary surveys, is related to the use of food composition tables, which do not always estimate precisely the sodium content of the food consumed by participants. In the present study, we used a table constructed based on the direct analysis of food items commercialized in Brazil (Tabela Brasileira
de Composição de Alimentos). Items whose
composi-tion is analyzed in this table accounted for 97% of all sodium available for ingestion in households surveyed by the 2002/03 HBS (data not shown).
A comparison of our estimates with those from other countries is complicated by the use of different meth-ods for evaluating sodium intake. Population-based surveys carried out in developed countries usually show evidence of excess sodium intake, their estimates ranging from 3.0 to 4.2 g/p/d.3,9 Though less frequent,
studies carried out in developing countries also show excess sodium intake, with estimates that range from 3.4 to 5.6 g/p/d.15,22
Based on data obtained from the Brazilian salt industry on the production of salt for human consumption, and on the Brazilian population in the year 2000, it was es-timated that per capita sodium availability for that year was 6.0 grams per day, or three times the recommended level of intake.c,d An analysis of data from a household
budget survey carried out by the Fundação Instituto de
Pesquisas Econômicas in the city of Sao Paulo in 1999
estimated a daily household sodium availability of 4.4 g per 2,000 kcal purchase,4 which agrees with our present
estimate for the entire Brazilian population.
Two studies carried out in Brazil around the year 2000 evaluated sodium intake based on urinary excretion of this mineral, fi nding intake levels similar to those observed in the present study. The fi rst of these studies, carried out on a probabilistic sample of the population of the city of Vitória (Southeastern Brazil) aged 25-64 years, reported an estimated sodium intake of 5.0 g/p/d.12 The second of these studies, carried out among
children and adolescents from Porto Alegre (Southern Brazil), estimated a sodium intake of 3.4 g/p/d.11
The inverse relationship between income and sodium availability found in the present analysis has also been reported in other studies carried out in developed countries.14,20
Even though excess sodium intake in Brazil does not seem to differ substantially from that reported in devel-oped countries, differences in terms of the origin of this nutrient are much more marked. In the developed world, it is estimated that the majority of ingested sodium – between 60% and 90% – originates from industrially processed foods rather than from salt added to foods by individuals.1,3 Scenarios similar to the Brazilian one,
where most ingested sodium seems to originate from kitchen salt and salt-based condiments, seem to be the norm among developing countries.18 Be that as it may,
the strong positive association between family income and the portion of sodium originating from processed foods, as well as the rapid and intense expansion of
a Instituto Brasileiro de Geografi a e Estatística. Coordenação de Índices de Preços. Pesquisa de Orçamentos Familiares 2002-2003: análise da disponibilidade domiciliar e estado nutricional no Brasil. IBGE; 2004.
b Pinheiro ABV, Lacerda EMA, Benzecry EH, Gomes MCS, Costa VM. Tabela para avaliação de consumo alimentar em medidas caseiras. 3. ed. Rio de Janeiro; 1993.
c Ministério da Saúde. Secretaria de Atenção à Saúde. Coordenação-Geral da Política de Alimentação e Nutrição. Guia alimentar para a população brasileira: promovendo a alimentação saudável. Brasília; 2005.
1. Andersen L, Rasmussen LB, Larsen EH, Jakobsen J. Intake of household salt in a Danish population.
Eur J Clin Nutr. 12 March 2008 [advance online publication]. DOI: 10.1038/ejcn.2008.18.1
2. Becker W. Comparability of household and individual food consumption data – evidence from Sweden.
Public Health Nutr. 2001;4(5B):1177-82. 3. Beer-Borst S, Costanza MC, Pechère-Bertschi A,
Morabia A. Twelve-year trends and correlates of dietary salt intakes for the general adult population of Geneva, Switzerland. Eur J Clin Nutr. 2009;63:155-64. DOI: 10.1038/sj.ejcn.1602922.
4. Claro RM, Machado FMS, Bandoni DH. Evolução da disponibilidade domiciliar de alimentos no município de São Paulo no período de 1979 a 1999.
Rev Nutr. 2007;20(5):483-90. DOI: 10.1590/S1415-52732007000500004
5. Dickinson BD, Havas S. Reducing the population burden of cardiovascular disease by reducing sodium intake. Arch Int Med. 2007;167(14):1460-8. DOI: 10.1001/archinte.167.14.1460
6. Fisberg RM, Villar BS. Manual de receitas e medidas caseiras para cálculo de inquéritos alimentares. São Paulo: Signus; 2002.
7. Frassetto LA, Morris Jr RC, Sellmeyer DE, Sebastian A. Adverse effects of sodium chloride on bone in the aging human population resulting from habitual consumption of typical American diets. J Nutr. 2008;138(2):S419-22. 8. Guthrie JF, Lin B, Frazao E. Role of food prepared
away from home in the american diet, 1977-78 versus 1994-96: changes and consequences. J Nutr Educ Behav. 2002;34(3):140-50. DOI: 10.1016/S1499-4046(06)60083-3
9. Laatikainen T, Pietenen P, Valsta I, Sudval J, Reinivuo H, Tuomilehto J. Sodium in the Finnish diet: 20-year trends in urinary sodium excretion among the adult population. Eur J Clin Nutr. 2006;60(8):965-70. DOI: 10.1038/sj.ejcn.1602406
10. Levy-Costa RB, Sichieri R, Pontes NS, Monteiro CA. Disponibilidade domiciliar de alimentos no Brasil: distribuição e evolução (1974-2003). Rev Saude Publica. 2005;39(4):530-40. DOI: 10.1590/S0034-89102005000400003
11. Micheli ET, Rosa AA. Estimation of sodium intake by urinary excretion and dietary records in children and adolescents from Porto Alegre, Brazil: a comparison of two methods. Nutr Res. 2003;23(11):1477-87. DOI: 10.1016/S0271-5317(03)00157-X
12. Bisi Molina MC, Cunha RS, Herkenhoff LF, Mill JG. Hipertensão arterial e consumo de sal em população urbana. Rev Saude Publica. 2003;37(6):743-50. DOI: 10.1590/S0034-89102003000600009
13. Naska A, Vasdekis VGS, Trichopoulou A. A preliminary assessment of the use of household budget survey data for the prediction of individual food consumption.
Public Health Nutr. 2001;4(5B):1159-65.
14. Purdy J, Armstrong G, Mcllveen H. The infl uence of socio-economic status on salt consumption in Northern Ireland. Int J Consumer Studies.
2002;26(1):71-80. DOI: 10.1046/j.1470-6431.2002.00212.x
15. Radhika G, Sathya RM, Sudha V, Ganesan A, Mohan V. Dietary salt intake and hypertension in an urban South Indian Population – [CURES – 53]. J Assoc Physicians India. 2007;55:405-11.
16. Report of a WHO forum and technical meeting, 2006; Paris, France. Reducing salt intake in populations. Geneva: WHO; 2007.
17. Sanchez-Castillo CP, James WPT. Defi ning cooking salt intakes for patient counseling and policy making.
Arch Latinoam Nutr. 1995;45(4):259-64.
18. Tian H, Hu G, Dong Q, Yang X, Nan Y, Pietinen P, et al. Dietary sodium and potassium, socioeconomic status and blood pressure in a Chinese population.
Appetite. 1996;26(3):235-46. DOI: 10.1006/ appe.1996.0018
19. Tsugane S, Sasazuki S. Diet and the risk of gastric cancer: review of epidemiological evidence. Gastric Cancer. 2007;10(2):75-83. DOI: 10.1007/s10120-007-0420-0
20. Turrell G, Hewitt B, Patterson C, Oldenburg B, Gould T. Socioeconomic differences in food purchasing behaviour and suggested implications for diet-related health promotion. J Hum Nutr Diet. 2002;15(5):355-64. DOI: 10.1046/j.1365-277X.2002.00384.x
21. World Health Organization. Diet, nutrition and the prevention of chronic diseases. Report of a Joint WHO/ FAO Expert Consultation. Geneva; 2003. (WHO Technical report series, 916).
22. Zhou BF, Stamler J, Dennis B, Moag-Stahlberg A, Okuda N, Robertson C, et al. Nutrient intakes of middle-aged men and women in China, Japan, United Kingdom, and United States in the late 1990s: the Intermap study. J Human Hypertension
2003;17(9):623-30. DOI: 10.1038/sj.jhh.1001605
REFERENCES
processed food consumption in Brazil,10 provide
evi-dence of the growing importance of processed foods to overall sodium intake in Brazil.
In conclusion, our results confirm the notion that sodium intake in Brazil widely exceeds maximum recommended intake levels for this nutrient in all