Scientiic/Technical Article
http://dx.doi.org/10.1590/2318-0331.0117160035
Longitudinal distribution of extreme pressures in a hydraulic jump
downstream of a stepped spillway
Distribuição longitudinal das pressões extremas em um ressalto hidráulico formado a jusante de um vertedouro em degraus
Carolina Kuhn Novakoski1, Roberta Ferrão Hampe1, Eliane Conterato1, Marcelo Giulian Marques1 and Eder Daniel Teixeira1
1Universidade Federal do Rio Grande do Sul, Porto Alegre, RS, Brazil
Emails: [email protected] (CKN), [email protected] (RFH), [email protected] (EC), [email protected] (MGM), [email protected] (EDT)
Received: October 19, 2016 - Revised: January 18, 2017 - Accepted: May 08, 2017
ABSTRACT
The overlow system of a dam safely controls the water level of a reservoir. The design of these structures should predict the damage caused by the action of the turbulent low to which they are subject to. The combination formed by a stepped spillway followed by a stilling basin promotes a considerable portion of the energy dissipation in the actual chute of the stepped spillway but it is not suficient to completely avoid the risk of damaging the basin. In this paper, we analyze the longitudinal distribution of extreme pressures in a stilling basin downstream of a stepped spillway. The study was based on the instant pressure data from the tests carried out in a physical model in the Laboratório de Obras Hidráulicas in IPH/UFRGS. Thus, it was found that the pressure behavior is similar to that observed in studies involving smooth chute spillways, except in the area surrounding the base of the stepped spillway, where high pressure luctuations may occur. This happens as a result of the impact caused by the low in the dissipation structure, which is not observed downstream of smooth chute spillways due to the existence of a vertical concordance curve between the spillway and the
stilling basin.
Keywords: Stepped spillway; Stilling basin; Hydraulic jump.
RESUMO
O sistema extravasor de uma barragem controla o nível d’água do reservatório com segurança. O projeto dessas estruturas deve prever os danos causados pela ação do escoamento turbulento a que está sujeito. A composição formada por vertedouro em degraus seguido
por bacia de dissipação promove uma parte considerável da dissipação de energia na própria calha do vertedouro em degraus, mas não evita completamente o risco de danos na bacia. Neste trabalho, analisa-se a distribuição longitudinal das pressões extremas em uma
bacia de dissipação a jusante de um vertedouro em degraus. O estudo foi realizado com base nos dados de pressões instantâneas obtidos em um modelo físico no Laboratório de Obras Hidráulicas do IPH/UFRGS. Assim, veriicou-se um comportamento semelhante das pressões ao observado em estudos com vertedouros de calha lisa, exceto pela região junto ao pé do vertedouro em degraus, onde podem ocorrer grandes lutuações de pressões. O fato decorre do impacto do escoamento na estrutura de dissipação que não é observado a jusante de vertedouros de calha lisa devido à presença de uma curva de concordância vertical entre o vertedouro e a bacia de dissipação.
INTRODUCTION
Large hydraulic works require an overlow system that allows loods to pass without damaging their structure. One of
the arrangements adopted utilizes stilling basins by hydraulic
jump located downstream of spillways. As the low arrives at the base of the spillway with a great kinetic energy, the basins aim at
the dissipation of this residual energy. In the case of the use of
stepped spillways, the dissipation of part of the upstream energy occurs along the chute during the passage of the low. While a smooth chute spillway can dissipate up to 5% of the upstream
energy, according to studies such as those of Peterka (1957), a
stepped spillway, depending on the characteristics of the low (speciic discharge) and spillway geometry (face height), can dissipate up to 89% of this energy, as indicated by Sanagiotto and Marques (2008) and Conterato, Marques and Alves (2015), among others.
Thus, the downstream dissipation structure by hydraulic jump can
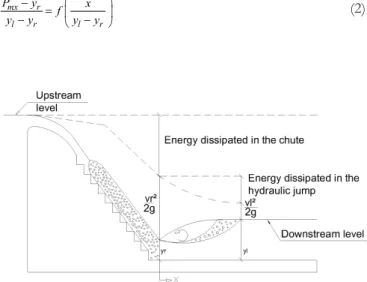
be reduced in size and the risks of damage to the structure are minimized. Figure 1 shows a scheme of the energy dissipation in
a structure composed of a stepped spillway followed by a stilling basin with the occurance of a hydraulic jump.
The hydraulic jump is a highly turbulent phenomenon, characterized by the encounter of the supercritical low with the subcritical low, generating strong undulations and luctuations of pressure and velocity. Thus, the knowledge of its geometrical
characteristics and the longitudinal distributions of the pressures
acting along the hydraulic jump is of extreme importance for the
correct design of the stilling basin.
According to Zanoni et al. (2015), the knowledge of extreme
values of pressures associated with certain probabilities of occurrence
are of great importance, since they correspond to the critical conditions of operation of the stilling basin. According to Lopardo (2003), extreme negative pressures with probabilities equal to or
less than 0.1% can be used to evaluate the tendency to cavitation in dissipation structures subjected to turbulent lows. According to
LNEC (PORTUGAL, 1981), in prototype, pressure values lower than -6.0 mH2O can cause erosion/cavitation. Despite the need to study the extreme negative pressures for the analysis of the processes related to cavitation, the study of the extreme positive pressures is important for the correct design of the dissipation structure, since, according to Lopardo (2012), extreme pressures
with probability of non-exceedance of 99.9% allow an estimation
of the maximum pressures acting in the basin. According to Drapeau, Verrette and Marques (1997), the pressures with a certain probability of occurrence can be estimated through Equation 1.
%= + %
a m a
P P N σ (1)
Where Pa% = pressure in mH2O for a probability “a” of non-exceedance;
m
P = mean pressure at point x in mH2O; Na% = statistical
coeficient of probability distribution; σ = standard deviation at point x, in mH2O.
In the literature, there are few studies that present information
about the longitudinal distribution of extreme pressures in a hydraulic
jump. Endres (1990), Marques (1995), Trierweiler Neto (2006) and Souza (2012) studied the longitudinal distribution of pressures in
hydraulic jumps. Endres (1990) studied the hydraulic jump for lows
with Froude numbers between 4.7 and 8.6 formed downstream of
a smooth chute, Marques (1995) studied lows downstream of a
smooth chute spillway with Froude numbers between 4.9 and 9.3;
Teixeira (2003) studied the hydraulic jump also downstream of a smooth chute through data obtained in models and prototype,
Trierweiler Neto (2006) studied the hydraulic jump formed downstream of a gate and Souza (2012) carried out his studies with
lows with Froude numbers between 1.7 and 7.73 downstream of a smooth chute spillway. Figure 2 presents the values obtained by
the authors for pressures with probability of non-exceedance of 0.1% (P0.1%) and 99.9% (P99.9%) compared to the values of mean
pressures (Pm). In this igure, the data are presented using the
dimensionless parameters suggested by Drapeau, Verrette and Marques (1997) for the analysis of the longitudinal distribution of mean pressure (Equation 2), the mean pressure being substituted by the extreme pressures (P0.1%) and (P99.9%).
− =
− −
mx r
l r l r
P y x
f
y y y y (2)
Figure 1. Schematic of energy dissipation in a stepped spillway
followed by stilling basin.
Figure 2. Maximum, medium and minimum pressures measured
Where yr = upstream depht, in m; yl = downstream depht, in
m. X = distance from the transducer to the starting point of the
hydraulic jump, in m.
EXPERIMENTAL INSTALLATION
The tests were carried out in a physical model installed at the Laboratory of Hydraulic Works (LOH), located at the
Hydraulic Research Institute (IPH) of the Federal University of Rio Grande do Sul (UFRGS). The model consists of a stepped
chute followed by a channel. The channel has a height of 1.20 m and a length of approximately 8 m, 5 m of which have acrylic walls in order to allow the visualization of the low. The stepped spillway is located downstream of a reservoir with a length of 5 m with the purpose of tranquilizing the low. In order to control the height of the water level in the stilling basin, a venetian gate and a piezometric tube with graduated scale were installed downstream of the structure to allow the reading of the downstream water level without the inluence of the hydraulic jump.
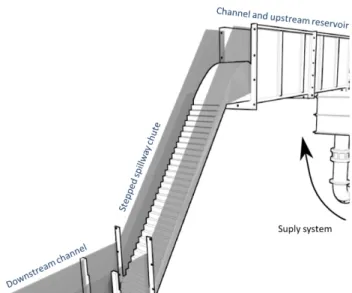
Table 1 presents the characteristics of the model and Figures 3 and 4 present, respectively, a photo and a schematic of the experimental model used. Figure 5 shows a schematic of the
stepped spillway.
DATA ACQUISITION
The pressures near the bottom of the stilling basin
were acquired from Sitron pressure transducers model SP 96. Twenty transducers were installed along the channel starting at the spillway’s base as shown in Figure 6. Data acquisition was performed
simultaneously on all transducers. The irst 10 transducers used from the end of the chute have a range of -1.5 to 3.0 mH2O and the rest have an acquisition range of -1.5 to 1.5 mH2O. In order
to avoid distortions caused by the connection of the transducers
with hoses, the equipment was installed through a screwable support, as shown in Figure 7, the transducer membrane being 28 mm from the bottom of the channel.
A digital analog converter with 16-bit resolution and admissible
voltage range from -10 to 10 V of the National Instruments
brand was used to receive signals from the transducers. The tests were carried out for 15 minutes at a frequency of 128 Hz, ie, 115.200 sample points were generated per test.
Table 1. Characteristics of the model and the prototype.
Characteristics Model
Height of the upstream face 2.44 m
Step height 0.06 m
Step width 0.045 m
Width of spillway 0.4 m
Chute slope 1.00V:0.75H
Figure 3. Photo of the experimental model used.
Figure 4. Schematic of the experimental model used.
Figure 5. Detailed schematic of the stepped spillway.
GENERAL TEST CONSIDERATIONS
Five tests were carried out with different discharges, in which the maximum discharge limit was obtained in order to avoid channel overlow and the minimum discharge limit was determined
by the accuracy of the available electromagnetic meter. Thus, the
discharges tested were: 40, 60, 80, 100 and 110 l/s. Table 2 shows
the characteristics of the tests. The downstream depht (yl) was
measured during the tests and the upstream depht (yr) was calculated by the Bélanger equation (Equation 3). The Froude and Reynolds numbers were calculated using Equations 4 and 5.
(
)
= + 2−
l
r r
y 1
1 8F 1
y 2 (3)
= ×
r r
r v F
y g (4)
× = r r e
v y
R
ν (5)
Where Q = discharge; vr = mean velocity at the start of the hydraulic jump; Fr = Froude number at the start of the hydraulic jump; Re= Reynolds number at the start of the hydraulic jump; g = acceleration of gravity; ν = viscosity of the luid.
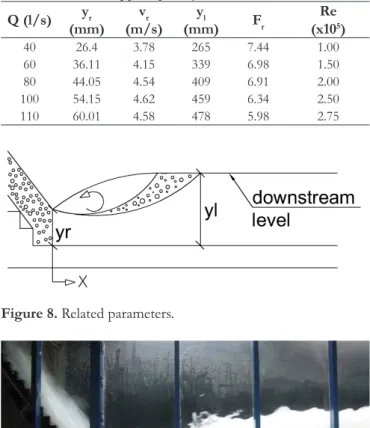
All tests included the formation of a free hydraulic jump
(Figures 8 and 9). In order for this condition to be met, the
downstream level, Nj, was adjusted, through a venezian type gate, located downstream of the channel, so that the hydraulic jump had its beginning at the base of the spillway. In this way, it is possible to identify the downstram depht (yl). Figure 8 shows
the related parameters and Figure 9 shows an image of the low for a discharge of 80 l/s (Fr = 6.91).
By analyzing the low parameters, shown in Table 2, it can be
observed that practically all the lows follow the recommendations
of Lopardo, De Lio and Lopardo (1999), that is, Reynolds number greater than 105 and upstream depht greater or equal to 30 mm.
RESULTS
From the obtained data, the extreme pressures with non-exceedance probability of 0.1% (P0.1%), 1.0% (P1.0%), 99.0% (P99.0%)
and 99.9% (P99.9%) for each discharge tested were identiied. For the
analysis of the longitudinal distribution of extreme pressures, these
pressures were made dimensionless according to Equation 2, but
by replacing the mean pressure (Pm) with the extreme pressure
with a probability of non-exceedance (Pa%) it results in Equation 6.
%− =
− −
a r
l r l r
P y x
f
y y y y (6)
Figures 10 and 11 present the data obtained for extreme
pressures with non-exceedance probability of 0.1% and 99.9%
compared to the mean pressure values for the Froude number
6.34 (100 l/s). The data shown in Figure 10 are presented in their
raw form, in mH2O. Figure 11 shows the data obtained for the different Froude numbers, made dimensioneless by Equation 6.
Through Figures 10 and 11, it can be perceived that the
extreme pressures with probability of non-exceedance of 99.9% have their highest value in the section closest to the spillway. Conversely, at the same point, extreme pressures with a non-exceedance probability of 0.1% have their lowest value, reaching negative values. This fact can be justiied due to the impact at this point of the low coming from the spillway’s chute, directly acting on the bottom of the channel, providing high pressures and low pressures by the relection of the low. After this point, at the approximate
position of 1 (yl−yr), the dimensionless parameters for pressure with probability of non-exceedance of 99.9% undergo a sharp
Table 2. Characteristics of the tests performed in a stilling basin
downstream of a stepped spillway.
Q (l/s) yr
(mm) vr (m/s)
yl
(mm) Fr
Re (x105)
40 26.4 3.78 265 7.44 1.00
60 36.11 4.15 339 6.98 1.50
80 44.05 4.54 409 6.91 2.00
100 54.15 4.62 459 6.34 2.50
110 60.01 4.58 478 5.98 2.75
Figure 7. Overview of transducer installation.
Figure 8. Related parameters.
reduction. Between this position and position 4 (yl−yr), the values decay linearly with a gradient of 7.6%. After this position,
the values of the dimensionless parameters have a more mild
gradient, of the order of 0.3%, until position 8 (yl−yr). At this point, the mean value is 10.2% above the dimensionless parameter for mean pressure, which in this case is 1.0.
The dimensionless parameters for pressure with probability of non-exceedance of 0.1% increase after position 1 (yl−yr).
From this point to position 6 (yl−yr), the values of the dimensionless parameters for pressure increase linearly with a gradient of 19.9%. After this position, the dimensionless values have a more mild gradient of the order of 7.4% until position 8 (yl−yr).
For position values greater than 8 (yl−yr), it tends to be about 7.0% below the dimensionless parameters for the mean pressure which in this case is 1.0.
It is important to note that approximately at position 6 (yl−yr) occurs the end of the hydraulic jump roller as
demonstrated by Lopardo and Henning (1986), Drapeau, Verrette and Marques (1997), Teixeira (2003) and Trierweiler Neto (2006). In the vicinity of position 8 (yl−yr) is where the inluence of the hydraulic jump on the low ends as already demonstrated by
Drapeau, Verrette and Marques (1997), who considered the end
of the inluence of the hydraulic jump in position 8.5 (yl−yr) and
Teixeira (2003), who considered the end in position 8 (yl−yr).
Figures 12 to 19 present the extreme pressure data obtained
in the present study for lows with Froude number at the base of the stepped spillway ranging from 5.98 to 7.44. Figures 12, 14, 16 and 18 show raw pressure data. Figures 13, 15, 17 and 19 present
the same data made dimensionless through Equation 6, compared to the extreme pressures observed by the studies carried out in
a hydraulic jump upstream of a smooth chute by Endres (1990), Marques (1995) and Souza (2012) until the dimensionless position
of 10 (yl−yr), for better visualization.
Analyzing Figures 12, 14, 16 and 18, it can be observed that the extreme pressures are greater as the Froude number is smaller, it is also noticiable that the data tends to become more
dispersed as the distance from the base of the spillway increases.
Observing Figures 13, 15, 17 and 19 made dimensionless it can be ascertained that, from the dimensionless position of 1 (yl−yr), the longitudinal distributions of pressures with probability of non-exceedance of 0.1%, 1, 0%, 99.0% and 99.9% caused by a hydraulic jump downstream of a stepped spillway exhibit a
behavior similar to the same pressures generated by a hydraulic
jump downstream of a smooth chute.
Further more, upstream of the dimensionless position of 1 (yl−yr), the pressures with non-exceedance probabilities of 0.1% and 1.0% observed downstream of a stepped chute reach signiicantly lower values than the same values observed downstream of a smooth chute, according to the studies
carried out by Endres (1990), Marques (1995) and Souza (2012), reaching values close to -1.0 for the non-exceedance probability
of 0.1% and of 0.6 for the probability of 1.0%. Conversely, in this same position, the pressures with probabilities of non-exceedance of 99.0% and 99.9% observed downstream of the stepped chute reach higher values than the same values observed downstream
of smooth chute in the studies carried out by the same authors,
reaching values close to 3.5 for the probability of 99.0% and of 4.5 for the probability of 99.9%.
The difference between the values of extreme pressures observed between the studies carried out by the present study (with hydraulic jump downstream of a stepped chute) and the
values obtained by Endres (1990), Marques (1995) and Souza (2012) (with hydraulic jump downstream of a smooth chute) can
be justiied due to the fact that the model where the tests of the present work were performed does not have a concordance curve between chute and spillway, unlike the models used by the cited
authors. According to Dai Prá et al. (2012), the vertical concordance
curve observed in the transition between a spillway and a stilling basin has as main objective the attenuation of the hydrodynamic stresses suffered by the low due to the change of channel slope.
It is also important to point out that the dimensionless
pressures with non-exceedance probabilities of 0.1% and 1% have negative values from the nearest position of the spillway
until the approximate dimensionless position of 3 (yl−yr) for the probability of 0.1% and 2 (yl−yr) for the probability of 1%, which indicates the existence of areas where erosion and
cavitation can occur. In these regions, damages to the dissipation structure may occur, despite the mean pressures not reaching the critical value for the occurrence of these erosive phenomena, as observed by Lopardo (2003).
Figure 10. Raw pressure data with non-exceedance probability of
0.1%, 99.9% and mean pressures for the Froude number of 6.34.
Figure 11. Pressure data made dimensionless and with non-exceedance
probability of 0.1%, 99.9% and mean pressures for all Froude
Figure 12. Raw pressure data with probability of non-exceedance
of 0.1%.
Figure 13. Pressure data made dimensionless and with probability
of non-exceedance of 0.1% compared to those of Endres (1990),
Marques (1995) and Souza (2012).
Figure 14. Raw pressure data with probability of non-exceedance
of 1.0%.
Figure 15. Pressure data made dimensionless and with probability
of non-exceedance of 1.0% compared to those of Endres (1990),
Marques (1995) and Souza (2012).
Figure 16. Pressure data made dimensionless and with probability
of non-exceedance of 99.0%.
Figure 17. Pressure data made dimensionless and with probability
of non-exceedance of 99.0% compared to those of Endres (1990),
Marques (1995) and Souza (2012).
Figure 18. Pressure data made dimensionless and with probability
of non-exceedance of 99.0%
Figure 19. Pressure data made dimensionless and with probability
of non-exceedance of 99.9% compared to those of Endres (1990),
Figure 20 shows, in a same graph, the mean and extreme
pressures with non-occurrence probability of 0.1%, and 99.9% obtained by the present work compared with the same
pressures obtained by Endres (1990), Marques (1995) and Souza (2012). There is similarity between the longitudinal behavior of
the pressures made dimensionless in a stilling basin downstream
of smooth and stepped chutes, except for the pressures that affect
the structure at the base of the stepped spillway.
Figure 21 shows the maximum luctuation of the extreme pressures made dimensionless, calculated through Equation 7, for the data obtained by the present study for all the Froude numbers tested. In comparison, data obtained from data provided by the authors Endres (1990) and Marques (1995) are presented.
. % . %
( − )−
=
− −
99 9 0 1 r
l r l r
P P y x
f
y y y y (7)
From Figure 21, points with greater pressure luctuation
can be located (greater difference between P99.9% and P0.1%).
Thus, it is perceived that the location where the greatest pressure luctuations occur is in the region near the stepped chute before
the position 1 (yl−yr) due to the impact of the low. From this point, the amplitude of the pressure luctuation decreases to the
approximate position of 6(yl−yr) with a gradient of 30.8%,
and from this position to the position where the inluence of the hydraulic jump ends, 8(yl−yr), the magnitude of the pressure luctuation decreases mildly with a gradient of 6.1%.
In addition, it has been found that the amplitude of the
pressures occurring downstream of a stepped spillway differs from those expected downstream of a smooth chute in the region between the positions 0 (yl−yr) and 1(yl−yr). The low pressure luctuation observed in the data provided by Endres (1990) and
Marques (1995) is due to the existence of a concordance curve
between the spillway and the stilling basin, attenuating the pressures
at the beginning of this structure. After position 1 (yl−yr), the luctuations of the extreme pressures downstream of stepped and smooth spillways are similar to each other.
CONCLUSIONS
This paper analyzes the longitudinal distribution of extreme
pressures in a dissipation basin downstream of a stepped spillway in lows with Froude number between 5.98 and 7.44. With the study carried out, it was concluded that the behavior of the pressures along the dissipation basin downstream of the stepped chute is similar to that veriied for the smooth chute, from the
dimensionless position 1(yl−yr).
On the other hand, between the dimensionless
positions 0 (yl−yr) and 1 (yl−yr), there was a signiicant difference between the data of the present study and those obtained by Endres (1990), Marques (1995) and Souza (2012). For the non-exceedance
probabilities of 99.0% and 99.9%, this difference reaches
dimensionless values of about 3.0 and 4.0, respectively, and the pressures made dimensionless decrease rapidly until it meets the data from the smooth chute studies (Figures 17 and 19). For the
probabilities of non-exceedance of 1.0% and 0.1%, the difference reaches absolute dimensionless values of the order of 0.5 and 1.0,
respectively, and the pressures decrease, and later increase sharply until meeting the data of the others authors in position 1 (yl−yr),
(Figures 13 and 15). This can be justiied due to the absence of a
concordance curve between the spillway proile and the channel bottom, which exists in the smooth chute studies, that attenuates the impact of the low.
It was veriied that the pressure luctuation in the region near the base of the spillway is more expressive in the pressures with probability of non-exceedance of 99% and 99.9%. However, extreme pressures with a probability of occurrence of 0.1% and 1% require
careful evaluation, since their negative values represent cavitation
risk of the stilling basin. Likewise, the region between positions 0
(yl−yr) and 3 (yl−yr) was identiied as a zone of cavitation risk
due to the possibility of negative dimensionless pressures.
In continuation to this work, statistical characteristics of the pressures (dominant frequencies, coeficients of probability distribution N, pressures with other probabilities of occurrence, among others) will be analyzed in order to allow a better understanding of the characteristics of the hydraulic jump and the inluence of the type of low at the inlet of a stilling basin downstream of a stepped chute.
Figure 20. Mean and extreme pressures with probability of
non-occurrence of 0.1% and 99.9% obtained by the present study compared with the same pressures obtained by Endres (1990), Marques (1995) and Souza (2012).
ACKNOWLEDGEMENTS
The authors would like to thank the researchers for granting their data for conducting the study, as well as for IPH/UFRGS,
Eletrobras-Furnas, CNPq and Finep.
REFERENCES
CONTERATO, E.; MARQUES, M. G.; ALVES, A. A. M. Proposta de uniformização das equações de previsão das características do escoamento sobre a calha de um vertedouro em degraus. Revista Brasileira de Recursos Hídricos, v. 20, n. 1, p. 131-137, 2015. http:// dx.doi.org/10.21168/rbrh.v20n1.p131-137.
DAI PRÁ, M.; COLLARES, G. L.; ALVES, A. A. M.; MARQUES,
M. G. Pressões médias e flutuantes devidas ao escoamento em uma curva de concordância vertical entre vertedouro e canal
horizontal: estudo experimental. Revista Brasileira de Recursos Hídricos, v. 17, n. 3, p. 197-207, 2012. http://dx.doi.org/10.21168/rbrh. v17n3.p197-207.
DRAPEAU, J.; VERRETTE, J.-L.; MARQUES, M. Flutuação de pressão em um ressalto hidráulico. Revista Brasileira de Recursos Hídricos, v. 2, n. 2, p. 45-52, 1997. http://dx.doi.org/10.21168/
rbrh.v2n2.p45-52.
ENDRES, L. A. M. Contribuição ao Desenvolvimento de um Sistema para Aquisição e Tratamento de Dados de Pressões Instantâneas em Laboratório. 1990. 104 f. Dissertação (Mestrado em Recursos Hídricos e Saneamento Ambiental) - Programa de Pós-Graduação em Recursos Hídricos e Saneamento Ambiental, Universidade Federal do Rio Grande do Sul, Porto Alegre, 1990.
LOPARDO, R. A. Cavitación em fluxos macroturbulentos. Matematicae Notae, n. 42, v. 2, p. 19-40, 2003.
LOPARDO, R. A. Internal flow of free hydraulic jump in stilling basins. In: IAHR INTERNATIONAL SYMPOSIUM ON HYDRAULIC STRUCTURES, 4., 2012, Porto, Portugal. Proceedings... Porto: IAHR, 2012. p. 1-8.
LOPARDO, R. A.; DE LIO, J. C.; LOPARDO, M. C. Physical modelling and design estimation of instantaneous pressures in
stilling basins. In: IAHR WORLD CONGRESS, 28., 1999, Graz,
Austria. Proceedings... Graz: IAHR, 1999. p. 1-7.
LOPARDO, R. A.; HENNING, R. E. Efectos de las condiciones
de ingreso al ressalto sobre el campo de pressiones instantâneas.
In: CONGRESSO LATINO AMERICANO DE HIDRÁULICA, 12., 1986, São Paulo, Brasil. Anais... São Paulo: Comité Regional Latino Americano da AIPH, 1986. v. 1, p. 116-127.
MARQUES, M. G. Nouvelle Approche Pour Le Dimensionnement des Dissipateus à Auge. 1995. 221 f. Tese (Doutorado) - Faculte des
Sciences et Génie, Université Laval, Quebec, Canadá, 1995.
PETERKA, A. J. Hydraulic design of stilling basins and energy dissipators.
Washington: U. S. Govt. Print. Off, 1957.
PORTUGAL. Ministério da Habitação de Obras Públicas. Laboratório
Nacional de Engenharia Civil. Critérios para dimensionamento hidráulico de barragens descarregadoras. Lisboa: Ministério da Habitação de
Obras Públicas, 1981. (Memória, 556).
SANAGIOTTO, D. G.; MARQUES, M. G. Características do
escoamento em Vertedouros em degraus de declividade 1V:0,75H.
Revista Brasileira de Recursos Hídricos, v. 13, n. 4, p. 17-31, 2008. http://dx.doi.org/10.21168/rbrh.v13n4.p17-31.
SOUZA, P. E. A. Bacias de Dissipação por Ressalto Hidráulico com Baixo Número de Froude: análise das pressões junto ao fundo da estrutura. 2012. 76 f. Dissertação (Mestrado em Recursos Hídricos e Saneamento Ambiental) - Programa de Pós Graduação em Recursos Hídricos e Saneamento Ambiental, Universidade Federal do Rio Grande do Sul, Porto Alegre, 2012.
TEIXEIRA, E. D. Previsão dos valores de pressão junto ao fundo em bacias de dissipação por ressalto hidráulico. 2003. 113 f. Dissertação (Mestrado em Engenharia) - Programa de Pós Graduação em Recursos Hídricos e Saneamento Ambiental, Universidade Federal do Rio Grande do Sul, Porto Alegre, 2003.
TRIERWEILER NETO, E. F. Avaliação do campo de pressões em ressalto hidráulico formado a jusante de uma comporta com diferentes graus de submergência. 2006. 174 f. Dissertação (Mestrado em Engenharia) - Programa de Pós-Graduação em Recursos Hídricos e Saneamento Ambiental, Universidade Federal do Rio Grande do Sul, Porto Alegre, 2006.
ZANONI, E. C.; SOUZA, P. E. A.; TRIERWEILER, E. F.;
WIEST, R. A.; DAI PRÁ, M.; ENDRES, L. A. M.; MARQUES,
M. G.; TEIXEIRA, E. D. Análise das pressões extremas atuantes
em bacias de dissipação por ressalto hidráulico com baixo número
de Froude. In: SIMPÓSIO BRASILEIRO DE RECURSOS
HÍDRICOS, 21., 2015, Brasília, Brasil. Anais... Brasília: ABRH,
2015. p. 1-8.
Authors contributions
Carolina Kuhn Novakoski: statistical analysis of the data studied, elaboration of the graphs, interpretation and discussion of the
results, bibliographical revision, writing and revision of the text.
Roberta Ferrão Hampe: statistical analysis of the data studied,
elaboration of the graphs, bibliographical revision, writing and
revision of the text.
Eliane Conterato: designing the model, performing measurements, interpreting results, revision of the text.
Marcelo Giulian Marques: designing the model, elaboration of the methodology interpretation and discussion of the results revision of the text.