Prediction of Ceramic Foams Permeability Using Ergun’s Equation
Murilo D.M. Innocentini
a, Vânia R. Salvini
a, Alvaro Macedo
b,
Victor C. Pandolfelli
a*
a
Departamento de Engenharia de Materiais, Universidade Federal de São Carlos, 13565-905 São Carlos - SP, Brazil
b
EMBRAPA-CNPDIA, 13560-970 São Carlos - SP, Brazil
Received: June 19, 1999; Revised: October 28, 1999
SiC-Al2O3 ceramic foams with 30 to 75 pores per linear inch (ppi) were used to access the
application of pore size obtained by image analysis to estimate the cellular materials permeability through Ergun’s equation. Samples were sliced and the pore size distribution, cross-sectional porosity and pore density were evaluated as a function of the slice thickness based on optical and X-ray computerized tomography acquired images. The average pore sizes were used to calculate permeability constants (k1 and k2) of Ergun’s equation, which were compared to those
experimen-tally obtained under water flow. Results indicated that the optical diameter distribution was very sensitive to the number of pore layers. Deviation between experimental and calculated values depended on the slice thickness. Nevertheless, the introduction of pore size obtained by image analysis into Ergun’s equations seems to give fair results to assess the permeability of ceramic foams.
Keywords: permeability, Ergun’s equation, ceramic foams, image analysis
1. Introduction
Permeability is an important parameter for the charac-terization of ceramic foams employed in filtration applica-tions. Correct estimation of the pressure drop across the filter allows the filtration rate and/or the energy consumed on fluid flow to be more accurately controlled. Permeability prediction is specially useful when experimental determi-nation must be proceeded in hostile environments, such as in the flow of molten metals. The use of reliable equations is in this case essential for the correct flow prediction and control during operation1-3.
Forchheimer’s equation has been successfully em-ployed in the literature to predict the permeability of granu-lar media4-6. S uc h eq ua ti on s tat es t hat for an uncompressible fluid, the pressure drop through a rigid and homogeneous porous medium is given by:
∆P L =
µ
k1 vs +
ρ
k2 v 2
s (1)
where vs is the fluid velocity, L is the medium thickness, µ and ρ are the fluid viscosity and fluid density respectively, and k1 and k2 are constants only dependent on the medium properties, known respectively as Darcian and non-Darcian permeabilities.
Ergun7, in 1952, proposed expressions to describe k1 and k2 for packed columns made of spheres, cylinders, tablets, nodules, round sand and crushed materials (glass, coke, coal, etc.) as follows:
k1 = ε 3
dp2
150 (1 −ε)2 (2)
k2 = ε 3
dp
1.75 (1 −ε) (3)
where ε is the porosity and dp is the mean particle diameter of the granular medium.
The major problem in the permeability evaluation of a ceramic foam is to reliably define structural properties of the cellular medium to replace the particle diameter (dp) in Eqs. (2) and (3). Although this parameter is clearly quanti-fied for granular media, difficulties arise when it is assumed that the web-like cellular structure made of solid filaments connected in the three dimensions has a particle diameter8. Several attempts have been presented in the literature trying to replace the particle size and possibly the most obvious trial is the use of the pore or cell diameter (dc)9-11, which is usually determined by examining enlarged photo-graphs of cross-sections of foam samples. Although the pores are tortuous and interconnected, with a distribution
of sizes and shapes, it has been convenient in the literature to assume that dc represents the cylindrical form of the hydraulic diameter, defined as12:
dc = 4volume available for flow
total wetted surface (4)
which gives:
dc = 4 (1 −ε)
ε Sv (5)
where Sv is the specific surface, i.e., the total particle surface per volume of the particle.
The quantity Sv is used to define the mean particle diameter (dp) assuming particles as spheres:
dp = 6
Sv (6)
Substitution of (6) in (5) finally gives the relationship between pore and particle size for a porous medium:
dp = 1.5 (1 −ε)
ε dc (7)
Equation (7) allows to obtain an equivalent particle size for the cellular structure based on its mean pore size. Once the porosity ε is quantified, Ergun’s relationships (Eqs. 2 and 3) can be used to estimate the permeability constants k1 and k2.
While porosity is easily obtained by a water absorption test or via mass and volume calculations, the determination of pore size faces experimental problems. Since the tradi-tional technique of mercury porosimetry is not suitable for highly-porous materials, the best alternative found has been the use of an analysis in which the cellular structure has its solid and void phases quantified through a digital image obtained in a microscope or macroviewer. Nevertheless, the lack of standard conditions for image acquisition has re-strained the use of representative pore sizes into Ergun’s equations, and also has been the main obstacle for reliable data comparison in the literature.
Within this context, the objective of this work was to evaluate the applicability of pore size values obtained by image analysis to predict the permeability of ceramic foams through Ergun’s equations. SiC-Al2O3-based ceramic foams with 30 to 75 pores per linear inch (ppi) were cut in slices of different thicknesses and the average pore size obtained in each one of them was converted into equivalent particle diameter for use in Ergun’s equations. The calcu-lated permeability constants were compared with those obtained experimentally under water flow.
2. Experimental
SiC-Al2O3 foams containing 50 %wt alumina were produced by making ceramic replicas of open-cell
polyure-thane foams with 30, 45, 60 and 75 pores per linear inch (ppi)8,13. Samples obtained were disk-like shaped ceramics with a diameter of 75 mm and 25 mm thick.
The total porosity of the samples (εt) was calculated with basis on mass and volume measurements using the expression εt = 1 – ρg/ρs, where ρg is the geometric density and ρs = 3.36 g/cm3 is the theoretical density of the SiC-Al2O3-based samples produced. The open porosity (ε) was calculated by deducting from εt the closed porosity ob-tained by helium picnometry.
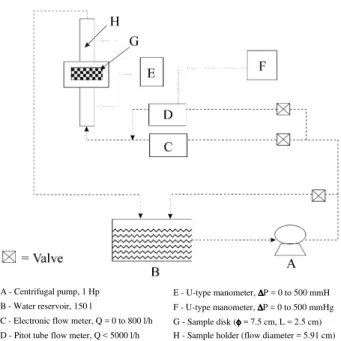
Experimental pressure drop (∆P) across each sample was measured using the apparatus schematized in Fig. 1. Permeability constants k1 and k2 were obtained by fitting Forchheimer’s equation (Eq. 1) to experimental values of
∆P/L vs. water velocity (vs). Tests were carried out in triplicate to guarantee the data repeatability.
After the permeability tests, a rectangular sample (30 x 30 x 25 mm3) was cut from the center of each ceramic foam filter using a diamond wafering saw (Isomet Buehler) with a 0.4 mm thick blade. Samples were then soaked in color-less resin (10.249 Resin and Hardener, VI Indústria &
Comércio) and after hardening they were shaped and
pol-ished as disks with diameter of 30 mm and thickness of 25 mm. Each disk then was cut perpendicularly to the flow direction with the diamond wafering saw in several slices with thickness ranging from 0.15 mm to 1.7 mm. Reduction in the opacity on the slice surfaces due to sawing was accomplished by spraying mineral oil (WD-40 Company) on them. Image acquisition was performed for each slice with help of a record camera (Galai CCD Macroviewer).
A - Centrifugal pump, 1 Hp E - U-type manometer, ∆∆∆∆P = 0 to 500 mmH B - Water reservoir, 150 l F - U-type manometer, ∆∆∆∆P = 0 to 500 mmHg C - Electronic flow meter, Q = 0 to 800 l/h G - Sample disk (φφφφ = 7.5 cm, L = 2.5 cm) D - Pitot tube flow meter, Q < 5000 l/h H - Sample holder (flow diameter = 5.91 cm)
Illumination during acquisition was directed upwards through the slice, so that the contrast in the image produced a dark gray solid phase and a bright void fraction. The same patterns of luminance, brightness and contrast for all slices were used for the image binarization. The cross-sectional pore size distribution, pore density (number of pores per image unit area) and cross-sectional porosity (total pore area per image unit area) were obtained for each slice using the software IMAGE-PRO Plus 3.0. The image area ana-lyzed for each slice was 238 mm2 and the total number of pores acquired in each image varied between 20 and 300, depending on the pore pattern.
Average two-dimensional pore size (dc) was statisti-cally obtained for each pore size distribution and the mean values were converted into equivalent particle diameters (dp) using Eq. (7). Permeability constants k1 and k2 were calculated using Eqs. (2) and (3).
Micrometric resolution X-ray Computerized Tomogra-phy (CT) was also used to obtain details of the pore struc-ture14. The advantage of this technique, besides non-invasibility, is the capability of investigating inside opaque samples without the need of any special sample preparation. The CT technique is based on the principle of electromagnetic radiation attenuation by matter. When a ray beam crosses a sample, the number of photons in the direction of the beam can be attenuated following the Beer-Lambert law:
I = I0 e−α x (8)
where Io and I are respectively the incident and the emerging beam number of photons, α is the linear attenuation coefficient for the specific radiation energy in use and x is the thickness of the sample crossed by the beam. The linear attenuation coefficient is the probability per unit length of a photon to be absorbed while crossing the sample. A micrometric X-ray CT scanner, developed at EM-BRAPA Instrumentation Center, consisting of a Tungsten X-ray tube, 3 kW generator, beam width of 0.08 mm at sample center, collimator of 0.06 mm, was used for acqui-sition of 225 measurements of photon numbers in various directions, at chosen angles (0.8 degrees). In each direction, a scanning was made in positions separated by a constant distance (0.080 mm). This process was repeated until a scan of 180 degrees was completed. Acquired data were proc-essed with the aid of a reconstruction software (Microvis,
EMBRAPA Instrumentation Center). The total test time for
each sample was 66 h 29 min for data acquisition and 4.5 min for image reconstruction. Typical sample sizes for CT analysis is 10-12 mm in diameter.
3. Results and Discussion
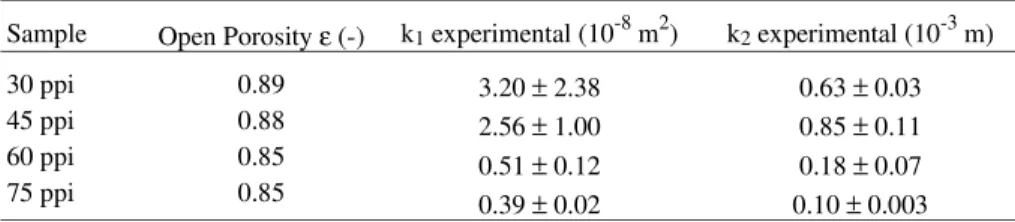
Table 1 shows experimental values of porosity and permeability constants obtained in this work. Open porosity was higher than 85% and varied only within a 4% range for all ceramic foams, what confirms that this parameter is not markedly dependent on the pore count8. Both permeability constants k1 and k2 decreased with the increase in the nominal pore count. An increase in the pore count implies that a larger number of pores is enclosed in the same space, with a resulting reduction in the cell volume and an increase in the number of struts (solid phase). The consequence is an increase in the viscous effects on the pressure drop due to the reduction in the flow channels area, which affects k1, and an increase in the medium tortuosity, which intensifies the inertial effects and reduces k21,3. The order of magnitude observed (10-8 m2 for k1 and 10-3 m for k2) is in agreement with data presented in the literature8-11.
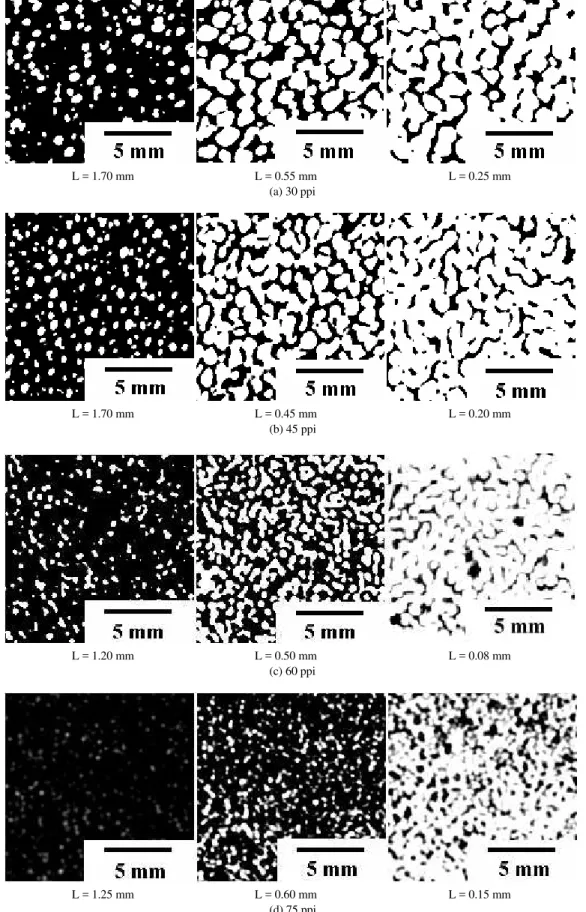
Figure 2 shows the variations in the solid-void phase patterns in the captured images as the slice thickness is increased. Only three slices of each sample are pictured, representing, however, the entire range of thickness vari-ation. Image patterns varied by two ways. Firstly, the pore size increased with the decrease in the thickness. The effect was more noticeable as the pore count decreased and re-flected the reduction of cells brought to the same plane. The visualization of a structure with larger pores allowed the capture of a larger number of cells underneath the image plane, causing a virtual reduction in the pore size.
A second effect was that the pore edges became less distinct with the decrease in the slice thickness, resulting in a coalescence of pores. The consequence was an increase in the mean pore size and a reduction in the number of pores in the image plane. While the first effect was only illusory, due to the underlying struts on the same visual plane, the latter was real and points out that pore edges of ceramic foams do not fit in single planes, but are three-dimension-ally connected in space. This trend was confirmed by the tomographic image in which practically all pores were interconnected. In this case, the slice thickness was 0.08 mm, being a good approximation for a two-dimension pore
Table 1. Experimental values of porosity and permeability constants for samples analyzed in this work.
Sample Open Porosity ε (-) k1 experimental (10-8 m2) k2 experimental (10-3 m)
30 ppi 45 ppi 60 ppi 75 ppi 0.89 0.88 0.85 0.85
3.20 ± 2.38 2.56 ± 1.00 0.51 ± 0.12 0.39 ± 0.02
Figure 2. Image patterns for ceramic foam slices of different thickness (L). ** Image obtained by tomography.
L = 1.25 mm L = 0.60 mm L = 0.15 mm (d) 75 ppi
L = 1.20 mm L = 0.50 mm L = 0.08 mm (c) 60 ppi
L = 1.70 mm L = 0.45 mm L = 0.20 mm (b) 45 ppi
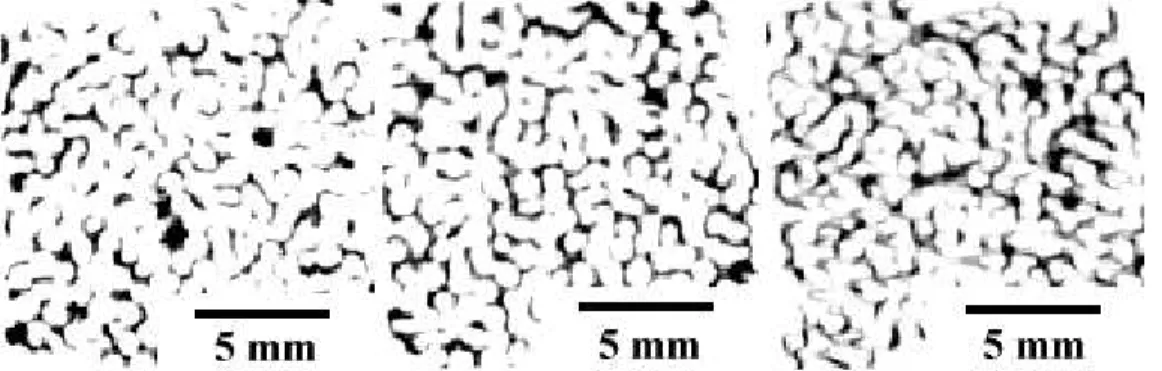
size distribution in the sample. The cellular geometry isot-ropy was verified in the very similar image patterns shown in Fig. 3, where three planes were captured using tomogra-phy in distinct depths from the same 60-ppi sample.
Although these results imply in the lack of a single value for the pore size, they reflect the complex geometry of the cellular structure and must be considered when the com-parison of pore size distributions from different image analysis conditions is intended.
Figure 4 confirms that the pore diameter increased for thinner ceramic foam slices studied in this work. For the 30-ppi sample, for instance, the mean pore size was reduced from 1.28 mm for the 0.25 mm-thick slice to 0.37 mm for the 1.70 mm-thick slice. Similar effect was observed for the 45, 60 and 75 ppi samples. Such trend was confirmed in the 60-ppi sample submitted to the tomographic image acqui-sition, yielding a 0.8 mm mean pore diameter, which was four times larger than the pore size of a 1.20 mm-thick slice. Figure 5 shows that the cross-sectional porosity de-creased as the slice thickness inde-creased. This implies that more strut intersections were optically brought to the same plane, reducing the passage of light through the pores and decreasing the visual void fraction. Porosity level was also reduced as the pore count increased from 30 to 75 ppi. An interesting feature is that in the tomographic image for the 60-ppi sample, which represented a situation with no
opti-cal strut intersection, the cross-sectional porosity was mark-edly lower (ε = 0.65) than the volumetric porosity obtained via mass/volume calculations (ε = 0.85). Concerning this discordant result, Liu et al.5 suggested that for an isotropic porous medium the porosity should be calculated as ε = (Ap/At)1.5 instead of the equation adopted in this work (ε = Ap/At). Ap would be the void fraction area and At the total cross-sectional area used for analysis. Results in this work, however, did not validate Liu’s proposal, since the porosity related to the tomographic image is further reduced to ε = 0.52 when their equation is applied.
Figure 6 displays an interesting feature not visualized in the data of Figs. 4 and 5. The pore density, i.e., the number of pores per unit area, passed through a maximum as the slice thickness increased. The effect was more no-ticeable as the nominal pore count increased from 30 to 75 ppi. For thin slices, there was a coalescence of pores due to the lack of strut intersections in the given visualized plane. This explains the decrease in the number of pores as the slice thickness decreased. As deeper struts were brought to the same optical plane, however, new pores were optically created, increasing the pore density. Beyond a critical slice thickness, the pore density was reduced again because the pores were completely clogged by the optical intersections of struts. The explanation is related with the illumination Figure 3. Image patterns obtained by tomography for three planes of a single 60-ppi sample.
Figure 4. Influence of slice thickness on the mean pore size of SiC-Al2O3 ceramic foams with 30 to 75 ppi. Circled symbol refers to the CT-image value.
conditions during image acquisition. When illumination is not directed through the sample, it is expected that after a critical thickness the image pattern stabilizes, because no more underneath layers are captured in the image. With illumination through the sample, as proceeded in this work, light must cross the sample to be captured and register the pore pattern. Therefore, the pore density pattern tends to darken until the total absence of pores, since further layers block the passage of light as the sample thickness increases. For the 75 ppi sample, for instance, the pore density was almost the same for the 0.25 mm and 1.25 mm thick slices, even though the optical pore diameter was completely different for both (0.94 mm and 0.11 mm respectively).
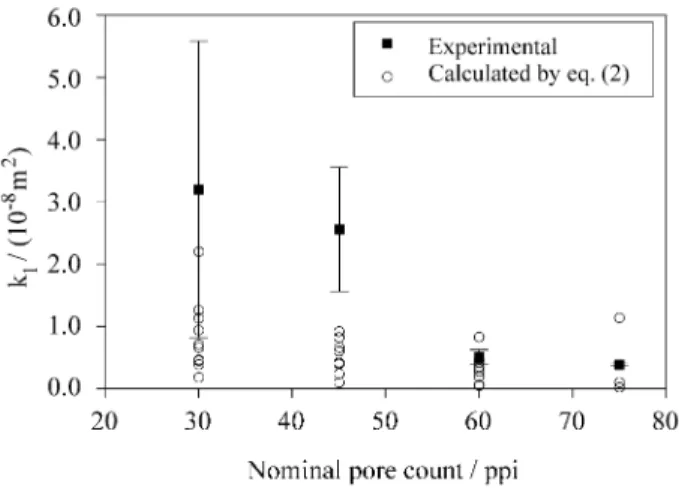
Figures 7 and 8 concern the comparison of permeability constants experimentally obtained and those calculated through Eqs. (2) and (3). It can be seen from Fig. 7 that the divergence between experimental and calculated k1 values decreased as the nominal pore count increased. The de-creasing dispersion level in the experimental values cor-roborated such trend. Since the permeability constants given by Ergun’s equations are directly dependent on the particle size dp, calculated from Eq. (7), dp in this work should be higher to reach the permeability level obtained experimentally for the 30 and 45 ppi samples. Only for the 60 and 75 ppi samples the experimental k1 value stayed within the range of calculated permeabilities. The best match for the 60 ppi sample was for the slice with thickness of 0.30 mm, which produced a mean pore size of 0.61 mm (dp = 0.16 mm).
Similar trends were observed in Fig. 8, where experi-mental and calculated values of the non-Darcian permeabil-ity k2 are plotted. In this case, however, there was a better data agreement, with exception of the 45 ppi sample, which displayed an experimental k2 value higher than that for the 30 ppi sample. As the nominal pore count increased, the smaller optical pores became progressively more repre-sentative for using in Eq. (3). The optical pore size de-creased with the slice thickness, as seen in Fig. 4, which
implied that thicker samples could be used for a reliable relationship between image analysis parameters and Er-gun’s equations. In a general way, however, it was not possible to quantify the best slice thickness for each of the 30, 45, 60 and 75 samples studied in this work.
4. Conclusions
Results discussed in this work showed that the pore size (dc) of ceramic foams obtained by image analysis was very sensitive to the cell layers captured by the image plane. Underlying pores in the image and the three-dimensional cellular arrangement were the main parameters that af-fected the pore size distribution when the sample thickness was varied. As a consequence, a single sample yielded a broad set of calculated permeabilities depending on the slice thickness analyzed.
Considering, however, that the use of Ergun’s equation as originally proposed yields errors in the prediction of permeability of granular materials as high as 50%, the introduction of pore size obtained by image analysis into the same equations seems to give fair results to assess the Figure 8. Comparison between experimental and calculated values of the non-Darcian permeability constant k2 for 30 to 75 ppi ceramic foams. Figure 7. Comparison between experimental and calculated values of the Darcian permeability constant k1 for 30 to 75 ppi ceramic foams.
permeability of ceramic foams. Because of the lack of standard conditions for image analysis in the literature, a reliable comparison among pore size values is only possible if similar patterns for image acquisition are used.
Acknowledgement
The authors are grateful to FAPESP, CNPq and AL-COA-Brazil for the support given to this work.
References
1. Innocentini, M.D.M.; Sepulveda, P.; Salvini, V.R.; Coury, J.R.; Pandolfelli, V.C. “Permeability and structure of cellular ceramics: A comparison between two preparation techniques”, J. Am. Cer. Soc., v. 81, n. 12, p. 3349, 1998.
2. Innocentini, M.D.M.; Salvini, V. R.; Coury, J.R.; Pan-dolfelli, V.C. “Assessment of Forchheimer’s equation to predict the permeability of ceramic foams”, J. Am. Cer. Soc., v. 82, n. 7, p. 1945, 1999.
3. Innocentini, M.D.M.; Pardo, A.R.F.; Salvini, V.R.; Pandolfelli, V.C, “How accurate is Darcy’s law for refractories”, Bull. Am. Cer. Soc., v. 78, n. 11, p. 64, 1999.
4. Macdonald, F.; El-Sayed, M.F.S.; Mow, K.; Dullien, F.A.L. “Flow through porous media - the Ergun equa-tion revisited”, Ind. Eng. Chem. Fundam., v. 18, n. 3, p. 199, 1979.
5. Liu, S.; Afacan, A.; Masliyah, J. “Steady incompress-ible laminar flow in porous media”, Chem. Eng. Sci-ence, v. 49, n. 21, p. 3565, 1994.
6. Du Plessis, J.P.; Masliyah, J.H. “Flow Through Iso-tropic Granular Porous Media”, Transport in Porous Media, v. 6, p. 207, 1991.
7. Ergun, S. “Flow through packed columns”, Chem. Eng. Progress., v. 48, n. 2, p. 89, 1952.
8. Innocentini, M.D.M.; Salvini, V.R.; Coury, J.R.; Pan-dolfelli, V.C., “The permeability of ceramic foams”,
Bull. Am. Cer. Soc., v. 78, n. 9, p. 78, 1999.
9. Acosta, F.A.; Castillejos, A.H.; Almanza, J.M.; Flo-res, A., “Analysis of liquid flow through ceramic porous media used for metal filtration”, Metallurgical
and Materials Transactions B, v. 26B, p. 159, 1995.
10. Philipse, A.P.; Schram, H.L. “Non-Darcian airflow through ceramic foams”, J. Am. Cer. Soc., v. 74, n. 4, p. 728, 1991.
11. Twigg, M.V.; Richardson, J.T. “Preparation and prop-erties of ceramic foam catalyst supports”, Studies in
Surface Science and Catalysis, v. 91, p. 345, 1995.
12. Bird, R.B.; Stewart, W.E; Lightfoot, E.N. Transport
Phenomena, John Wiley & Sons, Singapore, 780 p.,
1976.