INTRODUCTION
Potteries are the most abundant fi ndings among the archeological artifacts. Pottery analysis reveals information regarding the daily life and cultural aspects of the society of the ancient period [1]. The mineralogical composition of the pottery strongly related to the source of clay, fi ring temperature, duration of fi ring, kiln condition and technical skill of the potter. So, it is necessary to asses the mineralogical composition to answer the technological issues of pottery fabrication [2].
The scientific investigation using spectroscopic techniques greatly contributes the archaeology providing definite and undoubted data about materials and production aspects of potteries. The identifi cation of fi ring minerals is an essential requirement for the elucidation of fi ring temperature of potteries. The knowledge of fi ring temperature and condition of fi ring offer us better understanding of the civilization that created potteries and provide us the information for conservation and restoration of techniques [3]. A thermal transformation in constituent clay mineral is considered irreversible. The change in the mineral composition will be observed only if the shred fi red above its original temperature applied by the potter. This is the key factor for the investigation of ancient potteries [4]. By analyzing the mineral trapped in the sample can elucidate
its fi ring temperature. On fi ring the pottery to get a fi nal products, thermal changes occurred in the clay structure and bonding of clay minerals can be evaluated from FTIR spectral characteristics. The usefulness of IR spectroscopy in characterizing archeological pottery lies primarily in its ability to provide a fi ngerprint spectral pattern that can be readily associated with the mineralogical constituents of samples. Every mineral of importance to pottery study has its infrared spectra characterized. The presence and absence of fi ring minerals in the ancient pottery play a vital role in the estimation of fi ring temperature [5]. Besides FTIR study, XRD was also recorded for the samples to cross check the sample mineralogy. The FTIR can yield diagnostic ‘fi ngerprint’ of minerals, while the XRD provides critical information on the actual minerals present in the samples. X-ray power diffraction is the complementary spectroscopic analytical tool for the mineral characterization of potteries and to know the composition of the crystallographic phases which are yielding information relevant to their provenance [6-8]. The minerals hematite, calcite, kaolinite, feldspar are unambiguously characterized by diffractograms. To understand the fi ring process adopted and the fi ring temperature achieved, it becomes necessary to investigate thoroughly the characteristic features of thermally induced mineral transformation, such as destruction and transformation of fi ring minerals upon fi ring [9, 10].
The mineralogical and fabric analysis of ancient pottery artifacts
(Análise mineralógica de fragmentos de peças cerâmicas antigas)
R. Palanivel, U. Rajesh Kumar
Department of Physics, Annamalai University, Annamalainagar, Tamilnadu - 608002, India
Abstract
The present investigation is carried out to estimate the fi ring temperature and conditions of fi ring of ancient pottery shreds excavated recently from Sembiankandiyur, Tamil Nadu, India. FTIR and XRD studies have been attempted on these shreds to characterize the mineral composition of the pottery artifacts in respect of their different physical attributes. The fi ring temperature and conditions were inferred from the mineral phases of the samples exhibited by the infrared spectra and X-ray diffractograms recorded in as received state. TG-DTA is the complementary technique to elucidate the fi ring temperature from the thermal characteristic reactions such as dehydration, decomposition and transformations of minerals under the controlled fi ring of the samples in inert atmosphere.
Keywords: artifacts, fi ring temperature, FTIR, mineral transformation, pottery shred, TG-DTA, XRD.
Resumo
Esta pesquisa foi feita para se estimar a temperatura de queima e as condições de queima de fragmentos cerâmicos antigos escavados recentemente em Sembiankandiyur, Tamil Nadu, India. Estudos de FTIR e de difração de raios X foram efetuados nestas partes para caracterizar a composição do mineral dos artefatos cerâmicos com respeito aos diferentes atributos físicos cerâmicos. A temperatura e as condições de queima foram estimadas a partir das fases minerais das amostras de acordo com os espectros de infravermelho e dos difratogramas de raios X obtidos nas amostras como recebidas. Análise termogravimétrica e térmica diferencial é uma técnica complementar para avaliar a temperatura de queima a partir de reações características tais como hidratação, decomposição e transformações dos minerais sob queima controlada das amostras em atmosfera inerte.
Thermal analysis is an adequate tool for analyzing ancient pottery. It allows one to control the process of fi ring and record variations due to the thermal process simultaneously [11]. DTA curves enable detection of exo and endothermic peaks due to the effects of gain/loss of enthalpy occurring in the sample when undergoing controlled heating. Thermal analysis in conjunction with FTIR and XRD provide information for estimating of the fi ring temperature of the ancient pottery as evidenced from the studies done by the earlier investigations [12].
Excavation site
The excavation site Sembiankandiyur is located in the Nagappatinum district between northern latitude 11.0851º and eastern longitude 79.8545º, Tamilnadu, India. The archeological excavation was performed under the superintendence of state Archeology Department, Tamilnadu in May 2008 [13]. Numerous pot shreds with varied size and style were recovered in a trench of dimension 4 by 4 meter and depth of 1.6 m from the surface at the site location. The artifacts recovered were treated conventionally for removing the dirt and stain and categorized. Fifteen samples were selected at random with the courtesy of State Archeology Department, Tamilnadu. Out of fi fteen three shreds were taken as representative samples for the present study by designating them arbitrarily as SKM 1, SKM 2 and SKM 3. The geographical location of the excavation site is given in Fig. 1.
Visual characteristics of samples
The macroscopic view of specimens named as SKM1, SKM2 and SKM3 are shown in Fig. 2. The shreds are
appearing distinctly to each other in respect of color, glaze and thickness. The pot shred SKM1 is thick walled red coarse ware, probably hand made as the fi nger impressions are appearing on its surface. The cross section of the fractured shred SKM1 shows that the margins are red with sandwiching grey core. The sample SKM2 is red glazed ware, polished on both inner and outer surfaces. The samples SKM3 is a polished black colored shred.
EXPERIMENTAL DETAILS
FTIR spectrometry
The infrared spectra were recorded in the mid IR region 4000-400 cm-1 using Perkin Elmer FTIR interferometer in Centralized Instrumentation Sophisticated Laboratory (CISL), Annamali University. The KBr pressed pellet technique was used by mixing the powdered samples with KBr in weight proportion of 1: 20. The precision of the FTIR instrument is ± 4 cm-1 in 4000 to 2000 cm-1 region and ± 2 cm-1 between 2000 and 400 cm-1.
X-ray diffractometry
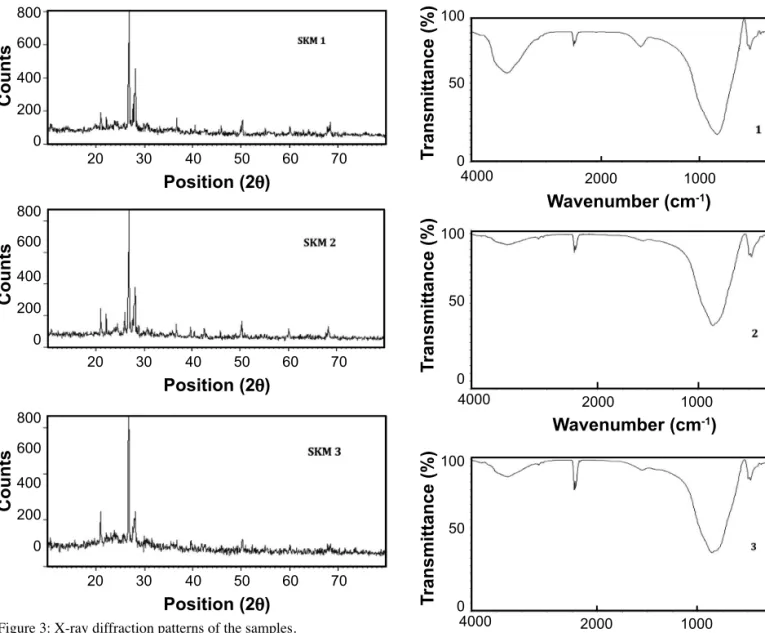
As supplementary investigation to support the results revealed in the FTIR analysis, the X-ray diffractograms for the representative shreds were recorded in Pan Analytical Xpert-Pro with PW3050/60 goniometer in the research laboratory of Physics Department, Alagappa University, Karaikudi, Tamilnadu, India, by operating at 30 kV and 20 mA with Cukα radiation. The diffraction patterns for all the samples were obtained by continuous scanning 2θ from 10.027 to 79.9251 (Fig. 3).
Thermogravimetric analysis
As the thermogravimetric analysis has gained wide analytical acceptance in recent years for compositional analysis, TG-DTA study was carried out for the samples SKM1, SKM2 and SKM3 in SDT Q-600-V.8.3 thermal analyzer in Central Electro Chemical Research Laboratory, Figure 1: Geographical map of the excavation site, Sembiankandiyur.
[Figura 1: Mapa geográfico do local de escavação, Sembiankandiyur.]
Figure 2: Photograph of the samples.
Karaikudi, India. The experiment was carried out by heating the samples from 30 to 1200° C at 10° C.min-1 with fl ow of high purity nitrogen.
RESULTS AND DISCUSSION
FTIR analysis
The FTIR spectra of SKM1, SKM2 and SKM3 are shown in Fig. 4.
Each FTIR spectrum has run on average of 200 scans with the specifi c precision in the region of the spectrum. The peak positions of various bands of varied intensity observed in these spectra along with their tentative assignments are given in Table I. It have stated earlier on the IR analysis of archeological artifacts that the absorption band at 1639 cm-1 is due to the H-O-H bending of water molecule [14]. A medium absorption band appearing at 1632 cm-1 is due to H-O-H bending of water exists in all samples owing to the absorption of moisture present in the sample. The presence of strong intensity peak at 1085 cm-1 in the spectra of SKM2 and SKM3 is the evidence that wollasonite is present in the
composition of the shreds, but the absence of corresponding band in the shred SKM1 is reveals that the shred has no wollastonite in its composition [15, 16]. The peak around 1034 cm-1 is the result of the red clay origin of kaolinite [14]. The spectrum of SKM1 has a peak centered at 1040 cm-1 with strong intensity. It indicates the red clay origin of kaolinite present in the clay of the pottery shred SKM1. The absence of corresponding band in SKM2 and SKM3 determines that these shreds are of different origin referring the SKM1. The appearance of absorption at 795 cm-1 and 695 cm-1 indicates the quartz presence in accordance with the results of earlier researchers in the similar studies [14]. The absorption band appearing at 668 cm-1 is due to the presence of anorthite [17]. The shred SKM1 exhibited a weak intensity peak at 668 cm-1 due to clay mineral anorthite and the absence of corresponding peak in SKM2 and SKM3 affi rms that the SKM2 and SKM3 are not having anorthite and have different composition with respect to SKM1. The absorptions around 580 and 540 cm-1 are due to magnetite and hematite respectively [18, 19]. The absorptions observed
20
20
20
Counts
Counts
Counts
Position (2θ)
Position (2θ)
Position (2θ) 800
800
800 600
600
600 400
400
400 200
200
200 0
0
0
40
40
40
60
60
60 30
30
30
50
50
50
70
70
70
Figure 3: X-ray diffraction patterns of the samples.
[Figura 3: Difratogramas de raios X das amostras.]
Figure 4: FTIR spectra of samples SKM1, SKM2 and SKM3.
[Figura 4: Espectros FTIR das amostras SKM1, SKM2 e SKM3.] 4000
4000
4000
Wavenumber (cm-1)
Wavenumber (cm-1)
Wavenumber (cm-1)
T
ransmittance (%)
T
ransmittance (%)
T
ransmittance (%)
100
100
100 0
0
0 50
50
50
2000
2000
2000
1000
1000
1000
400
400
at 581 cm-1 and 535 cm-1 in SKM1, 583 cm-1 and 535 cm-1 in SKM2 are attributed to the magnetite and hematite present in the samples respectively. But the band present at 535 cm-1 in SKM1 and SKM2 does not appear in SKM 3. Therefore it is understood that SKM3 has no hematite in its composition. The formations of magnetite and hematite depend on the fi ring atmosphere prevalent at the time of manufacture. The presence of weak intensity peak due to magnetite refers the transformation of Fe3O4 to Fe2O3 during the fi ring process. The hematite peak at 535 cm-1 in the samples SKM1 and SKM2 implies that the potteries were fi red in an oxidizing condition (18, 19). The absence of hematite band in SKM3 indicates that the fi ring condition achieved may be a reduced atmosphere for the sample SKM3. So it is inferred that the artisans of Sembiankandiyur were well aware of technique of fi ring the potteries in both oxidizing and reducing atmosphere. The absorption band in all the samples around 465 cm-1 is assigned to the presence of clay mineral microcline, referring the studies on fi red clay artifacts [16, 20].
The fi ring temperature of potteries
The decomposition of kaolinite and formation of meta kaolinite occurs around 500 to 650 °C [21, 22]. The appearance of kaolinite in SKM1 suggests that the fi ring temperature was not high enough to complete the decomposition of this mineral indicating that the fi ring did not exceed 650° C. The IR absorption band at 915 cm-1
is due to Al(OH) vibrations in octahedral sheet structure which begins to disappear at the temperature 500 °C [23]. The shreds in the present study have no band at 915 cm-1. So it is viable to understand that all the samples were fi red above 500 °C. The presence of kaolinite and the absence of Al (OH) vibrations in the spectrum of pottery SKM1 show that its fi ring temperature lies between 500 and 650 °C. See Table II.
Thermal analysis
The TG and DTA curves are shown in Figs. 5.1 to 5.3 respectively for the shreds individually. The DTA curve for each sample shows both exothermic and endothermic peak at different temperatures due to distinct nature and composition. The endothermic peak around 100 to 200 °C is due to the hygroscopic water [12, 28]. For SKM2 an endothermic peak due to hygroscopic water molecules Peak position wavenumber (cm-1) Tentative
Vibrational Assignment
SKM 1 SKM 2 SKM 3
3422 S 3421 W 3421 W O-H stretching
1647 W 1639 VW 1639 VW H-O-H bending of water --- 1085 VS 1085 VS Wollasomite
1040 VS --- --- Kaolinite
795 W 796 W 796 W Si-O quartz
778 W 778 W 778 W Si-O quartz
694 VW 696 VW 696 VW Si-O quartz
668 VW --- --- Anorthite
639 VW --- --- Si-O-Si bending
gehelanite 581 VW 583 VW 583VW Fe-O of magnetite 535 VW 535 VW --- Fe-O of hematite
517 VW --- --- Fe-O of hematite
465 S 464 M 464 M Microcline
Table I - FTIR Vibrational Assignments of the pottery artifacts.
[Tabela I - Atribuições às vibrações medidas por FTIR nos artefatos cerâmicos.]
VS: Very Strong; S: Strong; M: Medium; W: Weak; VW: Very Weak.
Minerals identifi ed Condition
of fi ring
Firing temperature
FTIR XRD
Anorthite Anorthite
Oxidizing 500-650 º C Feldspar
Gehelanite
Hematite Hematite Kaolinite Kaolinite Magnetite Magnetite
Muscovite Microcline
Quartz Quartz Anorthite
Feldspar Wollastonite
Gehelanite
Oxidizing 800-900 º C Hematite Hematite
Magnetite Magnetite Muscovite Microcline
Quartz Quartz Feldspar
Reducing 800-900 º C Wollastonite
Gehelanite
Magnetite Magnetite Microcline
Quartz Quartz Wollastonite
Table II - Mineral phases obtained by FTIR and XRD analyses.
[Tabela II - Fases minerais obtidas por análises FTIR e DRX.]
SKM 3
SKM 2
Sample
was observed between 30 and 250 °C, whereas for SKM1 and SKM3 an exothermic peak was observed between 30 and 100 °C, indicating the absence of hygroscopic water. The exothermic peak between 200 and 500 °C is due to the combustion of organic material present in the sample. A broad exothermic peak appeared between 205 and 500 °C in SKM2 is due to the combustion of organic material and this peak was not present in SKM1 and SKM3. So the shred SKM2 has some organic material associated with the clay of the shred [12]. The organic material might be added intestinally as a binder in the preparation of pottery or the raw material itself has contained organic material [28]. The endothermic peak appearing between at 450 to 650 °C is due to the dehydroxylation of kaolinite [28, 29].
In SKM1 the presence of kaolinite is well evidenced by endotherm between 453 and 650° C. It indicates that the kaolanite mineral has survived in the fi ring process applied by the ancient potter. The presence of dehydroxylation kaolinite peak is the indication that the pottery is not fi red above 650 °C [12]. Therefore, the shred SKM1 would have been fi red between 450 and 650 °C. But the absence of the corresponding endothermic peak, both in SKM2 and SKM3 between 450 and 650 °C, infers that shreds were fi red at temperature above 650 °C. Thus the thermographical result is in agreement with the spectral data obtained in the earlier parts of the study using FTIR and XRD techniques. A broad endotherm around 1000 to 1500 °C is present in all the samples. The endothermic peak around 1150 °C is due to the presence of crystalline phase, which undergo polymeric transformation around this temperature [30]. The absence of exothermic peak between 900 and 1000 °C on the fi red clay products stands for evidence that products were not fi red above the higher limit of the temperature [12]. As no samples of the study has exothermic peak between 900 and 1000 °C gave a clue that all the samples were fi red below 900 °C. The absence of dehydroxylation peak due to kaolinite and exothermic peak around 650 °C in SKM2 and SKM3 indicate that these two samples would have been fi red between 650 and 900 °C as revealed in FTIR study.
In the thermogravimetry analysis the weight loss observed on the pottery samples can be explained in three steps [11]: the dehydration (room temperature to 100 °C), decomposition of hydroxyls (400-500 °C), and decomposition of carbonates, mainly calcite (700-800 °C).
Data on the thermal decomposition of three samples are summarized in Table III. The mass loss on temperature intervals is not uniform in the samples of the study in mineral composition of pottery shreds. For all the shreds mass loss in dehydration is larger then the loss in dehydroxylation. The weight loss due to dehydration of water 5.63%, 1.83% and 8.69% for the shreds SKM1, SKM2 and SKM3, respectively. But the weight loss due decomposition of hydroxyls is not showing any variations relatively. No sample showed weight loss due to decomposition of calcite [11]. The calcite decomposes in between the temperature 700-800 °C. The absence of thermogravimetric evidence of calcite between 700 and 800 °C is supporting the results of the XRD and FTIR analysis done in the present study. The shred SKM1 showed gradual weight loss from 50 to 495 °C, the weight loss in this region is 8.53% and it is due to loss of moisture water and loss of water from iron hydroxyls, which has been identifi ed through the endothermic peak in DTA appeared between 150 and 350 ºC [28]. The total weight loss in SKM1 up to 1200 °C is 13.58%. The higher weight loss observed in SKM2 is between 50 and 650 °C. This weight loss may be due to dehydration and be accompanied combustion of organic materials. The weight loss due to organic material is 3.80%. The total weight loss through the entire thermal analysis is 11.65%. In shred SKM3 the total weight loss is 18.05%, the maximum weight loss is occurred in the region of temperature 50-500 °C of about 15.96%.
Figure 5: TG-DTA curves of the samples.
[Figura 5: Curvas ATG-ATD das amostras.]
100 1.2
95
1.0
90
0.8
85
0.6
0.4
0.2
0.0
0 200 400 600 800 1000 1200
Temperature (ºC)
W
eight (%) ΔT (ºC)
100 0.2
95
0.0
0.2 0.4 0.6
0.8
1.0 90
85 0
0 200 400 600 800 1000 1200
Temperature (ºC)
W
eight (%) ΔT (ºC)
100 2.5
95
2.0
90
1.5
85
1.0
80
0.5
0
0 200 400 600 800 1000 1200
Temperature (ºC)
W
CONCLUSIONS
Spectroscopic techniques FTIR and XRD together with thermal analysis TG-DTA on the ancient pottery artifacts of the present investigation address their characteristic evidence in establishing the technological issues related to the mineralogical compositions, fi ring temperature and
fi ring atmosphere respectively. The results obtained are complimentary in nature. From FTIR and TG-DTA analysis, it is inferred that the sample SKM1 was fi red between 650 and 750 °C and the shreds SKM2 and SKM3 were fi red between 850 and 950 °C.
ACKNOWLEDGEMENTS
The authors would like to thank The State Archeology Department, Tamil Nadu for providing the pottery samples. We are grateful to Dr. A.N. Kanappan, The Head, Department of physics, Annamalai University for his constant support and encouragement. We thank The Head, School of Physics, Alagappa University for allowing to record XRD in his laboratory and also we wish to thank The Director, CECRI, Karaikudi for allowing to record TG-DTA.
REFERENCES
[1] A. Merkevicius, P. Bezdicka, R. Juskenas, J. Kiuberis, J. Senvaitiene, I. Pakutinskiene, A. Kareiva, Chemija 18 (2007) 36.
[2] J. M. Bhatnaga, R. K . Geol, Const. Mat. 16 (2002) 113. [3] U. Wagner, R. Gebhard, W. Hausler, T. Hutzelmenn, J. Reidere, I. Shimada, J. Sosa, F. E. Wagner, Hyper. Inter. 122 (1999) 163.
[4] C. Manoharan, R. Venkatachalapathy, S. Danapandian, K. Deenadayalan, Ind. J. Pure & Appl. Phys. 45 (2007) 860. [5] A. Ciancio, A. Dell Anna, R. Laviano, Indagini, “Chimico-mineralogiche su ceramica a pasta grigia proveniente dalla Puglia centrale”, Ceramica Romanae Archeometria: Lo Stato Delgli Studi, Edi all Insegna del Giglio, Firenze, Italy (1994) p. 353.
[6] G. Rapp Jr., “The provenance of artifi cial raw materials”, in Gifford (Eds.), Archeological Geology, Yale University Press, New Haven, USA (1985) p. 353.
[7] R. L. Bishop, R. L. Rands, G. R. Holley, “Ceramic compositional analysis in archeological perspective”, Ed. M. B. Schiffer, Advances in Archeological Method and Theory, Academic Press, New York, USA, 5 (1982) p. 275. [8] C. Ionescu, L. Ghergari, M. Horga. G. Radulescu, Geologia 52 (2007) 29.
[9] J. Froh, Hyper. Inter. 154 (2004) 159.
[10] L. Bellavia, “Archeological excavation of ancient Roman pottery from Palazzaccio, Italy, and analysis by Mossbauer spectroscopy and X-ray diffraction”, Proc. Nat. Conf. Undergrad. Res. (NCUR), The University of Carolina, Asheville, North Carolina, USA (2006) pp. 2123-2128. [11] V. A. Drebushchak, L. N. Mylnikova, T. N. Drebushchak, V. V. Boldyrev, J. Therm. Anal & Calorim. 82 (2005) 617. [12] G. Clark, B. F. Leach. S. O’Conner (Ed.), “Islands of Inquiry: Colonization, Seafaring and the Archeology of Maritime Landscape papers in honor of Atholl Anderson, Terra Australia”, Australian Nat. Univ. Press (2008) p. 435. [13] From Indus Valley to Coastal Tamil Nadu, The Hindu, Daily Magazine (May 03, 2008).
[14] R. Palanivel, G. Velraj, Ind. J. Pure & Appl. Phys. 45 (2007) 501.
[15] E. Dowty, Phys. Chem. Min. 14 (1987) 122.
[16] M. S. Rutstein,W. B. White, Am. Miner. 56 (1971) 877. [17] S. W. Kieffer, Rev. Geophys. Space Phys. 17 (1979) 20. [18] G. Velraj, K. Janaki, A. Mohamed Musthafa, R. Palanivel, Appl. Clay. Sci. 43 (2009) 303.
[19] G. Velraj, K. Janaki, A. Mohamed Musthafa, R. Palanivel, Spectrochim. Acta 72A, 4 (2009) 730.
[20] V. C. Farmer, Infrared spectra of minerals, Mineralogical Society, London, UK (1974).
[21] A. Chakchouk, L. Trifi , B. Samet, S. Bouaziz, Cons. Build. Mater. 23 (2009) 1365.
[22] S. Shoval, Opt. Mater. 24 (2003) 117.
[23] K. Ramasamy, M. Kamalakannan, Ind. J. Pure & App. Phys. 25 (1987) 284.
[24] L. Martin, C. Mazzoli, L. Nodari, U. Russo, Appl. Clay. Sci. 29 (2005) 31.
[25] D. Barilaro, G. Barone, V. Crupi, D. Majolino, P. Mazzoleni, G. Tigano, V. Venuti, Vib. Spectr. 48 (2008) 269. [26] A. Iordanidis, J. G. Guinea, G. K. Mentessidi, Mater. Charact. 60, 4 (2009) 292.
[27] U. Schwertmann, J. M. Bigham, E. J. Ciokosz (Eds.), Table III - Weight losses from thermogravimetric curves of the samples.
[Tabela III - Perdas de peso nas curvas termogravimétricas das amostras.]
Shred
Weight loss (%)
weight loss (%)
Residual mass
(%)
Total weight
loss (%) Dehydration
(room temperature to 200° C)
Decomposition of hydroxyls (400-650° C)
Decomposition of calcite (700-800° C)
SKM 1 5.63 1.11 0.2 (50-495°C)- 8.78 86.42 13.58
SKM 2 1.38 1.31 0.11 (50-650°C)- 8.8 88.35 11.65
Soil Color, Soil Society of American Special Publication, Madison, Wisconsin, USA (1993) p. 31.
[28] A. Moropoulou, A. Bakolas, K. Bisbikou, Thermochim. Acta 269-270 (1995) 743.
[29] M. Hajjaji, S. Kacim, M. Boulmane, Appl. Clay Sci. 21 (2002) 203.
[30] A. Krapukaityte, S. Tautkus, A. Kareiva, E. Zelickiene, Chemija 19 (2008) 4.