*e-mail: [email protected]
Electrochemical Behavior of Ti and Ti6Al4V in Aqueous
Solutions of Citric Acid containing Halides
Anelise Marlene Schmidta, Denise Schermann Azambujab*
a
Universidade Regional do Noroeste do Estado do RS – UNIJUÍ, Ijuí - RS, Brazil
bLaboratório de Eletroquímica, Instituto de Química,
Universidade Federal do Rio Grande do Sul, 91501-970 Porto Alegre - RS, Brazil
Received: April 20, 2006; Revised: November 23, 2006
This paper reports on an investigation of the electrochemical behavior of Ti grade 2 and Ti6Al4V alloy in aqueous citric acid solutions with pH 2.0 containing halide ions. Voltammetric studies of Ti and the alloy in citric acid, with and without chloride ions, indicate that the Ti and Ti alloy presented a passive behavior in the test solutions used. Pitting was observed at 3.0 and 2.5 V/SCE for Ti and Ti6Al4V, respectively, when bromide ions were added to the solution. In solutions containing fluoride ions, dissolution of the film occurred at potentials close to - 1.0 V/SCE in both electrodes. The iodide ions oxidized on the passive oxide film at potentials close to 1.0 V/SCE. EIS results of the materials in citric acid solutions containing chloride ions revealed that the film’s resistance increased as the applied potential rose from 0 to 1.0 V. In bromide-containing solutions, breakdown of the film was confirmed at potentials above 2.0 V/SCE in both electrodes. These results suggest film reformation for Ti and the alloy in solutions containing fluoride at potentials within the passive region.
Keywords: Ti, Ti6Al4V, citric acid, halide ions
1. Introduction
Ti and its alloys are widely used in medicine, dentistry and aero-nautical applications. The high corrosion resistance of these materials in many aggressive media is due to the formation of a thin passive and compact TiO2 film on their surface upon exposure to air.
According to the literature, Ti-based alloys are usually very re-sistant to some organic acids, e.g., acetic and lactic acid, but can be corroded by others such as formic acid and citric acid1-3. However,
aerated solutions often suffice to inhibit corrosion of unalloyed Ti in the stronger organic acids, such as formic, lactic and citric1.
Ti shows marked resistance to corrosion and pitting in seawater and oxidizing chloride solutions, but poor resistance in reducing mineral acids such as HCl3-7. Pitting can be observed on Ti surfaces
under anodic polarization in bromide containing aqueous solutions, mainly in HBr media8-11.
Among halides, fluoride ions are the ones most strongly adsorbed on Ti surfaces, causing dissolution of the film even under open circuit potential conditions1. Hydrofluoric acid solutions can aggressively
attack Ti alloys over a full range of concentrations because fluoride ions form highly stable and soluble complexes with Ti3+. According to
Strietzel3, fluoride ions in organic acids with 2.1 < pH < 3.8 can react
with Ti surfaces. Frateur et al.12 observed some pitting on Ti in acidic
fluoride media (pH 2.0 and 3.0). Reclaru and Meyer13 showed that
crevice corrosion and pitting occur on Ti alloys in a fluoride containing NaCl solution with pH below 3.5. Furthermore, Schiff14 found pitting
of Ti6Al4V alloy in fluoridated acidified saliva (pH 2.5).
The literature contains several reports of the corrosive behavior of Ti and its alloys in different media containing halide ions. However, to the best of our knowledge, very few investigations have focused on the influence of these ions in citric acid media. Citric acid is usually a constituent of fruits and some industrialized foods that are in contact with metallic implants of Ti alloys, so it is important to investigate the corrosive behavior of these alloys in these types of electrolyte. Therefore, this investigation focused on the electrochemical behavior
of Ti and Ti6Al4V alloy in an aqueous citric acid solution (pH 2.0) containing halide ions, based on corrosion potential measurements, cyclic voltammetry and electrochemical impedance spectroscopy studies.
2. Experimental
Electrochemical experiments were conducted with a three-elec-trode cell. The working electhree-elec-trodes were Ti grade 2 and Ti6Al4V (Table 1) rods inserted in a Teflon holder with exposed areas of 0.0177 cm2 and 0.0314 cm2, respectively. These electrodes were
polished with grade 600 emery paper, degreased with acetone and rinsed in double distilled water prior to the electrochemical tests. The reference electrode was the saturated calomel electrode (SCE) to which all potentials were referred and a platinum wire was used as the counter electrode.
The measurements were taken using 0.1 mol/L aqueous citric acid solutions with a pH of 2.0. A concentration of 0.1 mol/L of NaBr, NaCl, NaI and NaF was added to the solution to investigate the effect of halides under aerated conditions and at room tempera-ture (± 20 °C).
SEM micrographs of the Ti6Al4V rods were obtained by scanning electron microscopy using a JEOL JSM5800 microscope.
Electrochemical measurements were taken with an AUTOLAB PGSTAT 30/FRA 2, and the electrochemical impedance spectroscopy (EIS) assays were carried out in the 10 kHz - 10 mHz frequency range with a sinusoidal voltage amplitude of 10 mV. Voltammetric curves were obtained in the same device. Each experiment was repeated three times to ensure its reproducibility.
3. Results and Discussion
Table 1. Composition/wt. (%) of Ti and Ti6Al4V alloy (maximum values).
Sample N C H Fe O Al V
Ti grade 2 0.03 0.10 0.015 0.30 0.25 -
-Ti6Al4V 0.05 0.10 0.0125 0.40 0.20 5.5-6.5 3.5-4.5
0.0
- 0.2
- 0.4
- 0.6
- 0.8
- 1.0 Ecorr
/
V
x
SCE
0 10 20 30 40 50 60
Time (min)
Figure 1. Ecorr variation of Ti6Al4V alloy as a function of immersion time in citric acid (■), containing bromide (●), chloride (▲), fluoride (▼) and iodide (◆) ions.
The Ecorr in citric acid was found to increase during the first 5 minutes and was located in the passive region in relation to an oxide film formed on the metal surface15. The addition of bromide, chloride and
iodide ions to the citric acid did not affect the passivity of the alloy. In the fluoride ions containing citric acid, the Ecorr shifted from - 0.5 V to - 1.0 V in the first 5 minutes and increased to close to - 0.9 V, remaining at this potential after one hour of immersion, indicating that the primary oxide film formed on the metal surface was dissolved by fluoride ions. The same behavior was observed for Ti (data not shown). According to the literature13,16, TiO
2 dissolves in HF with
[TiF6]2- ion formation at potentials close to - 1.0 V.
The voltammetric curves obtained for Ti and Ti6Al4V in citric acid, between - 1.0 and 4.0 V, at 0.02 Vs-1 (Figure 2), reveal a passive
behavior as well as a region with a practically constant current, indi-cating the film’s growth. This behavior indicates that the thickness of the anodic oxide film increased linearly with the applied potential17,18.
The current increase to above 3.0 V had to do with the additional oxidation of Ti to the yellow peroxide TiO315. In fact, a yellowish
film was visible on the electrodes’ surfaces after the voltammetric experiments. The reverse scan showed a small cathodic peak close to - 0.8 V, probably related to a partial reduction process of the film, which is congruous with previous works17-19.
No changes were visible in the voltammetric curves for Ti and Ti6Al4V obtained in chloride containing citric acid, indicating the absence of corrosion, which is in a good agreement with the findings of other authors5-7.
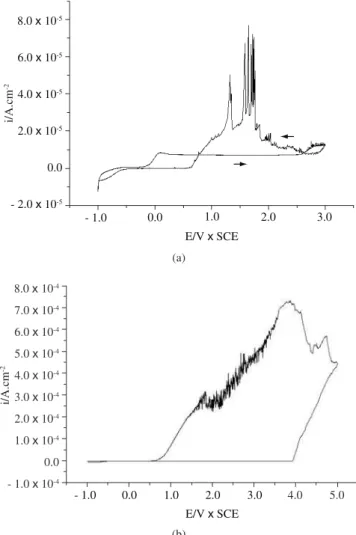
The effect of bromide ions on the voltammetric curve between - 1.0 and 4.0 V, at 0.05 Vs-1, which was obtained for the alloy in citric
acid, shows the active-passive peak at close to 0 V, followed by the constant current region up to 2.5 V (Figure 3a). Above this potential the current increased, showing an oscillatory behavior up to 3.0 V and indicating breakdown of the film and pitting. The oscillations were still visible in the reverse scan down to 0.5 V. Under this potential, the current decreased again, indicating repassivation of the film. It has been proposed that the breakdown of the titanium oxide film in bromide media occurs in microscope active sites at potentials above
- 1.0 0.0 1.0 2.0 3.0 4.0
E/Vx SCE
i/A.cm
-2
4.0x 10⁻⁴
2.0x 10⁻⁴
0.0
- 2.0 x 10⁻⁴
- 4.0 x 10⁻⁴
- 6.0 x 10⁻⁴
- 8.0 x 10⁻⁴
Figure 2. Voltammetric curves of Ti (—) and Ti6Al4V (…) in citric acid, between - 1.0 and 4.0 V at 0.02 Vs-1.
Figure 3. Voltammetric curves in the bromide-containing citric acid at 0.05 Vs-1; a) Ti6Al4V (- 1.0 to 4.0 V); and b) Ti (- 1.0 to 5.0 V).
i/A.cm
-2
8.0x10⁻⁵
6.0x 10⁻⁵
4.0x 10⁻⁵
2.0x 10⁻⁵
0.0
- 2.0 x 10⁻⁵
- 1.0 0.0 1.0 2.0 3.0
E/Vx SCE
(a)
i/A.cm
-2
8.0x10⁻⁴
7.0x 10⁻⁴
6.0x 10⁻⁴
5.0x 10⁻⁴
4.0x 10⁻⁴
3.0x 10⁻⁴
2.0x 10⁻⁴
1.0x 10⁻⁴
0.0
- 1.0 x 10⁻⁴
- 1.0 0.0 1.0 2.0 3.0
E/Vx SCE
4.0 5.0
(b)
3.0 V, according to a mechanism whereby the bromide ion is adsorbed on the film’s surface10,11.
same oscillatory behavior down to 0.8 V. These results indicate that the pitting process for the alloy in bromide media occurs at poten-tials lower than those for Ti, which is in a good agreement with a previous work8.
Several micrographs were taken of the Ti6Al4V alloy after po-larization from - 1.0 to 4.0 V, showing pits containing precipitates (Figure 4). According to other authors, this could be due to the pre-cipitation of TiBr4 film inside the pits9-11. Further studies are needed
to investigate this supposition.
Figure 5 shows the voltammetric curve of Ti obtained between - 1.0 and 4.0 V at 0.02 Vs-1 in iodide-containing citric acid solution.
Two anodic peaks are visible at - 0.2 and 1.0 V, the first one resulting from the formation of a passive oxide film and the second probably relating to oxidation of the iodide ion on the passive oxide film. It is well known that iodide ions can oxidize on Ti surfaces, a behavior that has been ascribed to the semi-conducting properties of TiO2
film18,20. A similar voltammogram was obtained for the alloy in the
same solution.
Figure 6 shows the effect of the fluoride ions on the voltammetric curve of Ti in citric acid at 0.05 Vs-1. Note the anodic peak around
- 0.8 V, followed by a region of practically constant current. These features indicate that the fluoride ions dissolved the primary oxide film, while the region of constant current suggests a tendency for surface passivation. However, the anodic reactivation peak in the reverse scan indicates that the film remained unstable and probably contained pores on its surface. The Ti6Al4V presented the same be-havior under the same conditions. Similar polarization curves have been reported for Ti and its alloys in fluoride containing artificial saliva with pH < 4.013,14,21.
3.1. EIS studies
The EIS measurements of Ti grade 2 and Ti6Al4V were carried out at the Ecorr and at different anodic potentials. Figure 7 presents the Bode plots obtained for Ti at Ecorr after one hour of immersion in citric acid (- 0.32 V); in citric acid with bromide (- 0.22 V) and in citric acid with iodide (- 0.18 V). The EIS spectrum of Ti in the chloride containing citric acid solution is not shown because it was similar to that obtained in the citric acid. The diagrams show two overlapped time constants in the middle frequency range relating to a citrate ions adsorption process that took place on the electrode surface, according to the reactions22:
H3cit ⇌ H2cit -sol + H
+
H2cit
-sol⇌ H2cit -ads (a)
(b)
Figure 4. Micrographs of Ti6Al4V rod obtained in bromide-containing citric acid after polarization from - 1.0 to 4.0 V.
i/A.cm
-2
2.0x10⁻³
1.5x 10⁻³
1.0x 10⁻³
5.0x 10⁻⁴
0.0
- 5.0 x 10⁻⁴
- 1.0 x 10⁻³
- 1.0 0.0 1.0 2.0 3.0
E/Vx SCE
4.0
Figure 5. Voltammetric curve of Ti in iodide-containing citric acid from - 1.0 to 4.0 V at 0.02 Vs-1.
i/A.cm
-2
1.0x10⁻⁴
0.0
- 1.0 x 10⁻⁴
- 2.0 x 10⁻⁴
- 3.0 x 10⁻⁴
- 4.0 x 10⁻⁴
- 2.0 - 1.0 0.0 1.0 2.0 3.0 4.0
E/Vx SCE
Figure 6. Voltammetric curve of Ti in fluoride-containing citric acid from - 1.0 to 4.0 V at 0.05 Vs-1.
5.5 5.0 4.5 4.0 3.5 3.0 2.5 2.0 1.5 1.0 0.5
log Z / ohm cm
2
- 2 - 1 0 1 2
log f / Hz
3 4 5
90 80 70 60 50 40 30 20 10 0
- phase / de
g
citric acid
citric acid + bromide citric acid + iodide
EIS spectra in fluoride containing citric acid electrolyte were not taken due to the potential instability and nonlinearity resulting from the high corrosion rate in this medium.
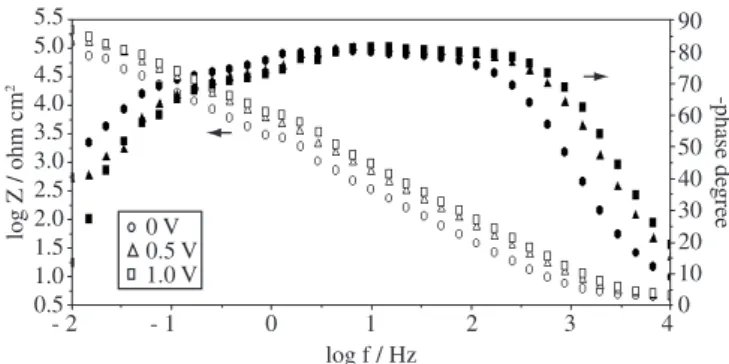
In order to characterize the oxide film formed in the presence of the various tested halides, EIS spectra were recorded with Ti and Ti6Al4V in citric acid solution, with or without halides at different applied potentials. The electrodes were at the Ecorr for 600 s and then polarized at a chosen anodic potential, allowing the system to stabilize for 600 s at each potential. The Bode plots (Figure 8) obtained for the alloy in citric acid at 0, 0.5 and 1.0 V show that, upon increasing the potential, the maximum phase angle shifted towards higher frequen-cies and the film’s resistance increased. At lower frequenfrequen-cies, the phase angle decreased as the potential increased, indicating a more porous film than that formed at Ecorr. Therefore, these EIS spectra can be ascribed to a duplex oxide film with a compact inner layer and a porous outer layer, which is congruent with previous works23-25.
The EIS spectra recorded for Ti in the chloride containing citric acid medium at different anodic potentials evidence at least two overlapped time constants relating to the strong adsorption process of this ion on the oxide film (Figure 9). Moreover, when the electrode was polarized at 0 V, the phase angle near to - 45° at the lower fre-quency limit indicated a process of diffusion while, for polarization at 1.0 V, the phase angle shifted to - 10°, indicating that the film’s porosity increased.
In the presence of bromide ions, the Bode plots of Ti6Al4V obtained at 0 and 1.0 V (Figure 10) showed a linear log Z vs. log f relation typical of passive films, with slope values close to - 1 and phase angles of almost - 90°. It is plausible to suppose that bromide adsorption took place on the oxide outer layer, sealing the pores. The film’s resistance decreased at potentials above 1.0 V and, at 2.5 V, a phase angle of close to 10° detected at low frequencies was ascribed
to an inductive time constant, confirming the corrosion process in-dicated by the voltammetric curves.
The effect of the addition of iodide ions on the EIS spectra of Ti6Al4V obtained at 0, 0.5 and 1.0 V is depicted in Figure 11. The film’s features changed significantly when the anodic potential was increased. The film’s resistance decreased with increasing potential, while the maximum phase angle shifted to higher frequencies and the phase angle approached 0 degrees at lower frequencies. These characteristics indicate that changes in the film’s conductivity took place, allowing the iodide oxidation reaction to occur on the oxide surface, since the impedance at the low frequency limit, which is totally resistive, is related with the charge transfer reaction at the film/solution interface. This hypothesis is in agreement with the voltammetric results, in which the alloy’s dissolution in iodide media was not detected.
Figure 12 shows the Nyquist plots for Ti in the fluoride ions containing citric acid at 0, 0.5 and 1.0 V. At least three time constants are visible: a) a capacitive time constant at high frequencies; b) an inductive time constant at medium frequencies; and c) a second ca-pacitive time constant at the lower frequencies. The diameter of the first capacitive semi-circle and the diameter of the inductive loop were found to increase as the applied potential increased. Furthermore, the second capacitive loop, at lower frequencies, was related to the oxide film. The inductive time constant has been related to the relaxation of bulk species in the oxide film and the capacitive time constant in the region of lower frequency to the oxide layer dissolution26. Ibris21
ascribed the inductive loop to the adsorption of [TiF6]n- species on
the Ti surface.
To compare the effect of each halide ion on the characteristics of the anodic films formed on Ti6Al4V alloy, the experimental data were evaluated using a simple least-squares fitting procedure. The
90
65
40
15
- 10
-phase/de
g
- 2 - 1 0 1
log f / Hz
2 3 4
5.5 5.0 4.5 4.0 3.5 3.0 2.5 2.0 1.5 1.0
log Z / ohm cm
2
0 V 0.5 V 1.0 V
Figure 8. Bode plots of Ti6Al4V obtained in citric acid after anodic polariza-tion at 0 (●), 0.5 (■) and 1.0 (▲) V.
5.5 5.0 4.5 4.0 3.5 3.0 2.5 2.0 1.5 1.0 0.5
log Z / ohm cm
2
- 2 - 1 0 1 2 3 4
log f / Hz
-phase de
gree
90 80 70 60 50 40 30 20 10 0 0 V
0.5 V 1.0 V
Figure 9. Bode plots of Ti obtained in the presence of chloride after anodic polarization at 0 (●), 0.5 (▲) and 1.0 (■) V.
90
65
40
15
- 10
-phase de
gree
- 2 - 1 0 1 2 3 4
log f / Hz
log Z / ohm cm
2
6
5
4
3
2
1
0 V 1.0 V 2.5 V
Figure 10. Bode plots of Ti6Al4V obtained in the presence of bromide after anodic polarization at 0 (●), 1.0 (▲) and 2.5 (∎) V.
5.5 5.0 4.5 4.0 3.5 3.0 2.5 2.0 1.5 1.0 0.5
- 2 - 1 0 1 2 3 4
log f / Hz
log Z / ohm cm
2 -phase de
gree
80
55
30
5
- 20 0 V
0.5 V 1.0 V
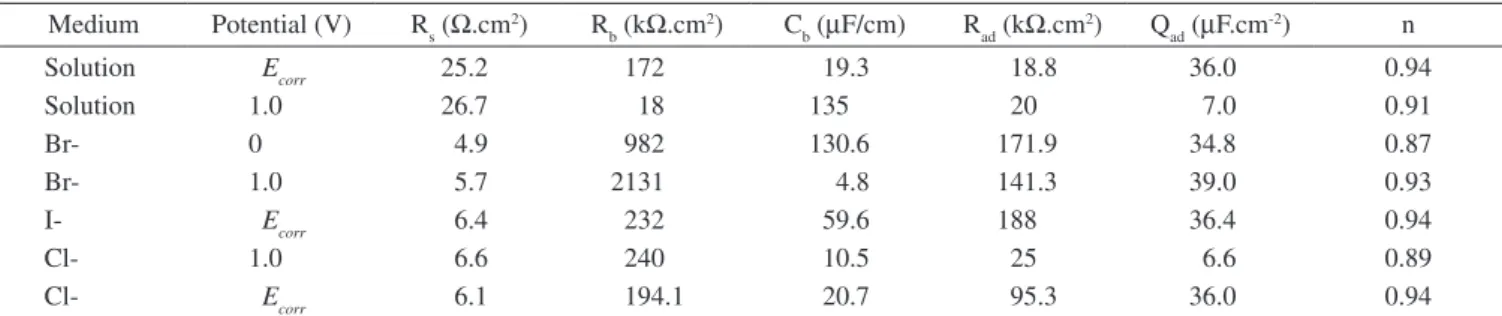
Table 2. Simulated data for Ti6Al4V alloy in citric acid solution with and without halides.
Medium Potential (V) Rs (Ω.cm2) R
b (kΩ.cm
2) C
b (µF/cm) Rad (kΩ.cm
2) Q
ad (µF.cm
-2) n
Solution Ecorr 25.2 172 19.3 18.8 36.0 0.94
Solution 1.0 26.7 18 135 20 7.0 0.91
Br- 0 4.9 982 130.6 171.9 34.8 0.87
Br- 1.0 5.7 2131 4.8 141.3 39.0 0.93
I- Ecorr 6.4 232 59.6 188 36.4 0.94
Cl- 1.0 6.6 240 10.5 25 6.6 0.89
Cl- Ecorr 6.1 194.1 20.7 95.3 36.0 0.94
Table 3. Simulated data for Ti in iodide containing citric acid solution.
Potential (V) Rs (Ω.cm2) R p (Ω.cm
2) Q p (µF.cm
-2) N
0.5 7.1 21.2 9.7 0.92
1.0 7.8 0.39 7.6 0.91
- Z”/ ohm.cm
2
1600
1400
1200
1000
800
600
400
200
0
0 200 400 600 800 1000
Z’ / ohm.cm2
0 V 0.5 V 1.0 V
Figure 12. Nyquist plots of Ti obtained in the presence of fluoride after anodic polarization at 0 (●), 0.5 (■) and 1.0 (▲) V.
equivalent circuits (EC) proposed to fit the EIS data show a good fitting with a less than 10% error. The EC used to describe the EIS data obtained in citric acid with and without bromide, chloride and iodide ions is Rs(Cb[Rb(RadQad)]), which has been associated with the duplex film model23-25. In the proposed EC (Figure 13), R
S is the
electrolyte’s resistance, Cb and Rb are the capacitance and resistance of the inner barrier layer, Rad is the resistance of the outer layer and Qad is a constant phase element (CPE) substituting the capacitance relating to the adsorbed species. The CPE impedance takes into ac-count surface heterogeneities and diffusion processes27. This EC is
valid to describe the experimental data for Ti and Ti alloy in iodide
ions containing solution only in the potential range between Ecorr and 0.0 V.
Table 2 shows the fitted parameters used to simulate the EC for some representative experimental data. As can be seen, the resist-ance and capacitresist-ance of the films depend on the nature of the added halide ions and on the applied potential. For films grown in the buffer and in the presence of bromide and chloride ions, Rb increased and Cb decreased when the potential was raised to 1.0 V. Moreover, the increase in the outer layer resistance in the halides containing citric acid solution can be attributed to their adsorption on the passive film and/or to the accumulation of electrolyte inside the pores, increasing the overall resistance of this layer.
The EC proposed to describe the experimental data for Ti6Al4V in the presence of iodide ions at 0.5 and 1.0 V is Rs(QpRP), where Rs represents the solution’s resistance, RP is the polarization resistance and Qp is the CPE used to replace the system capacitance (Figure 14). The simulated values for Ti6Al4V are given in Table 3.
The EC that describes the EIS data obtained in the presence of fluoride ions (Figure 15) includes an inductive element similar to that proposed by Ibris et al.21 In this circuit, the Q
DL replaces the double
layer capacitance in parallel with the charge transfer resistance (RCT). The inductance, Lads, and resistance, Rads, correspond to surface and/or bulk relaxation species in the film, while Rf represents the film resist-ance and Cf the film capacitance. Simulated data for Ti grade 2 at 0 and 1.0 V are given in Table 4. The film’s resistance increased at more anodic potentials, indicating a tendency for surface passivation. On the other hand, the high Cf values were ascribed to a more defective and porous film formed in the presence of fluoride ions.
RS
Rad
Rb
Cb
Qad
Figure 13. Equivalent circuit obtained from fitting and simulation of Bode plots in Figure 7.
RS
Rp
Qp
4. Conclusions
The electrochemical behavior of Ti and Ti6Al4V in citric acid aque-ous solution at pH 2.0 was affected by halide ions. A passive state was detected for both electrodes at Ecorr in citric acid with and without bro-mide, chloride and iodide ions. However, the primary oxide film formed on the metal surface dissolved in the presence of fluoride ions.
Voltammetric studies of Ti and Ti6Al4V showed a passive behav-ior in the presence of citric acid and chloride. Breakdown of the film was observed at 3.0 and 2.5 V for Ti and Ti6Al4V, respectively, when bromide ions were added to the solution. In the presence of fluoride ions, dissolution of the film occurred with both electrodes at potentials close to - 1.0 V, followed by the surface passivation. Iodide ions were oxidized on the passive oxide film at potentials close to 1.0 V.
Our EIS data revealed that, in citric acid solution, the film resist-ance increased when the applied potential was increased in a potential range from 0 to 1.0 V. A strong adsorption process took place on the electrode surface in solutions containing chloride ions at all the potentials tested. In the bromide-containing solution, the polarization resistance decreased at potentials above 1.0 V and at 2.5 V and the inductive time constant appeared at low frequencies, confirming the film breakdown indicated by the voltammetric curves. In the presence of fluoride ions, both electrodes displayed a corrosive process at all the potentials studied here. The film’s resistance increased at more anodic potentials, evidencing a tendency for surface passivation in this medium, as indicated by the voltammetric curves.
Acknowledgments
The authors gratefully acknowledge the financial support pro-vided by the Brazilian agencies CNPq, CAPES and FAPERGS for this work.
References
1. Schutz RW, Thomas DE, Corrosion of titanium and titanium alloys. Metals Handbook, v. 13, 9th edn, ASM International; 1987. p. 669-706. 2. NASA; MFSC Materials and Processes Home Page. NACE, Houston.
1998, in http main.mfsc.nasa.gov.
3. Streitzel R, Hösch A, Kalbfleisch H, Buch D, In vitro corrosion of tita-nium, Biomaterials. 1998; 19(16):1495.
4. Popa MV, Demetrescu I, Vasilescu E, Drob P, Lopez AS, Mirza-Rosca J, Vasilescu C, Ionita D, Corrosion susceptibility of implant materials Ti–5Al–4V and Ti–6Al–4Fe in artificial extra-cellular fluids. Electroch. Acta. 2004; 49(13):2113.
Table 4. Simulated data for the Ti electrode in fluoride containing citric acid solution.
Potential V Rs (Ω.cm2) R
CT (Ω.cm 2) Q
DL (µF.cm
-2) n R
ads (Ω.cm 2) L
ads (H.cm 2) R
f (kΩ.cm 2) C
f (µF.cm -2)
0 15.1 132.9 22.2 0.88 102 0.73 1.4 15.4
1 15.8 193.6 8.4 0.93 141 0.12 1.8 10.6
Figure 15. Equivalent circuit obtained from fitting and simulation of Nyquist plots in Figure 12.
R ads
R f
Cf
Lads
QDL
R CT R
S
5. Kolman DG, Scully JR, Electrochemistry and Passivity of a Ti-15Mo-3Nb-3Al Beta-Titanium Alloy in Ambient Temperature Aqueous Chloride Solutions J. Electrochem. Soc. 1993; 140(10):2771.
6. Kolman DG, Scully JR. Electrochemistry and Passivity of Ti-15V-3Cr-3Al-3Sn Beta-Titanium Alloy in Ambient Temperature Aqueous Chloride Solutions. J. Electrochem. Soc. 1994; 141(10):2633.
7. Ramires I, Guastaldi AC, Estudo do biomaterial Ti-6Al-4V empregando-se técnicas eletroquímicas e XPS. Quím. Nova 2002; 25(1):10. 8. Raetzer-Sheibe HJ, Corrosion. 1978; 34:437.
9. Beck TR, Alkire R, Ocurrence of salt films during inititation and growth of corrosion pits. J. Electrochem. Soc. 1979; 126(10):1662.
10. Casillas N, Charlebois S, Smyrl W, White H. Scanning Electrochemi-cal Microscopy of Precursor Sites for Pitting Corrosion on Titanium. J. Electrochem. Soc. 1993; 140(9):L142.
11. Casillas N, Charlebois S, Smyrl W, White H, Pitting Corrosion of Tita-nium. J. Electrochem. Soc. 1994; 141(3):636.
12. Frateur I, Lattarin S, Musiani M, Tribollet B, Electrodissolution of Ti and p-Si in acidic fluoride media: formation ratio of oxide layers from electrochemical impedance spectroscopy J. Electroanal. Chem, 2000; 482(2):202.
13. Reclaru L, Meyer JM. Biomaterials. 1998; 19(1-3):85.
14. Schiff N, Grosgogeat B, Lissac M, Dalard F, Influence of fluoride content and pH on the corrosion resistance of titanium and its alloys, Biomaterials. 2002; 23(9):1995.
15. Kelsall GH, Robbins DJ. J. Electroanal. Chem. 1990; 283(1-2):135. 16. Jesuíno GA, Ribeiro LMF, Nakazato RZ, Codaro EN, O. Hein LR,
Pro-priedades mecânicas e resistência à corrosão da liga Ti-4Al-4V obtida da reciclagem da liga Ti-6Al-4V. Materials Research. 2001; 4(2):63. 17. Azumi K, Seo M, Changes in electrochemical properties of the anodic
oxide film formed on titanium during potential sweep, Corrosion Science. 2001; 43(3):533.
18. Laser D, Yaniv M, Gottesfeld S. Electrochemical and Optical Properties of Thin Oxide Layers Formed on Fresh Titanium Surfaces in Acid Solu-tions. J. Electrocem. Soc. 1978; 125(3):358.
19. Pauli CP, Giordano MC, Zerbino JO. Electrochim. Acta. 1993; 38(18):2777.
20. Schmidt AM, Azambuja DS, Martini EA. Semiconductive properties of titanium anodic oxide films in McIlvaine buffer solution. Corrosion Science. 2006; 48(10):2901.
21. Ibris N, Mirza-Rosca J. EIS study of Ti and its alloys in biological media J. Electroanal. Chem. 2002; 526(1-2):53.
22. Aoki IV, Bernard MC, de Torresi SIC, Melo HG, Joiret S, Tribollet B. Ac-impedance and Raman spectroscopy study of the electrochemical behaviour of pure aluminium in citric acid media. Electrochim. Acta. 2001; 46(12):1871.
23. Pan J, Thierry D, Leygraf C. Electrochemical impedance spectroscopy study of the passive oxide film on titanium for implant application. Electrochim. Acta. 1996; 41(7-8):1143.
24. González JEG, Mirza-Rosca JC. Study of the corrosion behavior of titanium and some of its alloys for biomedical and dental implant ap-plications. J. Electroanal. Chem. 1999; 471(2):109.
25. Assis SL, Wolynec S, Costa I. Corrosion characterization of tita-nium alloys by electrochemical techniques. Electrochim. Acta. 2006; 51(8-9):1815.
26. Lenderink HJW, Linden MVD, de Wit JHW. Corrosion of aluminium in acidic and neutral solutions. Electrochim. Acta. 1993; 38(14):1989. 27. Rammelt U, Reinhard G. On the applicability of a constant phase