Article
J. Braz. Chem. Soc., Vol. 22, No. 7, 1362-1370, 2011. Printed in Brazil - ©2011 Sociedade Brasileira de Química 0103 - 5053 $6.00+0.00
A
*e-mail: [email protected]
Electrochemical Behavior of Copper in Drinking Water: Evaluation of Dissolution
Process at Low Anodic Overpotential
J. F. Rios,a J. A. Calderón*,a and R. P. Nogueirab
aCorrosion and Protection Group, University of Antioquia, Calle 62 No. 52-59, lab 330, PA1226,
Medellin, Colombia
bLEPMI, UMR 5631 Grenoble INP-CNRS-UJF, 1130, Rue de la Piscine, 38402
St. Martin d’Hères, France
O comportamento eletroquímico do cobre em água potável foi estudado por polarização potenciodinâmica e espectroscopia de impedância eletroquímica em até quatro dias depois de imersão em condições hidrodinâmicas diferentes. Os resultados de impedância foram interpretados usando modelos de circuito equivalente, os quais mostraram um aumento da espessura do ilme com o tempo, que impede a difusão de espécies de cobre através da camada de óxido de cobre formada. Essa camada de óxido é maior em condição de estagnação. A baixos sobrepotenciais anódicos, os diagramas de impedância apresentam pelo menos quatro constantes de tempo que poderiam ser explicadas pela existência de diferentes pocessos faradaicos, a adsorção/dessorção de espécies intermediárias, processos de difusão e a formação de uma camada de óxido na superfície de cobre. Na região anódica, a resistência total à corrosão diminui, possivelmente devido à dissolução das espécies de cobre e ao aumento da difusão através da camada de óxido, principalmente sob condições hidrodinâmicas.
The electrochemical behavior of copper in near-neutral aerated tap water was studied by potentiodynamic polarization and electrochemical impedance spectroscopy up to four days of immersion under different hydrodynamic conditions. The impedance results were interpreted by equivalent circuit that showed an increasing ilm thickness with time that hinders the diffusion of copper species across the oxide layer, which is larger in stagnating condition. At low anodic overpotential, copper impedance presents at least four time constants that could be explained by faradaic processes, adsorption/desorption of intermediate species, diffusion controlled process and oxide layer formation on copper surface. In the anodic region, the overall corrosion resistance decreases possibly due to the dissolution of copper species and the increase of diffusion across the oxide layer, mainly under hydrodynamic condition.
Keywords: copper, corrosion, drinking water, EIS, polarization
Introduction
Copper is widely used in water distribution systems throughout the world. Generally considered as corrosion resistant, Cu usually develops a protective oxide layer when exposed to neutral or slightly alkaline water, which can retard further corrosion from de metallic surface.1
Nevertheless, yet in drinking water under certain conditions, Cu can induce a green-blue colored aspect due to its dissolution when particulate corrosion products are released into the bulk water.2,3
Some studies developed in synthetic tap water and neutral low conductivity water in aerated conditions showed that the Cu corrosion behavior is related to the presence of an oxide ilm,1,4-7 which is primarily composed of cuprous species1 with
other copper products like cupric oxide, cupric hydroxide and possibly cupric carbonate.8, 9 It has been reported that an
increase of the oxide ilm thickness on the surface causes an increase of the polarization resistance with time, mainly in the irst days of immersion.1,10 Conversely, a decrease in the
oxide ilm thickness is obtained with rotating disk electrodes, yielding smaller polarization resistance values.10
understood, mainly at low anodic potential since most of the literature is devoted to open-circuit potential (OCP) analysis. Nevertheless, the copper pipes in drinking water system can be submitted to small polarizations, which can occur due to improper grounding of external electrical service devices, galvanic corrosion when copper is in electrical and ionic contact with a dissimilar metal, population of bacteria in non conducting layers on the metal surface that could increase electrochemical potential for differential oxygen cells and some other events.
The aim of this study is hence to investigate the corrosion behavior of copper in drinking water under static and hydrodynamic conditions in the irst four days of immersion at low anodic overpotential, compared to results obtained at OCP. The main idea is to address the impact of eventual changes in the actual service conditions that can induce slight anodic polarization of the metal.
Experimental
Tests were carried out on a conventional three electrode electrochemical cell under potentiostatic conditions. The working electrode (WE) was a pure copper rotating rod mounted in a Telon cylinder so that only the cross section (0.2 cm2) was exposed to the solution. The samples were
polished down to grade 1200 with emery paper, then ultrasonically degreased in ethanol, rinsed with distilled water and dried with air. The rotating disk electrode (RDE) was operated at different rotation speeds, 0, 100, 900, and 2500 rpm. The electrode potential, E, was measured against a saturated calomel reference electrode (SCE) with a Luggin capillary to minimize ohmic drops and a large surface Pt grid was used as the counter electrode. All potentials are referenced to SCE.
The electrolyte was tap water from Grenoble (France) which main physicochemical parameters were: total hardness as Ca2+ and Mg2+ 180 mg L-1, alkalinity
146 mg L-1, pH 7.6, conductivity 430 µS cm-1, dissolved
oxygen 7.7 mg L-1, chloride 5.9 mg L-1, sulfate 38 mg L-1,
nitrate 2.4 mg L-1. According to this data, the tap water
has a near-neutral pH values, high values of alkalinity and total hardness. Prior to each experiment the cell was bubbled with air during one hour before the WE was introduced and all over the experiment. The dissolved oxygen concentration was regularly veriied to be at least 99.5% (8.5 mg L-1). All experiments were performed at
controlled temperature (23 ± 1 °C).
Polarization tests were carried out at several rotation rates to examine the inluence of mass transport. Before starting the polarization sweep, the RDE was immersed into the electrolyte till a steady evolution of the OCP was
reached. For the OCP to become stable within ± 5 mV range, a rest time of about half an hour was required. Anodic polarization was performed from OCP up to 0.8 V. The potential sweep rate was 0.167 mV s-1 or 0.01 mV s-1. The
polarization curves were a posteriori corrected regarding the ohmic drop (I.RSol) between the reference and the WE. The electrolyte resistance (RSol) was 750 ohm, which was
determined at the real valued high frequency limit of the impedance diagrams. Raman spectra were recorded using a Raman imaging microscope (Horiba Jobin Yvon). An Ar laser (632.8 nm) was used as the excitation source. The laser power was set to a low value (using a D2 ilter) to avoid sample damage.
Electrochemical impedance spectroscopy (EIS) tests were carried out with the aim of evaluating corrosion processes such as growth of corrosion products film, adsorption and diffusion of species. EIS measurements were conducted both at open circuit potential during 4 days as well as at low anodic polarization up to 60 mV regarding Ecorr. An ac signal amplitude of 10 mVrms was applied and data were collected in the frequency range 10 kHz-1 mHz using 10 points per decade. The impedance curves were
itted to the equivalent circuit model using the ZSimpWin program. Polarization and electrochemical impedance spectroscopy measurements were carried out using a Solartron potentiostat (model SI1287) equipped with a frequency response analyzer (model 1255 HF).
Results and Discussion
Potentiodynamic polarization
Immersed into drinking tap water of Grenoble, copper reaches a typical OCP value of ca.−0.010 V after about
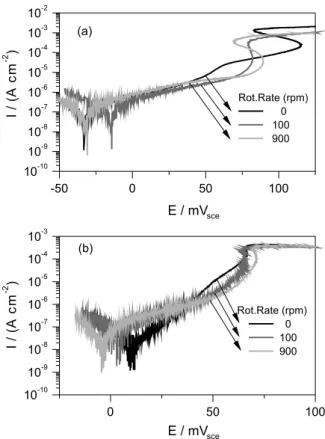
30 min of immersion. Figure 1 illustrates the OCP evolution which was fairly reproducible. Anodic polarization curves were performed after 1 h of immersion (Figure 2). S-shaped curves were obtained for each rotation rate after carrying out the correction of ohmic drop (Figure 2a), which is interpreted as an intrinsically current-controlled interface.11 Another possibility to this S-shaped behavior
would be related to the fact that, in spite of the low scan rate (0.167 mV s-1), the interface should not actually be
at steady state conditions. This hypothesis was veriied by performing even lower scan rate sweeps (0.01 mV s-1,
the plateau onset and the current density value associated are not dependent on the rotation speed, which clearly indicates that this is not a simple mass transport limitation. This saturation can be probably related to the formation of an oxide layer yielding a certain degree of passivation of the surface. It is also worth noticing that the current density plateau is lower for the slower scan rate which corroborates the idea of a not completely steady state in the case of Figure 2a.
Copper surface characterization
To identify the Raman spectra with the speciic oxides present in the ilm surface, it is useful to inspect the vibrational frequencies for different phase copper oxides at Cu surfaces.12
Figure 3 shows the Raman spectra of formed ilm on copper surface at different immersion times. In the spectra are observed two broad peaks centred almost at 525 cm-1 and
625 cm-1 which are unambiguously related to cuprous oxide,
cuprite (Cu2O), in according to the Raman reference spectrum for cuprous oxide and the spectrum bands.13,14 Likewise, this
result accords with the copper corrosion products reported for the water-copper system where the oxides ilm have been mostly composed by cuprous oxide.1,10
Electrochemical impedance spectroscopy at OCP
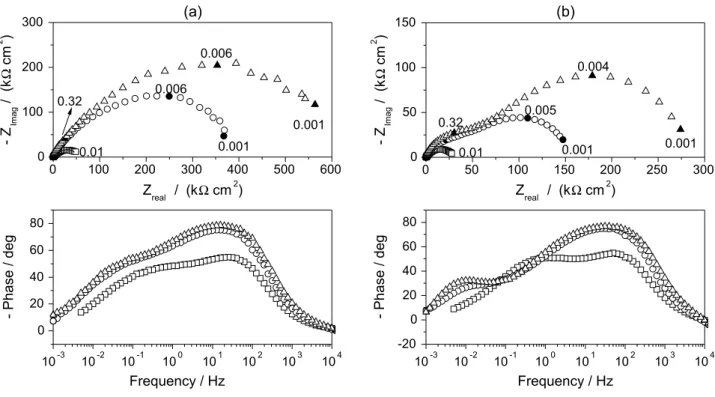
Figure 4 depicts EIS spectra obtained at open circuit potential for different rotation rates after 1 and 96 h of exposition. All diagrams show a lattened capacitive behavior with more than one time constant, which means that any model based on a single charge transfer processes across the double layer is excluded. Results obtained after 1 h (Figure 4a) collapse at high frequencies and differentiate only at the low frequency range with Rp extrapolated values decreasing from ca. 60 kΩ cm2 to 30 kΩ cm2. After four
days of exposition, (Figure 4b), the impedance magnitude is much higher and the interface is much more sensitive to hydrodynamic conditions. In principle, this diminution of Rp could be due to a decrease of either the thickness of the Nernst diffusion layer of copper ions or the oxide ilm thickness, or both.10 The effect of time on the interface behavior is
straightforwardly depicted in Figure 5 with the help of Nyquist and bode phase diagrams for 0 and 900 rpm. A continuous increase in the low frequency limit of the impedance with immersion time is observed as well as the Bode phase diagram
Figure 1. Time record of OCP evolution of copper in Grenoble drinking
water at 23 °C. In the inset: OCP evolution during the irst 2 h.
Figure 2. Potentiodynamic anodic polarization of copper at different rotation speeds at two potential sweep rate (a) 0.167 mV s-1,
(b) 0.01 mV s-1.
Figure 3. Raman spectra of oxide ilm formed on copper surface after
shows a tendency to a more purely capacitive behavior at the low frequency range. Since the thickness of the Nernst layer is not prone to be time-dependent at highly controlled hydrodynamic conditions as those ensured by the RDE, results presented in Figures 4 and 5 are most likely to be related to ilm thickening upon the surface.
The impedance spectra of copper in the present conditions show three time constants at OCP for each immersion time and rotation rate considered. In this way, the impedance spectra were adjusted with the equivalent circuit shown in Figure 6. This circuit is typical of metal coated by a porous oxide layer,15 and it is similar to circuits used before by other
authors for copper corrosion in potable water.1,6,16
Since the electrodes can present various types of heterogeneities that could cause a depression of the capacitive semicircle (surface roughness, corrosion, insufficient polishing, grain boundaries and surface impurities),17 constant phase elements (CPE) are used
instead of pure capacitors in the equivalent circuit. The impedance of a CPE is given by
(1)
where Q0 is a constant with dimensions of S cm-2 sn, j is the
imaginary number (j2 = –1), ω is the angular frequency and
n is the CPE factor, usually between 0.5 and 1 for a rough or porous surface. In addition, the pseudo-capacitance associated with the CPE can be calculated using the equation 2.18
(2)
where C is the pseudo-capacitance associated and R is the resistance in parallel with the CPE.
Figure 4. OCP Nyquist plots of EIS of copper in Grenoble drinking water at 23 °C after 1 and 96 h of immersion at different rotation speeds () 0 rpm, () 100 rpm, () 900 rpm and () 2500 rpm.
Figure 5. OCP Nyquist and Bode (phase) plots of EIS of copper in Grenoble drinking water at 23 °C for several immersion times () 1 h, () 24 h,
The three time constants identiied in the impedance diagrams can be ascribed to different phenomena. The high frequency one is assigned to the oxide layer on the surface, the middle frequency to redox processes occurring in the passive layer and the low frequency time constant, to the diffusion of copper ions from the copper substrate through the oxide ilm. A good adjustment of impedance data was obtained with this model, where RSol represents the solution resistance, CPEilm a constant related to oxide
ilm, Rilm the resistance of the ilm, CPEdl a constant related to the double layer, Rct the resistance of the charged
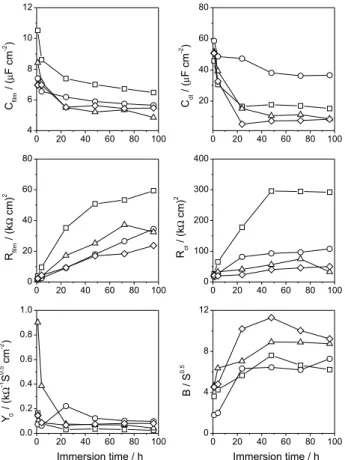
transfer, and ZD is the inite length diffusion element. The plots of adjusted parameters with time are shown in Figure 7. The oxide ilm pseudo-capacitance decreases with immersion time, mainly in the irst 24 h, which can indicate that a layer quick develops upon the surface. The ilm pseudo-capacitance values oscillate between 7 and 5 µF cm-2 after this time, while the n exponent is close
to 0.9 for all impedance simulations. This quite high C values are not representative of highly protective ilms. It seems that the protective role of the ilm here should come most from a thickening effect than from intrinsic barrier properties. In the case of double layer pseudo-capacitance, it diminishes with immersion time from 60 to 8 µF cm-2,
which is in good agreement with usual metal-electrolyte interfacial capacitance values, while the n exponent is near to 0.8. Film and charge transfer resistances increase with immersion time corroborating the hypothesis of ilm thickening or higher compactness of oxide ilm. On the contrary, the lower Rct values with rotation evidence the faster charge transfer across the double layer, which in turn, results in less oxidized or compact ilm (lower Rilm values).
The diffusion impedance ZD can be described by the following equation, particularly in cases when the diffusion length is inite:19,20
(3)
where B = δ/√–D, δ is the Nernst diffusion layer thickness, D is the value of the diffusion coeficients of the species, R is the ideal gas constant, T absolute temperature, and Y0 = 1/σ√–2, σ is the Warburg coeficient that can be deined like the diffusion resistance. This is deined as:
Here, D is the diffusion coeficient of the species, and C is the bulk concentration of the diffusing species. The diffusion coeficient through the layer is almost independent of immersion time,21 but can change with rotation rate,22
which means that the direct effect of shear stresses due to the forced convection on the oxide layer can also contribute to the overall behavior depicted in Figure 6.
The values of the diffusion factor (B) and the inite length diffusion (Y0) are also shown in Figure 7. It seems that Y0 decreases with immersion time in the irst 24 h,
which can be caused by a decrease of diffusion coeficient due to a greater coverage of the surface. This agrees with the results of oxide ilm pseudo-capacitance. After 24 h, the value of Y0 remains constant, which is expected
Figure 6. Equivalent electric circuits used to it the impedance spectra of copper at open circuit potential given in Figure 5.
Figure 7. Adjusted parameters at different immersion time itted with
because the diffusion coeficient should not change after the ilm reached its steady state coverage. In addition, Y0 slightly increases with rotation rate due to a boosted
diffusion caused possibly by a lower coverage or by a less compact layer due to shear stresses as mentioned before. It hence appears that the diffusion resistance increase with immersion time and decreases with the electrode rotation. In the same way, B increases with immersion time mainly during the irst 24 h, which corresponds to the initial formation of the oxide layer. This could be caused by a decreasing of the diffusion coeficient inside the oxide ilm.
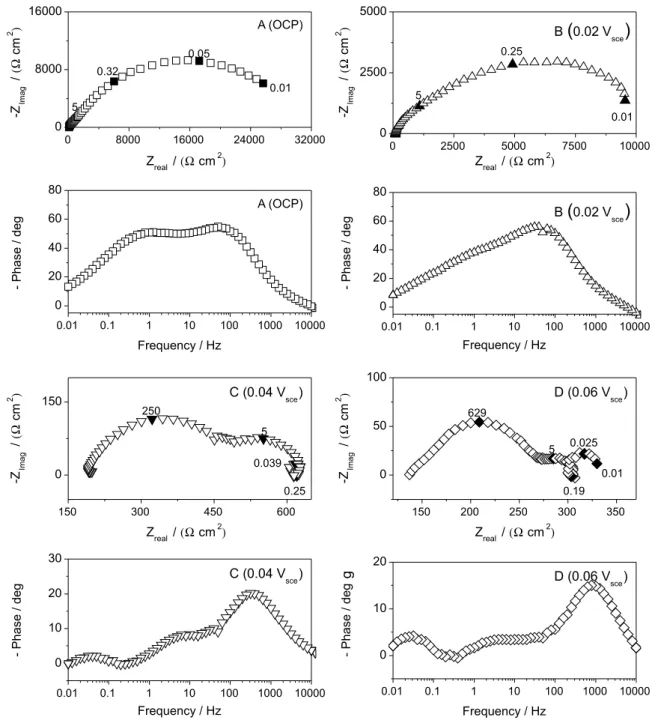
Copper corrosion at low anodic overpotential
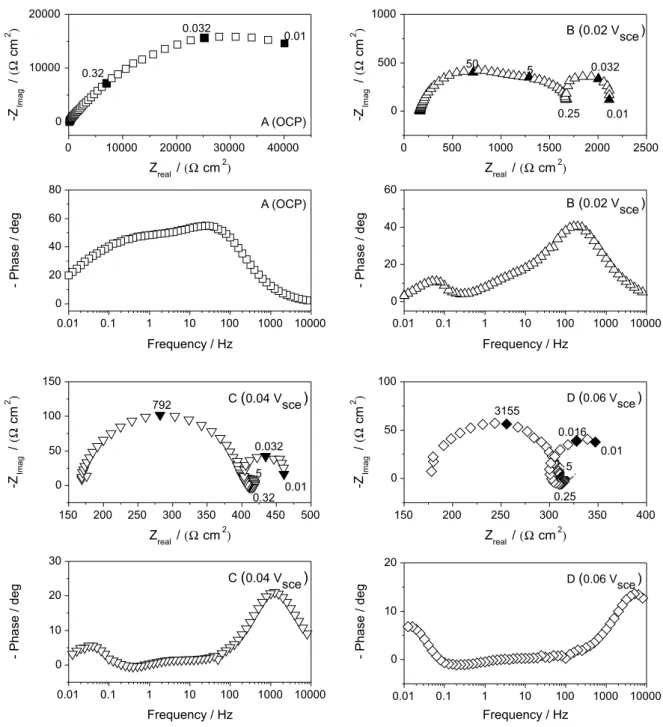
Impedance measurements of copper in tap water were performed at three overpotentials in the potential region between OCP and 0.06 Vsce. Figures 8 and 9 depict
impedance diagrams after 1 h of immersion for 0 and 900 rpm, respectively. In a irst glance, the polarization resistance, as expected, decreases with the increase of anodic overpotential due to higher current densities in the anodic polarization curve. More interesting, the measured impedance diagram at the corrosion potential presents three time constants, all of them represented by entangled
Figure 9. Nyquist and Bode phase plots of EIS of copper in Grenoble drinking water at 23 °C at OCP and at different anodic overpotentials at 900 rpm.
capacitive loops, indicating that at least three potential dependent processes govern the corrosion mechanism at this potential. However at low anodic polarization levels the corrosion mechanism appears to be drastically different. At 0.02 Vsce (Figure 8b) a small inductive loop appears at characteristic frequency of about 250-300 mHz. The low-frequency capacitive loop seems to be that already present at OCP (cf Figure 5b). Also a new capacitive time constants appear at characteristic frequencies of ca. 5 Hz.
The impedance diagrams at 0.04 Vsce and 0.06 Vsce, for
both rotation rates, did not reveal more time constants than those found at 0.02 Vsce, which indicate at least four
potential dependent processes existing in the evaluated potential range.
Cordeiro et al.23 studied the copper electrodissolution
in a pH range 0-5 and found that the impedance diagrams at open circuit potential present only one depressed loop, while impedance at high anodic polarization exhibits two additional loops, which were ascribed to the relaxation of two adsorbed species, Cu(I)ad and Cu(II)ad, on the
electrode surface. Two auto-catalytic reactions related to adsorption/desorption of Cu(I)ad and Cu(II)ad were proposed
electric potential in impedance diagrams. In addition, in that study an inductive loop appeared at higher polarization, which was ascribed to the relaxation of the adsorbate species Cu(I)ad when its consumption rate is larger than its production one, which means average species desorption.
As well as for the mechanism proposed by Cordeiro, the copper electrodissolution at low anodic overpotential in drinking water could be explained by two adsorption/ desorption processes. As can be seen in Figures 8 and 9, the copper impedance diagrams at low anodic overpotential in drinking water exhibit at least four time-constants, which can be associated to the double layer capacitance, the relaxation of two intermediates species and a diffusion controlled process. The characteristic frequencies of the capacitive and inductive loops at intermediate frequencies (5 Hz and ca. 0.25 Hz) are likely potential independent, which
could indicate that the adsorption / desorption processes related with adsorbed species, Cu(I)ad and Cu(II)ad, involve auto-catalytic reactions. Hence, although the characteristic frequencies are different of those detected by Cordeiro, it is reasonable to consider the hypothesis that the adsorbed species Cu(I)ad and Cu(II)ad could be also present in copper corrosion processes in drinking water, being Cu(I)ad the
principal constituent of the oxide ilm, like as Cu2O.1,24 On the
other hand, the diffusion process which must be interpreted as the diffusion of copper species across the oxide ilm, since impedance diagrams appears to be little dependent on hydrodynamic conditionsAccording to Nyquist diagrams, the protective effect of copper oxide layer is much smaller at low anodic overpotential compared to OCP measurements. This entails that protecting copper pipes in drinking water means avoiding even small polarizations.
Conclusions
The results of EIS measurement at OCP for copper in drinking water indicate that the Rp value increases with the immersion time, mainly in the irst 24 h. However, under low conditions, the Rp values were smaller that those measured with low stagnation. This was caused by the larger dissolution of copper species across the oxide ilm. Copper impedance diagrams at low anodic overpotential in drinking water exhibit at least four time-constants, which can be associated to the double layer capacitance, the relaxation of two intermediate species and a diffusion process. The charge transfer resistance decreases and an inductive arc are evident with increasing anodic potential, which is related to a much less protective oxide layer and the release of adsorbed species. Copper immersed in drinking water such as that from Grenoble hence seems to be very sensitive to small anodic polarizations that induce a
sharp decrease of the corrosion resistance, which can cause a relevant damage in water distribution system.
Aknowledgments
The Authors wish to thank the COLCIENCIAS and the Programa de Sostenibilidad of the University of Antioquia, Colombia, for the inancial support. J.F. Rios gratefully acknowledges the COLCIENCIAS for his scholarship.
References
1. Shim, J. J.; Kim, J. G.; Mater. Lett.2004, 58, 2002.
2. Critchley, M. M.; Pasetto, R.; O’Halloran, R. J.; J. Appl. Microbiol.2004, 97, 590.
3. Edwards, M.; Jacobs, S.; Taylor, R. J.; J. Am. Water Works Assoc.
2000, 92, 72.
4. Drogowska, M.; Brossard, L.; Ménard, H.; J. Electrochem. Soc.
1992, 139, 39.
5. Broo, A. E.; Berghult, B.; Hedberg, T.; Corros. Sci.1997, 39, 1119.
6. Palit, A.; Pehkonen, S. O.; Corros. Sci.2000, 42, 1801. 7. Zhang, X. H.; Pehkonen, S. O.; Kocherginsky, N.; Ellis, G. A.;
Corros. Sci.2002, 44, 2507.
8. Cong, H. B.; Michels, H. T.; Scully, J. R.; J. Electrochem. Soc.
2009, 156, C16.
9. Merkel, T. H.; Grosβ, H. J.; Werner, W.; Dahlke; T.; Reicherter, S.; Beuchle, G.; Eberle, S. H.; Water Res.2002, 36, 1547. 10. Feng, Y.; Teo, W. K.; Siow, K. S.; Tan, K. I.; Hsieh, A. K.;
Corros. Sci.1996, 38, 369.
11. Gabrielli, C.; Identiication of Electrochemical processes by Frequency Response Analysis. Technical Report Number 004/83; Solartron Analytical: Paris, 1998.
12. Niaura, G; Electrochim. Acta2000, 45, 3507.
13. Chan, H. Y. H.; Takoudis, C. G.; Weaver, M. J.; J. Phys. Chem. B1999, 103, 357.
14. Christy, A. G.; Lowe, A.; Otieno-Alego, V.; Stoll, M.; Webster, R. D.; J. Appl. Electrochem.2004, 34, 225.
15. Orazem, M. E.; Tribollet, B.; Electrochemical Impedance Spectroscopy, John Wiley & Sons, Inc.: Hoboken, New Jersey, 2008.
16. Valcarce, M.; De Sanchez, S. R.; Vazquez, M.; J. Mater. Sci.
2006, 41, 1999.
17. Aljinovi, L. J.; Gudi, S.; Šmith, M.; J. Appl. Electrochem.2000,
30, 973.
18. Yeum, B.; ZSimpWin Programme, EChem Software (Technical Note 24 – Pseudocapacitance Associated with CPE), 2002. 19. Yeum, B.; ZSimpWin Programme, EChem Software (Technical
Note 3 – Electrical Components Associated with Mass Transport), 2001.
Impedance Spectroscopy; 2nd ed., Barsoukov, E.; Macdonald,
J. R., eds.; John Wiley & Sons, Inc.: New Jersey, 2003. 21. Bousselmi, L.; Fiaud, C.; Tribollet, B.; Triki, E.; Corros. Sci.
1997, 39, 1711.
22. Deslouis, C.; Lafont, M. C.; Pebere, N.; You, D.; Corros. Sci.
1993, 34, 1567.
23. Cordeiro, G. G. O.; Barcia, O. E.; Mattos, O. R.; Electrochim. Acta1993, 38, 319.
24. Pourbaix, M.; Atlas of Electrochemical Equilibria in Aqueous Solutions, 2nd ed., National Association of Corrosion Engineers:
Houston, Texas, 1974.
Submitted: January 14, 2011