Gilberto Petraconi*
Technological Institute of Aeronautics São José dos Campos – Brazil [email protected]
Alexei Mikhailovich Essiptchouk
Luikov Heat and Mass Transfer Institute Minsk – Belarus [email protected]
Leonid Ivanovich Charakhovski
Luikov Heat and Mass Transfer Institute Minsk – Belarus [email protected]
Choyu Otani
Technological Institute of Aeronautics São José dos Campos – Brazil [email protected]
Homero Santiago Maciel
Technological Institute of Aeronautics São José dos Campos – Brazil [email protected]
Rodrigo Sávio Pessoa
Technological Institute of Aeronautics São José dos Campos – Brazil [email protected].
Maria Luisa Gregori
Institute of Aeronautics and Space São José dos Campos – Brazil [email protected]
Sônia Fonseca Costa
Institute of Aeronautics and Space São José dos Campos – Brazil [email protected]
*author for correspondence
Degradation of carbon-based
materials under ablative
conditions produced by a high
enthalpy plasma jet
Abstract: A stationary experiment was performed to study the degradation of carbon-based materials by immersion in a plasma jet. In the experiment, graphite and C/C composite were chosen as the target materials, and the reactive plasma jet was generated by an air plasma torch. For macroscopic study of the material degradation, the sample’s mass losses were measured as function of the exposure time under various temperatures on the sample surface. A microscopic analysis was then carried out for the study of microscopic aspects of the erosion of material surface. These experiments showed that the mass loss per unit area is approximately proportional to the exposure time and strongly depends on the temperature of the material surface. The mass erosion rate of graphite was appreciably higher than the C/C composite. The ablation rate in the carbon matrix region in C/C composite was also noticeably higher than that in the iber region. In addition, the latter varied according to the orientation of ibers relatively to the low direction. These tests indicated an excellent ablation resistance of the C/C composite, thus being a reliable material for rocket nozzles and heat shielding elements of the protection systems of hypersonic apparatuses from aerodynamic heating.
Keywords: Graphite, C/C Composite, Ablation, Plasma torch, Calorimetric probe, Enthalpy probe.
INTRODUCTION
To develop and qualify composite materials used as ablative coatings for thermo-structural protection of rocket engines, launch pad and atmospheric reentry vehicles is a constant challenge in the aerospace ield. There are several types of materials used in these ablative thermal protection systems, as each material presents certain advantages and disadvantages in terms of its properties (speciic mass, mechanical strength, melting temperature, etc.) and environmental conditions that they are subjected to (heat low, temperature, mechanical stress, etc.). Between these materials, the graphite and carbon-iber-reinforced composite (usually referred to as C/C composite) are
materials often chosen because of their heat resistance
and strength at elevated temperature (Patton et al.,
2002). These materials present better ablative resistance and lower erosion rate than resin-based materials even under extremely severe thermal conditions. The ablative performance of C/C composite is signiicantly inluenced by both base materials characteristics and environmental parameters during the ablation process.
For solid rocket nozzle applications, one of the key requirements of the C/C composite is a low thermal conductivity (40 W/m.K) to minimize both the thickness of pyrolized carbon layer and the temperature rise at the reverse side of the composite (Park and Kang, 2002). Also, when a C/C composite is submitted to ablative conditions Received: 17/12/09
in air at high temperatures, it would be desirable that the reinforcing ibers and matrix remained unchanged, keeping their original structure, properties and shape during all the ablation process (Cho and Yoon, 2001).
In order to test the ablative resistance of carbon based materials, experiments of thermal degradation have been conducted using different techniques such as accelerating atomic oxygen (AO) and high lux plasma jet. As pointed by Fujimoto, Shioya and Satoh (2003), although there are several researches on degradation of monolithic carbon or graphite due to the impact of AO, there is little information on carbon-based materials such as C/C composite, especially when plasma jet ablation apparatus is used.
This paper presents a study of a plasma jet characteristics aimed at ablative resistance essays and, in conjunction with scanning electron microscopy (SEM) analyses, micro structural analysis of tested graphite and C/C composite. The experiments with the material samples were carried out in atmospheric environment, at a certain distance, facing the nozzle of the direct-current (DC) arc system. A linear calorimetric probe was used for the arc jet heat lux measurements at various radial and axial positions (Matsumo and Mieno, 2003). Abel’s inversion matrix method was then used to obtain the radial proile of the heat lux density at various longitudinal positions (Lochte-Holtgreven, 1968). Having these proiles, we could specify the region of the plasma jet where heat conditions (specify magnitude and uniformity) are appropriate to simulate thermal resistance of material samples under hypersonic light in atmosphere. Moreover, the ablation resistances of graphite and C/C composite samples exposed to the high enthalpy plasma were compared.
EXPERIMENTAL
Plasma torch setup
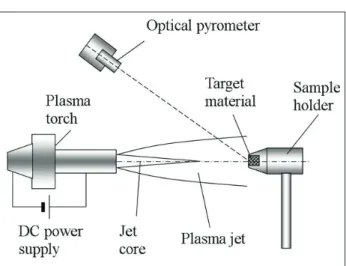
A linear non-transferred plasma torch with “hot” cathode and stepped anode was used to generate a reactive plasma jet (Fig. 1) to which the material sample, ixed in a sample holder, was exposed. The plasma-forming gas was air at a
low rate of 4.5 x 10⁻³ kg/s. The DC arc plasma torch was
designed for continuous operation at a power up to 50 kW. In this work, the torch parameters were adjusted to the arc current 135 A and arc voltage 300 V. Enthalpy of the produced plasma jet decreases with the distance from the torch nozzle attaining 3 MJ/kg at 80 mm distance, being compared to 5 MJ/kg at 10 mm one. This enthalpy range corresponds to conditions of a reentry light under Mach numbers 7 to 10 at the altitude of about 40 km (Barros, 2008), being in the ield of practical interest.
Linear calorimetric probe technique
An effective utilization of thermal plasma sources requires a thorough understanding of the heat transfer mechanism from the jet low to the materials under study. The mapping of the heat lux density from plasma jet was carried out by using a water-cooled calorimetric probe (Fig. 2),
constituted of a copper tube (outer diameter d = 3 mm,
inner diameter 2 mm) equipped with two thermocouples. The probe was assumed to be fully catalytic. Since the radiation loss from the cold surface of the probe is negligible, the measurement corresponds to the total convective and chemical heat lux reaching the surface. Figure 1: Schematic illustration of an apparatus for ablation
test using arc plasma torch.
Figure 2: (a) Linear calorimetric probe in front of the plasma torch arrangement; (b) the approximation to the radial distribution of the heat lux density used in the calculations.
The water mass low rate
m
was adjusted for eachusing chromel-alumel thermocouples (diameter 0.1 mm) mounted at the inlet and outlet of the probe.
It was assumed that heat lux is symmetrical with respect to the z-axis (plasma jet axis) and at any point is a function of r and z, i.e. the radial and axial distances, respectively, in cylindrical coordinates. Figure 2b show the approximation to the radial distribution of the heat lux density measured by the calorimetric probe used in the computational model.
The transversal plan of jet section was divided in k
concentric circles (Fig. 2b). Within each region, limited by circles, the heat lux per unit area is assumed to be constant (qj = const). Hatched parts of the probe on the Figure 2b correspond to the regions with qj = const: a realistic picture of the distribution is shown on the upper half of the probe, while on the bottom half – the distribution used in calculations is displayed. Thus, at position i,
the heat lux per unit length that entered to the probe is Qi=2 lijqj
j=i k
∑
, wherelij=
(
j2−i2+(
2j−1)
− j2−i2−(
2j−1)
)
ΔRis the extent of the probe with qj = const. Hence, a
column-vector of heat lux density is determined as q1, a
column-vector of the heat lux per unit length that enters to the probe as Q and the matrix of extents as L:
L=
l11 l12 ... l1k
0 l22 ... l2k
... ... ... ... 0 0 ... lkk
, (1)
We obtain a simple equation:
L⋅ql=Q . (2)
The experimental values of the total heat lux ( Qi
total
)
that enters to the probe at i-th position were calculated
as Qi tot =c
pm(Tout−Tin) , where cp is the speciic heat
of water,
m
is the mass low rate of the cooling water,(Tout – Tin) is the temperature increase of the water.
Thus, using the method of inverse matrix (Matsumo and Mieno, 2003), we obtain the radial heat lux density distribution.
In equation 2, it was assumed that the heat lux per unit area is constant along the extent
l
ij(Fig. 2). However, in transversal section (i.e. along the circle of the probe tube), the heat lux distribution is non-uniform. Suchdistribution is presented by (Auweter-Kurtz, M. et al, 2000), who gives a computed heat lux distribution around the cylindrical surface exposed to gas at 6000 K moving
in transverse direction at velocity M = 0.53. The surface
temperature of cylinder of 400 K, used in calculation, corresponds to our conditions of measurements. Figure 3 clearly displays a strong variation of q around the cylinder surface. The probe is most thermally loaded at stagnation point, whereas at the opposite point (i.e., at 180° in the Fig. 3) the heat lux density is four times less. In order
to obtain q in stagnation point (that is more important),
we assumed a uniform heat lux density distribution with
q = qmax = const applied only for a part of circumference of the calorimetric probe. Figure 3 shows that, for this particular case, the arc of the probe circumference must be limited by angle of Θ = 100 degrees. For other lux conditions, this angle is variable within the range of 80 to 110 degrees. Thus, we used Θ = 90° in our calculations.
Figure 3: Heat lux density distribution on the cylinder surface
q = f(θ) and equivalent heat lux for q = qmax = const Adapted from Auweter-Kurtz, M. et al, 2000.
A comparison of the heat flux obtained by such method was calculated by commonly used relationship based on Fay and Riddell’s equation, (Equation 3), where the enthalpy enters as parameter (Polezhaev and Shishkov, 1970).
Enthalpy probe technique
this oriice by suction and cooled inside the probe. The
enthalpy (h0) was then obtained by measuring the mass
low rate of sampling gas Ggas and the cooling water Gw
and the difference between the heat load on the probe cooling circuit under sampling and calibration (i.e. with
Ggas = 0) conditions:
h=Gwcp(ΔTs− ΔTc)
Gair +h0 , (3)
where ΔTs and ΔTc are the temperature rise if the
cooling water is under sampling and calibration low conditions; h0 enthalpy of the plasma gas at normal conditions.
Closing and opening of the sample channel was alternated in approximately 15 seconds. The measurement of the total pressure on the probe tip allows calculating the plasma velocity “v” as follows.
v= 2(p−p0) ρ0
(4)
where (p – p0) is the measured dynamic pressure and ρ0
is the local plasma density computed at the local plasma temperature.
The sample of target material was inserted in the graphite holder so that only the transverse area could be exposed to plasma jet. The surface temperature of the target material was controlled by varying the distance from the torch nozzle to the front surface of material sample and was measured by an optical pyrometer (model IR-AH 3SU-Chino). This distance was varied within the range of 0.06 to 0.14 m, in which the samples’ surface temperature (1697 – 1995) K attains a steady-state condition. The erosion rate was calculated as mass loss by area in unit time. For this calculation, the sample dimension and the mass were measured before and after the test. The time of high-temperature exposure of the material sample varied within the range of 40 to 180 s. The average values were taken from the results obtained by repeating the test with four samples under the same operational conditions.
As the target material, a high-density (1.83 x 10⁶ kg/m3)
synthetic graphite and C/C composite (GROUP-SNPE, France) with density 1.75 x 10⁶ kg/m3 were used and compared
in this work. The specimens were cut into cylindrical geometry, with outer diameter of 0.016 m and thickness of approximately 0.012 m. Thus, the area of the surface exposed to reactive plasma was kept at 2.04 x 10⁻⁶ m2.
RESULTS AND DISCUSSIONS
Figure 4 shows the radial distribution of the heat flux
density q(r) obtained at distances of 5, 30 and 50 mm
from the nozzle of the plasma torch. It is observed that, at small distances from the nozzle, there is a plateau-like profile with approximately constant heat flux density. This plateau (or core of flow) may be observed visually up to 30 mm distance, where the
heat flux on the axis q(r = 0) reduces drastically and
the distribution profile becomes narrower, as it can be
seen at z = 50 mm. The radial distribution of plasma
jet velocity at small distances from the torch nozzle also appears practically unchanged at small distances from the nozzle, as shown in Figure 5.
Figure 4: Radial distribution of the heat lux density q measured by calorimetric probe technique.
Figure 5: Radial distribution of the plasma jet velocity v
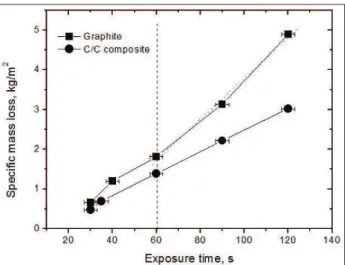
The typical surface temperature behavior at Z = 80 mm as a function of the exposure time is shown in Figure 6. The mass losses per unit area are depicted in Figure 7. The curves show that losses vary approximately proportionally to the exposure time. We observe that, for the same exposure time, the speciic mass loss for the graphite is considerably higher than for the C/C composite. In this experiment, the steady-state temperature of the material surface was about 1950 K for C/C composite and about 2000 K for graphite, within the range of the experimental data error (Fig. 6). At low heat lux densities, the temperature proiles for both graphite and C/C target are similar: a fast increase during initial stage of heating with subsequent saturation at certain temperature, which depends on the heat lux density.
Figure 8 shows the distribution of the heat lux density q
measured by the linear probe at the distance 80 mm from the nozzle and smoothed by itting. The maximum value of heat lux density is of 2.82 x 10⁶ W/m2 at the axis and
of 1.9 x 10⁶ W/m2 at the border of target. The mean value,
qmean, is 2.37 x 10⁶ W/m2. This mean value of heat lux is
obtained with transverse streamline of the linear probe of 3 mm diameter, thus its applicability has to be validated to represent the effective axial low on a target material (material sample) of 16 mm diameter.
Figure 8: Heat lux density q distribution as a function of jet radius at distance of 80 mm from the nozzle (hatched shape of 16 mm diameter corresponds to target dimension). Method used: calorimetric probe.
Figure 6: Surface temperature as a function of exposure time for graphite and C/C composite (Z = 80 mm). The error bars was obtained by statistical method.
Figure 7: Speciic mass loss as a function of exposure time for graphite and C/C composite. The vertical line stands for the beginning of the surface temperature saturation.
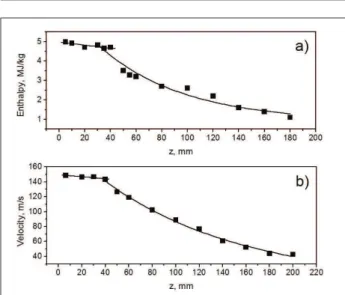
The measured enthalpy and the velocity of gas at the axis of plasma jet as a function of distance from the nozzle are shown in Figures 9a and 9b. At a distance of 80 mm, the measured enthalpy is 2.75 MJ/kg and the velocity is 100 m/s. Applying the well known simpliied version of the
Fay-Riddell relationship (Auweter-Kurtz, M. et al, 2000)
for the heat lux density incident on the target of 16 mm diameter, we obtain:
q=4.4 *10−4h Patm+ ρv2
2
Reff =4.4 *10−4* 2.75*106
101325+765.5
3.33*8*10−3 =2.368 MW/m
2
(5)
Where h is the enthalpy; Reff =0.33R is the effective
radius of the front face of target of radius R, according
to (Mezines and Masek, 1979); Patm is theatmospheric
pressure; ρ is the plasma density; v is the plasma velocity.
This result validated the applicability of the heat lux averaging.
10b, respectively. The speciic mass loss rate increases approximately linearly with the surface temperature for the C/C composite (Fig. 10a), while similarity to
an exponential growth for the graphite (Fig. 10b) is observed. The linear erosion rates were also somewhat different for these materials. Linear erosion rate for C/C
composite was in the range from 13 mm/s to 25 mm/s and
for graphite from 15 mm/s to 28 mm/s. This can also be
attributed to the difference in the conformation structure between them.
The temperature dependence of the mass loss of carbon material, used as target for the experiments, can be explained by the supposition that carbon atoms at high temperature and in contact with atomic oxygen are more likely detaching the surface by forming CO gas. Kinetics of such reaction is well defined (Hald, 2003). The exponential behavior of the curve of specific mass losses showed for graphite in Figure 10b can be explained as a consequence of an increasing of the whole particulate filler (petroleum coke) loss rate, which is enhanced by loosening bonds produced by erosion of binder carbon formed by graphitized pitches (Marsh, Forrest and Pacheco, 1981). These assumptions will be clearly understood by SEM analysis of the C/C composite and graphite surfaces exposed to reactive plasma.
The SEM micrographs (Fig. 11) show the eroded cross section and surface of graphite. They reveal a texture similar to those obtained by chromic acid attack, a special surface preparation, used for SEM analysis of carbon materials (Marsh, Forrest and Pacheco, 1981). This means that the ionized atoms of plasma act in a similar way of the ionic components of the chromic acid solution, removing preferentially the edge carbons of anisotropic portion from the bulky graphite surface. The remaining structures are, almost all, well oriented graphite lake-like portions, well exempliied in the micrograph of Figure 11b. The morphology of this plasma ion-attacked surface shows that the sets of mosaic structure carbon skeleton are the basis of this synthetic graphite illers structure (Marsh, Forrest and Pacheco, 1981).
Figure 9: (a) The enthalpy and (b) the velocity of the plasma at the axis of jet as a function of distance from the nozzle.
Figure 10: Speciic mass loss rates of carbon based materials: (a) C/C composite; (b) graphite.
The action of plasma on the edge carbons of graphitized materials can also be observed on C/C composites. The SEM micrographs in Figures 12 and 13 show the eroded surface of the C/C sample and also, for comparison, the non-eroded surface of the same sample. The comparative analysis indicates that the strong damaging effect was produced on the sample surface by reactive air plasma. The surfaces are now strongly roughened forming troughs and almost free carbon ibers bundles, whereas the non-eroded specimen shows a smooth surface. These micrographs also show that the matrix region of C/C composite presents earlier erosion in relation to the iber region, resulting in the exposure of loosely bonded ibers at the surface. More detailed analysis of the surface of this plasma attacked surface (Fig. 13) shows that, as observed in the surface of graphite specimen, ionic attack of C/C composite produces a preferred withdrawal of edge carbon of graphitized matrix, revealing an anisotropic lamellar structure of carbon as the last remaining part of the binder of iber. For both types of samples, the more rapid reaction promoted over the anisotropic carbon reveals the texture of a carbon skeleton formed by lamellar structure carbon.
ibers bundle axis, as illustrated by Figure 12b, due to the conditions that all carbon positioned at top of ibers present almost the same characteristics, namely edge carbon of basal plane, the erosion rate of them is almost the same, while the binder carbon is transformed in gas. This is the reason to form relatively homogeneous and planar surface proile ibers, or even slightly depressing at the core ibers of each bundle. Moreover, if the plasma jet is directed to shine the ibers longitudinal surface, as shown in Figure 12d, the corrosion occurs always from the iber localized at surface toward one localized at the middle of the bundle. It is also observed that the corrosion occurs from outermost to inner shell of iber, probably starting at some structure defects where the higher concentrations of edge carbon are present, and this mechanism leads to the formation of very well sharpen arrow-type ibers or even the formation of iber island bonded to the bundle by shadowed non-corroded binders. These results show that the ibers directed in parallel to the axis of oncoming low of oxidative plasma and perpendicularly to the material surface are more corrosion-resistant than ibers positioned along the surface, mainly due to the more homogeneous effects of corrosion along the direction perpendicular to the surface .
It is important to notice that the SEM analyses were performed over the samples which already presented almost half of its original thickness (in direction against the plasma jet direction). This means that the microscopically analyzed surface is not one produced only by fresh plasma contact. It has to be pointed out that the high temperature thermal effect over the bulk of sample is also an important factor on the total erosion produced on the samples.
CONCLUSIONS
This paper presented a stationary experiment performed to study the degradation of carbon-based materials by its immersion in reactive air plasma jet generated by a DC plasma torch with gas enthalpies comparable to those Figure 12: SEM of C/C composite: (a) Non-eroded surface of
ibers bundles region (transversal view); (b) eroded surface of ibers bundle region (transversal view) at 2009 K; (c) Non-eroded surface of ibers bundle region (longitudinal view), and (d) eroded surface of ibers bundle region (longitudinal view) at 2009 K.
Another important fact observed by SEM analysis is the anisotropic corrosion effects produced on carbon ibers as function of plasma jet direction related to iber axis. If the incident plasma beam is directed parallel to the
encountered during motion in earth’s atmosphere at Mach numbers from 7 to 10. For a distance of 80 mm between the specimen surface and the torch tip, the steady-state temperature of the C/C composite target surface was
of 1994 K and the heat lux was about 2.4 MW/m2. The
degradation of the material, as consequence of oxidative corrosion processes, was studied and useful information was obtained for global mass loss as well as for microscopic damages. The experiments show that the mass loss per unit area is approximately proportional to the exposure time and depends strongly on the temperature of the material surface. The mass erosion rate for graphite is appreciably higher than for C/C composite, probably due to their granular structure, which allows, at certain test time, losses of big amount of particles of iller as a consequence of weakening of bonds by erosion of graphitized binders. This effect leads to exponential dependence of mass loss of graphite as a function of test temperature in comparison to the linear growth of erosion for C/C composite. It was possible to show that the matrix region of C/C composite is eroded at rate noticeably higher than the iber region, and also that this erosion of matrix is preferentially performed over edge atoms of anisotropic carbon structure, as a consequence of ionic attack of the carbon surface. The plasma torch testing indicated that the tested C/C composite has ablation resistance that allows its consideration as perspective candidate for the heat shielding and rocket nozzle design.
ACKNOWLEDGEMENTS
The authors thank to the Brazilian Space Agency, to Fundação de Amparo à Pesquisa do Estado de São Paulo (FAPESP) and to Coordenação de Aperfeiçoamento de Pessoal de Nível Superior (CAPES) for inancial support, and to Instituto de Aeronáutica e Espaço for the provision of C/C composite and graphite samples.
REFERENCES
Auweter-Kurtz, M. et al, 2000, “Measurement Techniques
for High Enthalpy and Plasma Flows” Available at: http:// www.rta.nato.int/Pubs/RDP.asp?RDP=RTO-EN-008.
Barros, E.A., 2008, “Plasma térmico para ablação de materiais utilizados como escudo de proteção térmica em sistemas aeroespaciais”, PhD Thesis, Instituto Tecnológico de Aeronáutica.
Cho, D., Yoon, B., 2001, “Microstructural interpretation of the effect of various matrices on the ablation properties of carbon-iber-reinforced composites”, Composites Sci. and Technol, Vol. 61, No. 2, pp. 271-280.
Dresvin, S.V., 1972, “Physics and techniques of low temperature plasma”, Moscow: Atomizdat (in Russian).
Fujimoto, K., Shioya, T., Satoh, K., 2003, “Degradation of carbon-based materials due to impact of high-energyatomic oxygen”, International Journal of Impact Engineering, No. 28, pp. 1-11.
Hald, H., 2003, “Operational limits for reusable space transportation systems due to physical boundaries of C/
SiC materials”, Aerospace Sci. and Technol, Vol. 7, No. 7,
pp. 551-559.
Lochte-Holtgreven, W., 1968, “Plasma diagnostics”. Amsterdam: North-Holland Publishing Company, Amsterdam.
Marsh, H., Forrest, M., Pacheco, L.A., 1981, “Structure in metallurgical cokes and carbons as studied by etching
with atomic oxygen and chromic acid”, Fuel, Vol. 60, No.
5, pp. 423-428.
Matsumo, N., Mieno, T., 2003, “Characteristics of heat lux of JxB gas-arc discharge for the production of
fullerenes”, Vacuum, Vol. 69, No. 4, pp. 557-562.
Mezines, S.A., Masek, R.V., 1979, “Heat shield material tests in a simulated Jovian entry heating environment”, AIAA, Paper No. 79-0037, presented at 17th Aerospace Sciences Meeting, New Orlean.
Park, J.K., Kang, T.J., 2002, “Thermal and ablative properties of low temperature carbon iber-phenol
formaldehyde resin composites”, Carbon, Vol. 40, No. 12,
pp. 2125-2134.
Patton, R.D. et al., 2002, “Ablation, mechanical and
thermal conductivity properties of vapor grown carbon iber/phenolic matrix composites”, Applied Sci. and
Manufacturing, Vol. 33, No. 2, pp. 243-251.