results of the EpiFloripa Idoso cohort study
doi: 10.5123/S1679-49742017000200008
Correspondence:
Susana Cararo Confortin – Universidade Federal de Santa Catarina, Programa de Pós-Graduação em Saúde Coletiva, Campus Reitor João David Ferreira Lima, s/n, Trindade, Florianópolis-SC, Brasil. CEP: 88040-900
E-mail: [email protected]
Abstract
Objective: to identify sociodemographic, behavioral and health changes in a follow-up of participants in the health survey EpiFloripa Idoso. Methods: this is a population-based longitudinal study with elderly individuals in Florianópolis-SC, Brazil. Results: 1,702 elderly individuals were interviewed in 2009-2010 and 1,197 in 2013-2014 (response rate: 89.1% and 70.2%, respectively); among followed-up individuals, most of them remained with a partner (53.4%), living with other people (76.0%), not working (78.0%), with positive health perception (44.0%), not using the Internet (67.5%), not smoking (57.5%), not consuming alcohol (53.3%), not physically active (56.3%), consuming <5 servings of fruits/vegetables (57.3%), independent (60.5%), overweight (47.0%), with negative screening for cognitive impairment (69.4%), with no depressive symptoms (72.0%) and not having suffered falls (60.6%). Conclusion: most elderly did not show significant changes in their sociodemographic, behavioral and health characteristics; the need to rethink more effective actions to improve the elderly health stands out.
Keywords: Health of the Elderly; Aged; Aging; Longitudinal Studies.
Susana Cararo Confortin1
Ione Jayce Ceola Schneider2
Danielle Ledur Antes1
Francieli Cembranel1
Lariane Mortean Ono3
Larissa Pruner Marques1
Lucélia Justino Borges4
Rodrigo de Rosso Krug3
Eleonora d’Orsi1
1Universidade Federal de Santa Catarina, Programa de Pós-Graduação em Saúde Coletiva, Florianópolis-SC, Brasil 2Universidade Federal de Santa Catarina, Programa de Pós-Graduação em Ciências da Reabilitação, Araranguá-SC, Brasil
3Universidade Federal de Santa Catarina, Programa de Pós-Graduação em Ciências Médicas, Florianópolis-SC, Brasil 4Universidade Federal do Paraná, Departamento de Educação Física, Curitiba-PR, Brasil
Introduction
The accelerated process of population ageing observed in Brazil from the 1960s1 brought an important impact
on society. Especially on health care, this impact is not restricted to increased morbidity among the elderly, it also implicates a reduction in physical function and independence of these people in the development of their daily activities.2
Identification and understanding of the determinants and etiological factors of ageing healthy – whether related to conditions and socioeconomic inequalities, individual characteristics (biological, psychological, genetic) or behavioral, physical environment, access and use of health services including , cultural and gender differences3 become essential to subsidize the planning
of health care policies for the elderly population.
The extension of existence can only be considered a human achievement as far as it adds quality to the additional years of life, even for individuals who have some degree of weakness or disability, or that require some kind of special care.3 As the
political framework "Active Aging" highlights, actions aimed at elderly population should enhance health, personal safety and continuous participation of the elderly in social, economic, cultural, and civil issues as a whole.3
Under this principle, it is important to undertake longitudinal research with the elderly, outlined in order to enable causal inference, in addition to checking the individual changes, and follow the evolution of ageing.4
The results of such studies can assist the development of health policies for the elderly.3 In such a context, it was
proposed a research project to evaluate, and monitor the health conditions of the urban elderly population of Florianópolis city.
The objective of the present study was to identify sociodemographic, behavioral and health changes in a follow-up period of participants in the health survey EpiFloripa Idoso.
Methods
Data from this study are related to the project "Health Conditions of the Elderly in Florianópolis", named EpiFloripa Idoso (www.epifloripa.ufsc.br). This is a longitudinal, population-based and household study, conducted with elderly (60 years or more) residents in the urban area of Florianópolis city, Santa Catarina state, Brazil. The baseline data collection of the study took place from September 2009 to June 2010; and the follow-up, from November 2013 to November 2014.
Florianópolis is the capital of the State of Santa Catarina and lies on the coast. According to the Census of 2010, the city's population was of 421,239 inhabitants, 11.4% of them were 60 years old or older.5 With a local
human development index (IDHM) of 0.847 in 2010.6
Florianópolis is in third position amongst the Brazilian cities, and the first amongst the capitals, at a high level of human development.
The estimate size of the sample was carried out with Epi Info version 6.04, based on the calculation of prevalence, according to population size parameters (44,460), confidence level of 95%, unknown prevalence of the phenomenon (50%), sampling error (4 percentage points), effect of sample design (estimated at 2), plus 20% for estimated losses and 15% for association studies. This resulted in a minimum sample of 1,599 individuals. As a result of the effect of design and financial availability, the sample was expanded to 1,911 elderly people.
The selection of the baseline sample was performed by clusters, in two stages: first, the census tracts, and second, the households. In the first stage of selection, from 420 urban census tracts of Florianópolis, 80 were drawn systematically, which corresponded to 8 tracts from each decile of average monthly income of the head of the family according to data from the Brazilian Institute of Geography and Statistics (IBGE), (R$192.80 - R$13,209.50). In the second stage, the households were drawn. To this end, the amount of households, and the record of permanently occupied residential addresses (excluding business addresses, abandoned buildings etc.) were updated. The number of households ranged from 61 to 725. In order to reduce the coefficient of variation from 52.7% (n = 80 tracts) to 35.2% (n = 83 tracts), we performed the grouping of small tracts, according to geographical location, related income decile, and the subdivision of very large sectors. According to the 2000 Census, the average number of
Identification and understanding of the
residents per household in Florianópolis amounted to 3.1; and the age group of interest, approximately 11% of the population, leading to one elderly in every three households, per census tract, on average. Thus, we estimated a visit to 60 households per tract, which were drawn systematically from the list of generated addresses after updating the households per sector, to found 20 elderly people.
Institutionalized elderly (residing in nursing homes, hospitals, prisons) were excluded from the baseline; and from the follow-up, those identified by the study as duplicated (erroneously registered twice in the database), and those with incompatible age participating in the study (an individual with less than 60 years old, interviewed in the baseline by mistake).
In these two parts of the study, the losses corresponded to the elderly not located after four visits in different periods; and the refusals when expressed in person, after a visit to the household and an attempt to interview. During the follow-up, the elderly who had moved out from town or were admitted to hospitals were also considered losses. The fatalities were identified by the database of the Mortality Information System of Santa Catarina state. We included all death that occurred notified from 2009 to 2013, at the beginning and at the end of the cycle of interviews of the follow-up, with 2014 updated data preview through probabilistic linkage of records7 by
the OpenRecLink® (http://reclink.sourceforge.net/). After excluding deaths, we sent letters to elderly citizens, informing them about the new interview, and conduct the telephone contact to update the registration data; and when this communication was not possible, the team sought to update the register via InfoSaúde System (health system of the municipality), social networks, phone book, contact with neighbors, relatives and/or friends.
Data were collected through face-to-face interview applied by previously trained interviewers, with the aid of Personal Digital Assistants (baseline) and netbook (follow-up). In standardized questionnaires we used, preferably, validated instruments, and tested in pilot studies applied along the 99 individuals in the baseline, and 76 individuals on the follow-up. Data consistency was checked weekly; and quality control, conducted by the application, by telephone, of a questionnaire reduced to approximately 10% of respondents, randomly selected. The reproducibility of the questions presented satisfactory to good concordance (at baseline, Kappa index between 0.6 and 0.9; and at follow-up, between 0.5 and 0.9).
The variables described below refer to data collected at baseline and at follow-up. The sociodemographic characteristics considered were the following: - sex (female; male);
- age (in years: 60 to 69; 70 to 79; 80 or more); - family income per capita in minimum wages (MW)
at the time of the interview8 (
≤ 1 MW; 1 to 3 MW ; >3 to 5 MW; >5 to 10 MW; >10 MW);
- education level (without formal education level; 1 to 4 years; 5 to 8 years; 9 to 11 years; 12 or more years); - family arrangement (living accompanied; living alone); - marital status (married; single; divorced; widowed); - respondent (elderly; informant);
- existence of caregiver (no; yes);
- paid work, at the time of the interview (no; yes); and - self-rated health (very good; good; average; poor;
very poor).
The behavioral characteristics considered were: - Internet use (no; yes);
- smoking (never smoked; former smoker but stopped; smoker);
- frequency of alcohol intake, defined by the first three questions of the Alcohol Use Disorders Identification Test (AUDIT)9 (never [never consumes alcoholic beverages];
moderate [consumes up to a dose of alcohol in an ordinary day and never consumes 5 or more drinks on a single occasion]; high [consumes more than 2 doses in a normal day or 5 or more drinks on a single occasion]); - leisure-time physical activity (International Physical Activity Questionnaire)10 (0 to 149 minutes/week [physically
inactive]; ≥ 150 minutes/week [physically active]; and - daily consumption of fruits and vegetables11 (<5
servings; ≥ 5 servings)
Concerning health conditions, we measured the following:
- weight and stature of the participants;
- nutritional status, by body mass index (BMI)12 (normal;
low weight; overweight);
- cardiovascular risk, estimated by the waist circumference13
(normal; increased; increased substantially); - dependence in daily activities of life14 (none; 1 to 3;
4 or more);
- screening for cognitive deficit, investigated by the mini-mental state examination of Folstein15 (negative;
positive);
- depressive symptoms, investigated by the Geriatric Depression Scale (GDS-15)16 (normal; suspicion
- falls in the last year (no; yes); and - morbidities (none; 1 to 2; 3 or more)
The following self-reported diseases were also investigated, independently:
- back pain (no; yes);
- arthritis or rheumatism (no; yes); - diabetes (no; yes);
- cancer (no; yes);
- bronchitis or asthma (no; yes); - hypertension (no; yes);
- cardiovascular disease (no; yes);
- stroke or cerebral infarction (no; yes); and - kidney disease (no; yes)
We evaluated the changes between the two parts of the study (2009-2010 and 2013-2014) concerning sociodemographic, health behaviors, and health conditions variables, checking how many elderly people had remained in the same category of the baseline, and when they had moved – and to which category they had moved.
In the analysis, we considered the design effect and the sample weights. Data were presented in absolute and relative frequencies (%) and confidence intervals of 95% (CI95%). We used Pearson's chi-square test for comparison between the losses/refusals, interviews, and deaths, and established the value of statistical significance in 5%. All analyses were conducted by the software Stata/SE 13 for Windows (Stata Corp., College Station, United States of America).
EpiFloripa Idoso has been approved by the Ethics Research Committee with Human Beings (CEPSH) at the Federal University of Santa Catarina (UFSC): the baseline, under the Protocol no. 352/2008, on December 2008; and the follow-up, under the CAAE 16731313.0.0000.0121, on July 8th, 2013. All respondents were given the necessary explanations on the research procedures, before they were asked and decided to participate in the study, by signing the Free Informed Term of Consent.
Results
We interviewed 1,705 elderly people in the baseline (response rate of 89.1%). In the follow-up, 1,197 were interviewed (response rate: 70.2%), 217 died, 162 represented losses, and there were 129 refusals, 3 were excluded, 2 due to duplicity and 1 due to age incompatible on the baseline. The median age of the baseline respondents was 70 years old (age range: from 60 to 104); and the median age of the follow-up, 73 years old (age range: from 63 to 107).
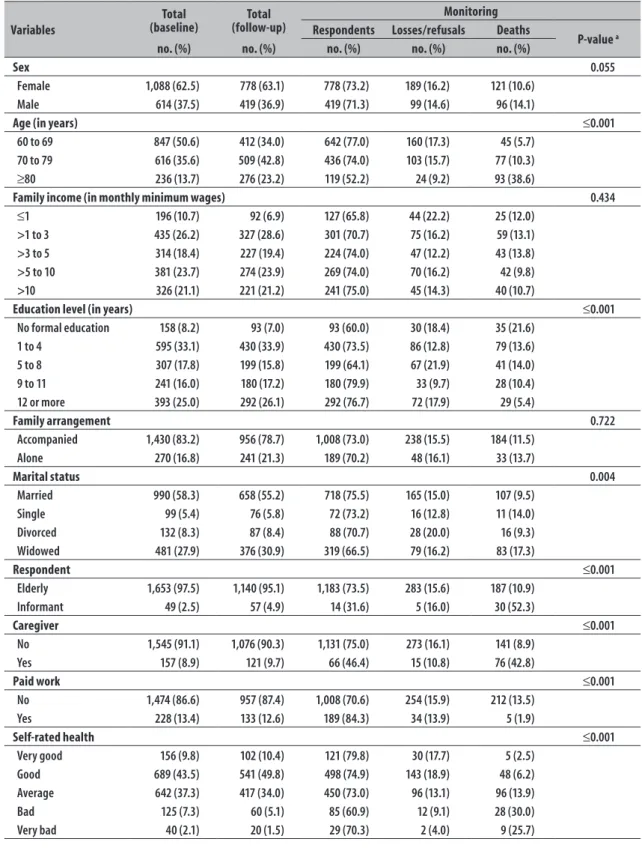
Table 1 presents sociodemographic characteristics and self-rated health samples of the baseline and follow-up. The two assessments involved, predominantly, female, age up to 69 years, income from 1 to 3 minimum wages, 1 to 4 years of study at school, living accompanied, married, no caregiver, not working, and evaluating their health as very good/good.
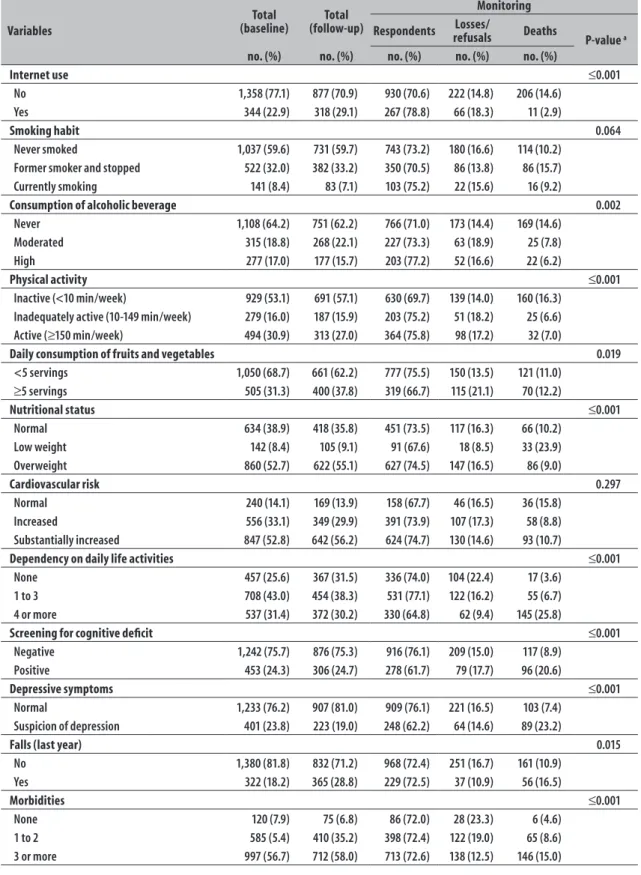
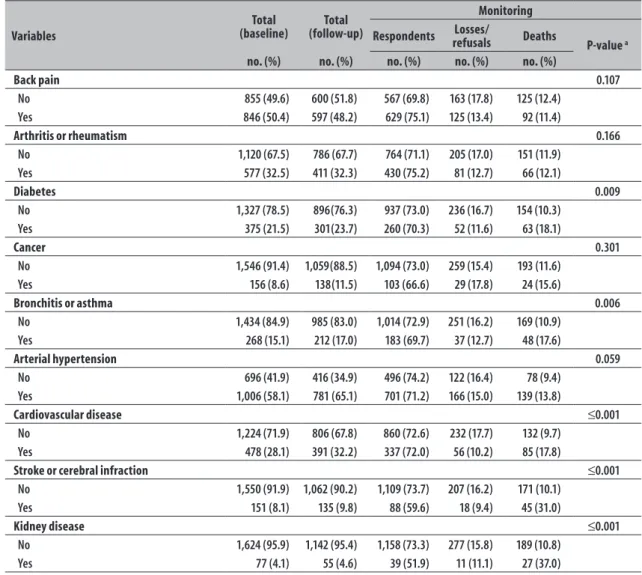
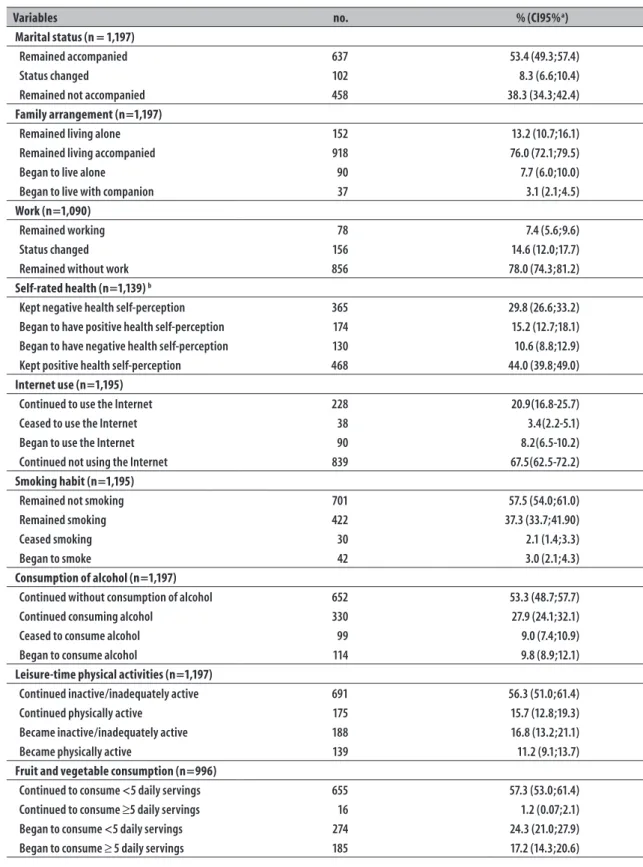
Still on Table 1, the distribution of the elderly people interviewed, loss/refusals and deaths during the follow-up can be observed. It was not observed statistically significant differences regarding the status of the follow-up according to sex, family income in minimum wages, family arrangement, smoking, cardiovascular risk, column or back disease, arthritis or rheumatism, cancer and hypertension. The proportion of respondents was significantly lower (and the proportion of deaths was significantly higher) for elderly with higher age, less educated, widowed, whose interviews were answered by informants, having a caregiver, who did not work anymore, with poor self-rated health, which did not use the Internet, who did not consume alcohol, inactive, consuming less than 5 servings of fruits and vegetables per day, with low weight, depending on others for 4 or more activities of daily life, with positive screening for cognitive deficit, with depressive symptoms, who had suffered a fall in the previous year, with the highest number of morbidities, who reported diabetes, bronchitis or asthma, cardiovascular disease, stroke or cerebrovascular accident, or kidney disease. Regarding the conditions observed between baseline and follow-up, presented in Table 2, most remained with companion (53.4%), remained living accompanied (76.0%), remained not working (78.0%), with positive self-rated (45.0%), not using the Internet (67.5%), not smoking (57.5%), not consuming alcoholic beverage (53.3%), physically inactive (56.3%), with fruits and vegetables consumption of <5 servings per day (57.3%), overweight (47.0%), without dependency (60.8%), with negative screening for cognitive deficit (69.4%), without depressive symptoms (72.0%), and without falls in the previous year (60.6%).
Table 1 – Descriptive analysis of the sample according to the status of EpiFloripa Idoso health survey, in the city of Florianopolis, SC state, 2009-10 and 2013-14
Variables
Total (baseline)
Total (follow-up)
Monitoring Respondents Losses/refusals Deaths
P-value a
no. (%) no. (%) no. (%) no. (%) no. (%)
Sex 0.055
Female 1,088 (62.5) 778 (63.1) 778 (73.2) 189 (16.2) 121 (10.6)
Male 614 (37.5) 419 (36.9) 419 (71.3) 99 (14.6) 96 (14.1)
Age (in years) ≤0.001
60 to 69 847 (50.6) 412 (34.0) 642 (77.0) 160 (17.3) 45 (5.7)
70 to 79 616 (35.6) 509 (42.8) 436 (74.0) 103 (15.7) 77 (10.3)
≥80 236 (13.7) 276 (23.2) 119 (52.2) 24 (9.2) 93 (38.6)
Family income (in monthly minimum wages) 0.434
≤1 196 (10.7) 92 (6.9) 127 (65.8) 44 (22.2) 25 (12.0)
>1 to 3 435 (26.2) 327 (28.6) 301 (70.7) 75 (16.2) 59 (13.1)
>3 to 5 314 (18.4) 227 (19.4) 224 (74.0) 47 (12.2) 43 (13.8)
>5 to 10 381 (23.7) 274 (23.9) 269 (74.0) 70 (16.2) 42 (9.8)
>10 326 (21.1) 221 (21.2) 241 (75.0) 45 (14.3) 40 (10.7)
Education level (in years) ≤0.001
No formal education 158 (8.2) 93 (7.0) 93 (60.0) 30 (18.4) 35 (21.6)
1 to 4 595 (33.1) 430 (33.9) 430 (73.5) 86 (12.8) 79 (13.6)
5 to 8 307 (17.8) 199 (15.8) 199 (64.1) 67 (21.9) 41 (14.0)
9 to 11 241 (16.0) 180 (17.2) 180 (79.9) 33 (9.7) 28 (10.4)
12 or more 393 (25.0) 292 (26.1) 292 (76.7) 72 (17.9) 29 (5.4)
Family arrangement 0.722
Accompanied 1,430 (83.2) 956 (78.7) 1,008 (73.0) 238 (15.5) 184 (11.5)
Alone 270 (16.8) 241 (21.3) 189 (70.2) 48 (16.1) 33 (13.7)
Marital status 0.004
Married 990 (58.3) 658 (55.2) 718 (75.5) 165 (15.0) 107 (9.5)
Single 99 (5.4) 76 (5.8) 72 (73.2) 16 (12.8) 11 (14.0)
Divorced 132 (8.3) 87 (8.4) 88 (70.7) 28 (20.0) 16 (9.3)
Widowed 481 (27.9) 376 (30.9) 319 (66.5) 79 (16.2) 83 (17.3)
Respondent ≤0.001
Elderly 1,653 (97.5) 1,140 (95.1) 1,183 (73.5) 283 (15.6) 187 (10.9)
Informant 49 (2.5) 57 (4.9) 14 (31.6) 5 (16.0) 30 (52.3)
Caregiver ≤0.001
No 1,545 (91.1) 1,076 (90.3) 1,131 (75.0) 273 (16.1) 141 (8.9)
Yes 157 (8.9) 121 (9.7) 66 (46.4) 15 (10.8) 76 (42.8)
Paid work ≤0.001
No 1,474 (86.6) 957 (87.4) 1,008 (70.6) 254 (15.9) 212 (13.5)
Yes 228 (13.4) 133 (12.6) 189 (84.3) 34 (13.9) 5 (1.9)
Self-rated health ≤0.001
Very good 156 (9.8) 102 (10.4) 121 (79.8) 30 (17.7) 5 (2.5)
Good 689 (43.5) 541 (49.8) 498 (74.9) 143 (18.9) 48 (6.2)
Average 642 (37.3) 417 (34.0) 450 (73.0) 96 (13.1) 96 (13.9)
Bad 125 (7.3) 60 (5.1) 85 (60.9) 12 (9.1) 28 (30.0)
Very bad 40 (2.1) 20 (1.5) 29 (70.3) 2 (4.0) 9 (25.7)
Table 1 – Continuation
Variables
Total (baseline)
Total (follow-up)
Monitoring
Respondents refusalsLosses/ Deaths
P-value a
no. (%) no. (%) no. (%) no. (%) no. (%)
Internet use ≤0.001
No 1,358 (77.1) 877 (70.9) 930 (70.6) 222 (14.8) 206 (14.6)
Yes 344 (22.9) 318 (29.1) 267 (78.8) 66 (18.3) 11 (2.9)
Smoking habit 0.064
Never smoked 1,037 (59.6) 731 (59.7) 743 (73.2) 180 (16.6) 114 (10.2)
Former smoker and stopped 522 (32.0) 382 (33.2) 350 (70.5) 86 (13.8) 86 (15.7)
Currently smoking 141 (8.4) 83 (7.1) 103 (75.2) 22 (15.6) 16 (9.2)
Consumption of alcoholic beverage 0.002
Never 1,108 (64.2) 751 (62.2) 766 (71.0) 173 (14.4) 169 (14.6)
Moderated 315 (18.8) 268 (22.1) 227 (73.3) 63 (18.9) 25 (7.8)
High 277 (17.0) 177 (15.7) 203 (77.2) 52 (16.6) 22 (6.2)
Physical activity ≤0.001
Inactive (<10 min/week) 929 (53.1) 691 (57.1) 630 (69.7) 139 (14.0) 160 (16.3)
Inadequately active (10-149 min/week) 279 (16.0) 187 (15.9) 203 (75.2) 51 (18.2) 25 (6.6)
Active (≥150 min/week) 494 (30.9) 313 (27.0) 364 (75.8) 98 (17.2) 32 (7.0)
Daily consumption of fruits and vegetables 0.019
<5 servings 1,050 (68.7) 661 (62.2) 777 (75.5) 150 (13.5) 121 (11.0)
≥5 servings 505 (31.3) 400 (37.8) 319 (66.7) 115 (21.1) 70 (12.2)
Nutritional status ≤0.001
Normal 634 (38.9) 418 (35.8) 451 (73.5) 117 (16.3) 66 (10.2)
Low weight 142 (8.4) 105 (9.1) 91 (67.6) 18 (8.5) 33 (23.9)
Overweight 860 (52.7) 622 (55.1) 627 (74.5) 147 (16.5) 86 (9.0)
Cardiovascular risk 0.297
Normal 240 (14.1) 169 (13.9) 158 (67.7) 46 (16.5) 36 (15.8)
Increased 556 (33.1) 349 (29.9) 391 (73.9) 107 (17.3) 58 (8.8)
Substantially increased 847 (52.8) 642 (56.2) 624 (74.7) 130 (14.6) 93 (10.7)
Dependency on daily life activities ≤0.001
None 457 (25.6) 367 (31.5) 336 (74.0) 104 (22.4) 17 (3.6)
1 to 3 708 (43.0) 454 (38.3) 531 (77.1) 122 (16.2) 55 (6.7)
4 or more 537 (31.4) 372 (30.2) 330 (64.8) 62 (9.4) 145 (25.8)
Screening for cognitive deficit ≤0.001
Negative 1,242 (75.7) 876 (75.3) 916 (76.1) 209 (15.0) 117 (8.9)
Positive 453 (24.3) 306 (24.7) 278 (61.7) 79 (17.7) 96 (20.6)
Depressive symptoms ≤0.001
Normal 1,233 (76.2) 907 (81.0) 909 (76.1) 221 (16.5) 103 (7.4)
Suspicion of depression 401 (23.8) 223 (19.0) 248 (62.2) 64 (14.6) 89 (23.2)
Falls (last year) 0.015
No 1,380 (81.8) 832 (71.2) 968 (72.4) 251 (16.7) 161 (10.9)
Yes 322 (18.2) 365 (28.8) 229 (72.5) 37 (10.9) 56 (16.5)
Morbidities ≤0.001
None 120 (7.9) 75 (6.8) 86 (72.0) 28 (23.3) 6 (4.6)
1 to 2 585 (5.4) 410 (35.2) 398 (72.4) 122 (19.0) 65 (8.6)
3 or more 997 (56.7) 712 (58.0) 713 (72.6) 138 (12.5) 146 (15.0)
Table 1 – Conclusion
Variables
Total (baseline)
Total (follow-up)
Monitoring
Respondents refusalsLosses/ Deaths
P-value a
no. (%) no. (%) no. (%) no. (%) no. (%)
Back pain 0.107
No 855 (49.6) 600 (51.8) 567 (69.8) 163 (17.8) 125 (12.4)
Yes 846 (50.4) 597 (48.2) 629 (75.1) 125 (13.4) 92 (11.4)
Arthritis or rheumatism 0.166
No 1,120 (67.5) 786 (67.7) 764 (71.1) 205 (17.0) 151 (11.9)
Yes 577 (32.5) 411 (32.3) 430 (75.2) 81 (12.7) 66 (12.1)
Diabetes 0.009
No 1,327 (78.5) 896(76.3) 937 (73.0) 236 (16.7) 154 (10.3)
Yes 375 (21.5) 301(23.7) 260 (70.3) 52 (11.6) 63 (18.1)
Cancer 0.301
No 1,546 (91.4) 1,059(88.5) 1,094 (73.0) 259 (15.4) 193 (11.6)
Yes 156 (8.6) 138(11.5) 103 (66.6) 29 (17.8) 24 (15.6)
Bronchitis or asthma 0.006
No 1,434 (84.9) 985 (83.0) 1,014 (72.9) 251 (16.2) 169 (10.9)
Yes 268 (15.1) 212 (17.0) 183 (69.7) 37 (12.7) 48 (17.6)
Arterial hypertension 0.059
No 696 (41.9) 416 (34.9) 496 (74.2) 122 (16.4) 78 (9.4)
Yes 1,006 (58.1) 781 (65.1) 701 (71.2) 166 (15.0) 139 (13.8)
Cardiovascular disease ≤0.001
No 1,224 (71.9) 806 (67.8) 860 (72.6) 232 (17.7) 132 (9.7)
Yes 478 (28.1) 391 (32.2) 337 (72.0) 56 (10.2) 85 (17.8)
Stroke or cerebral infraction ≤0.001
No 1,550 (91.9) 1,062 (90.2) 1,109 (73.7) 207 (16.2) 171 (10.1)
Yes 151 (8.1) 135 (9.8) 88 (59.6) 18 (9.4) 45 (31.0)
Kidney disease ≤0.001
No 1,624 (95.9) 1,142 (95.4) 1,158 (73.3) 277 (15.8) 189 (10.8)
Yes 77 (4.1) 55 (4.6) 39 (51.9) 11 (11.1) 27 (37.0)
a) Pearson chi-square test.
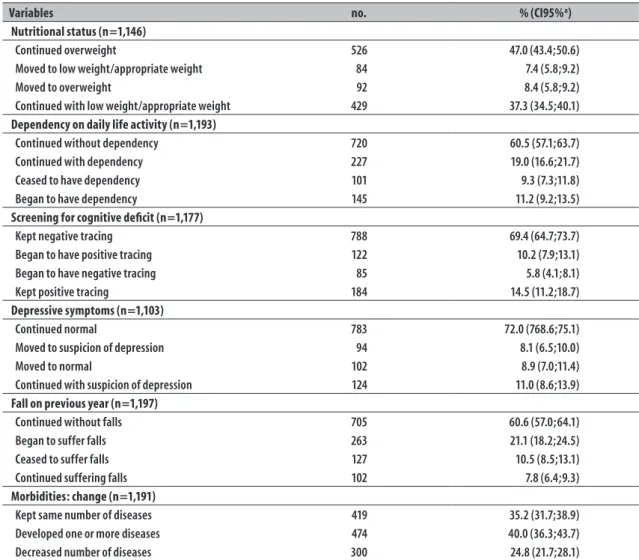
deficit, 8.1% ran into suspicion of depression, and 21.1% fell. Besides, regarding the first reply recorded in the baseline research, 24.8% of the elderly reported, at the time of follow-up, fewer diseases, 10.6% had come to evaluate their own health as worse, 11.2% had become physically active, 24.3% had reduced the consumption of fruits and vegetables, 9.8% began to consume alcohol, 5.8% no longer presented positive screening for cognitive deficit, and 9.3% no longer reported dependency in activities of daily life.
Discussion
Based on the results, it was possible to observe that, after four years of follow-up, most of the elderly did
physical inactivity, unhealthy diet and overweight.17 We
highlight that, in spite of having found a reduction in the number of self-reported NCD between some of the elderly, the increase in number of those morbidities was over 40.0%.
It was also possible to observe the preservation of the high percentage of elderly with daily fruit and vegetable consumption fall short of the recommendations of the World Health Organization (WHO),11 in addition
to their report of being inadequately active and, most of them, being overweight. As noted by WHO,11
most cases of chronic diseases would be possible to present through the adoption of some measures, such as a regular combined consumption of fruits and vegetables more than five servings/day, a regular practice of physical activity, and a reduction in weight.
Despite these recommendations and the existence of other measures in Florianópolis, such as the Floripa Ativa Programme,18 focused on health promotion and
prevention of chronic degenerative diseases among residents of the city, the results of this study indicate that such initiatives may still be insufficient for the elderly population. The concern with that scenario is justified: at higher ages, the NCD exert important deleterious impact on health, reducing functional and cognitive capacity.19
Regarding the dependency on performing daily life activities, the proportion of elderly people with independency was the highest, from the first to the second evaluation. We believe that a possible explanation for this finding is in survival bias, since the disability was associated with increased risk of mortality and, thus, may have reduced the share of elderly people with dependence due to death.20 Mortality
among elderly people with dependence on 4 or more activities was 25.8%, compared to 3.6% among those without dependency.20 Moreover, the percentage of
elderly people who become dependents (11.2%) was very close to the same percentage of whom were no longer dependents (9.3%), featuring a balance in this status changing.
Though most respondents reported not using the Internet, the proportion of those who make use of this communication tool has risen 8.2%, indicating that this population lives a digital inclusion process. Other inquiries shows that elderly Internet users maintain a healthier lifestyle,21,22 demonstrating enhanced
cognitive23 and functional21 capacity.
The positive self-rated health increased by 15.2%, and 44% of the elderly kept this perception, a fact that may have contributed to their higher independence and autonomy.24 Internet use provides digital inclusion,
especially important for the elderly, which may reflect positively on the adoption of healthy habits,22 higher
self-esteem, greater self-confidence and mental health benefits,25 contributing to health maintenance and/
or improvement.
Especially in terms of mental health, most of the respondents remained without cognitive deficit and without suspicion of depression, between both evaluations. Similar results were observed in longitudinal research on the elderly in the city of Juiz de Fora, Minas Gerais state,26 in which most of them remained
free from depressive symptoms after 16 months of follow-up. Nevertheless, it is worth noting that 8.1% of the elderly began to show symptoms of depression, and 10.2% began to present possible cognitive deficit, between the baseline and the follow-up of the study. Such results raise the attention of public managers and health professionals, and the need for clinical investigations aiming early diagnosis of both conditions, seeking to avoid the negative impact of these diseases on the quality of life of the elderly population.
Falling have also been a source of much concern for global public health, as its prevalence tends to increase with age, and its consequences assume greater significance.27 Although most of the elderly have not
mentioned falls during the assessments of this study, 21.1% began to suffer these accidents. Regardless of institutions, such as WHO and the Ministry of Health, have been addressing this issue, the number of falls among the elderly has increased.27 The design and
implementation of more effective action strategies, educational and informative campaigns in different areas of the community, may suit a democratization of prevention, planning and construction or adaptation of accessible environments not only for the elderly but also to the general society. A good example of these actions is the Health Handbook (Caderneta da Saúde),18
distributed by Capital Idoso from Florianópolis, with various instructions on healthy habits, including measures for preventing falls.
Table 2 – Changes in sociodemographic, behavioral variables and health conditions of the elderly in EpiFloripa Idoso health survey, in the city of Florianopolis, SC, 2009-10 and 2013-14
Variables no. % (CI95%a)
Marital status (n = 1,197)
Remained accompanied 637 53.4 (49.3;57.4)
Status changed 102 8.3 (6.6;10.4)
Remained not accompanied 458 38.3 (34.3;42.4)
Family arrangement (n=1,197)
Remained living alone 152 13.2 (10.7;16.1)
Remained living accompanied 918 76.0 (72.1;79.5)
Began to live alone 90 7.7 (6.0;10.0)
Began to live with companion 37 3.1 (2.1;4.5)
Work (n=1,090)
Remained working 78 7.4 (5.6;9.6)
Status changed 156 14.6 (12.0;17.7)
Remained without work 856 78.0 (74.3;81.2)
Self-rated health (n=1,139) b
Kept negative health self-perception 365 29.8 (26.6;33.2)
Began to have positive health self-perception 174 15.2 (12.7;18.1)
Began to have negative health self-perception 130 10.6 (8.8;12.9)
Kept positive health self-perception 468 44.0 (39.8;49.0)
Internet use (n=1,195)
Continued to use the Internet 228 20.9(16.8-25.7)
Ceased to use the Internet 38 3.4(2.2-5.1)
Began to use the Internet 90 8.2(6.5-10.2)
Continued not using the Internet 839 67.5(62.5-72.2)
Smoking habit (n=1,195)
Remained not smoking 701 57.5 (54.0;61.0)
Remained smoking 422 37.3 (33.7;41.90)
Ceased smoking 30 2.1 (1.4;3.3)
Began to smoke 42 3.0 (2.1;4.3)
Consumption of alcohol (n=1,197)
Continued without consumption of alcohol 652 53.3 (48.7;57.7)
Continued consuming alcohol 330 27.9 (24.1;32.1)
Ceased to consume alcohol 99 9.0 (7.4;10.9)
Began to consume alcohol 114 9.8 (8.9;12.1)
Leisure-time physical activities (n=1,197)
Continued inactive/inadequately active 691 56.3 (51.0;61.4)
Continued physically active 175 15.7 (12.8;19.3)
Became inactive/inadequately active 188 16.8 (13.2;21.1)
Became physically active 139 11.2 (9.1;13.7)
Fruit and vegetable consumption (n=996)
Continued to consume <5 daily servings 655 57.3 (53.0;61.4)
Continued to consume ≥5 daily servings 16 1.2 (0.07;2.1)
Began to consume <5 daily servings 274 24.3 (21.0;27.9)
Began to consume ≥ 5 daily servings 185 17.2 (14.3;20.6)
Table 2 – Conclusion
Variables no. % (CI95%a)
Nutritional status (n=1,146)
Continued overweight 526 47.0 (43.4;50.6)
Moved to low weight/appropriate weight 84 7.4 (5.8;9.2)
Moved to overweight 92 8.4 (5.8;9.2)
Continued with low weight/appropriate weight 429 37.3 (34.5;40.1)
Dependency on daily life activity (n=1,193)
Continued without dependency 720 60.5 (57.1;63.7)
Continued with dependency 227 19.0 (16.6;21.7)
Ceased to have dependency 101 9.3 (7.3;11.8)
Began to have dependency 145 11.2 (9.2;13.5)
Screening for cognitive deficit (n=1,177)
Kept negative tracing 788 69.4 (64.7;73.7)
Began to have positive tracing 122 10.2 (7.9;13.1)
Began to have negative tracing 85 5.8 (4.1;8.1)
Kept positive tracing 184 14.5 (11.2;18.7)
Depressive symptoms (n=1,103)
Continued normal 783 72.0 (768.6;75.1)
Moved to suspicion of depression 94 8.1 (6.5;10.0)
Moved to normal 102 8.9 (7.0;11.4)
Continued with suspicion of depression 124 11.0 (8.6;13.9)
Fall on previous year (n=1,197)
Continued without falls 705 60.6 (57.0;64.1)
Began to suffer falls 263 21.1 (18.2;24.5)
Ceased to suffer falls 127 10.5 (8.5;13.1)
Continued suffering falls 102 7.8 (6.4;9.3)
Morbidities: change (n=1,191)
Kept same number of diseases 419 35.2 (31.7;38.9)
Developed one or more diseases 474 40.0 (36.3;43.7)
Decreased number of diseases 300 24.8 (21.7;28.1)
aa) CI95%: confidence interval of 95%
b) The answer categories of the health self-perception were grouped in positive (very good; good) and negative (average; bad; very bad)
produce a high socioeconomic impact. In Brazil, these diseases constitute one of the major health problems and several actions are being developed,11,18,28,29 in all
spheres of Government, in order to alert about this issue, proposing discussions and eventual changes in the policies of Governments. Measures of NCD prevention and health promotion, in order to avoid or delay the manifestation of these diseases symptoms, may reduce satisfactorily public health spending.30
In this sense, intervention measures aimed at identifying preventable and/or treatable causes for non-communicable chronic diseases should be a priority to governmental actions of collective nature, as an effective means to reach the healthy aging of the country's growing elderly population.
Among the positives aspects of this investigation, we highlight the type of study (population-based cohort) and the sampling design (probabilistic sample). Initially, EpiFloripa Idoso Health Survey was designed as a cross-sectional study, but due to its research potential it has been transformed into a cohort with a follow-up of three to four years. Currently, coordinators and members of the involved group plan to continue the follow-up study, maintaining the same time span as default.
hospitalized during the follow-up, who possibly were in worse health conditions. Regarding the losses, less than 10% of the elderly were considered follow-up losses; a rate considered low in studies with this type of design. It is important to remember that the sample calculation considered a 20% increase for losses, in anticipation of its occurrence.
The results found should arouse the attention of public managers and the need to rethink actions aimed at improving the health of elderly people who have maintained and/or negatively altered their conditions (those inadequately active, with unhealthy diet, overweight), as well as the importance of promoting measures for maintenance and/or expansion of the positive conditions (positive self-rated health, no smoking , which do not consume alcohol, no functional dependency, no cognitive deficit, no depressive symptoms, and no falls' reports).
As the demographic, behavioral and health profile of the Brazilian population has been suffering changes over the past 40 years, and that in this scenario the
health care of the elderly is one of the most important challenges for the Brazilian society in the near future, the results of this research can contribute to the scientific basis, development and improvement of governmental actions of health promotion, prevention and treatment of diseases, individual and collective strategies aimed at the main needs of the elderly of Florianópolis and of Brazil.
Authors’ contributions
Confortin SC, Ono LM and Schneider IJC contributed to the conception, planning, analysis and interpretation of data, preparation of the first version, critical revision and approval of the final version of the manuscript. Before DL, Cembranel F, Marques LP, Borges LJ and Krug RR contributed to the design, interpretation of data, preparation of draft, critical revision and final approval of the manuscript. d' Orsi E contributed to the design, critical revision and final approval of the manuscript. All the authors claim to be responsible for all aspects of the study, ensuring its accuracy and completeness.
1. Ministério do Planejamento, Orçamento e Gestão. Instituto Brasileiro de Geografia e Estatística. Diretoria de Pesquisas. Coordenação de População e Indicadores Sociais. Mudança demográfica no Brasil no início do século XXI: subsídios para as projeções da população. Rio de Janeiro: Instituto Brasileiro de Geografia e Estatística; 2015. (Estudos e Análises); (Informação Demográfica e Socioeconômica, 3). 2. Stamatakis E, Davis M, Stathi A, Hamer M.
Associations between multiple indicators of objectively-measured and self-reported sedentary behaviour and cardiometabolic risk in older adults. Prev Med. 2012 Jan;54(1):82-7.
3. Veras R. Envelhecimento populacional
contemporâneo: demandas, desafios e inovações. Rev Saude Publica. 2009 mai-jun;43(3):548-54.
4. Lebrão ML, Duarte YAO. Desafios de um estudo longitudinal: o Projeto SABE. Saude Colet (Barueri, Impr). 2008;5(24):166-7.
5. Ministério da Saúde. Datasus. Estimativa população residente [Internet]. Brasília: Ministério da Saúde; 2015 [citado 2015 ago 26]. Disponível em: http:// tabnet.datasus.gov.br/cgi/tabcgi.exe?ibge/cnv/popSC.def 6. Instituto de Pesquisa Econômica Aplicada; Programa das Nações Unidas para o Desenvolvimento no Brasil;
Fundação João Pinheiro. Atlas do desenvolvimento humano no Brasil. Florianópolis [Internet]. Brasília: Programa das Nações Unidas; 2016 [citado 2015 ago 26]. Disponível em: http://www.atlasbrasil.org. br/2013/pt/perfil_m/florianopolis_sc
7. Coutinho ESF, Coeli CM. Acurácia da metodologia de relacionamento probabilístico de registros para identificação de óbitos em estudos de sobrevida. Cad Saude Publica. 2006 out;22(10):2249-52.
8. Ministério do Trabalho e Emprego (BR). Salário Mínimo [Internet]. Brasília: Ministério do Trabalho e Emprego; 2016 [citado 2016 abr 04]. Disponível em: http://trabalho.gov.br/salario-minimo
9. World Health Organization. The alcohol use disorders identification test: guidelines for use in primary care. 2nd Ed. Geneva: World Health Organization; 2015
[cited 2015 Mai 08]. Available from: http://www. talkingalcohol.com/files/pdfs/WHO_audit.pdf 10. Benedetti TB, Mazo GZ, Barros MVG. Aplicação do
Questionário Internacional de Atividades Físicas para avaliação do nível de atividades físicas de mulheres idosas: validade concorrente e reprodutibilidade teste-reteste. Rev Bras Cienc Mov. 2004 jan-mar;12(1):25-34. 11. World Health Organization. Global Strategy on diet,
physical activity and health. Fifty seventy world health
assembly. Geneva: World Health Organization; 2004 [cited 2015 Out 22]. Available from: http://www.who. int/dietphysicalactivity/strategy/eb11344/en/ 12. Ministério da Saúde (BR). Secretaria de Atenção à
Saúde. Departamento de Atenção Básica. Orientações para a coleta e análise de dados antropométricos em serviços de saúde: norma técnica do Sistema de Vigilância Alimentar e Nutricional – SISVAN. Brasília: Ministério da Saúde; 2011 [citado 2016 abr 04. Disponível em: http://bvsms.saude.gov.br/ bvs/publicacoes/orientacoes_coleta_analise_dados_ antropometricos.pdf
13. Associação Brasileira para o Estudo da Obesidade e da Síndrome Metabólica. Diretrizes brasileiras de obesidade 2009/2010/ABESO. 3 ed. São Paulo: AC Farmacêutica; 2009.
14. Rosa TEC, Benício MHDA, Latorre MRDO, Ramos LR. Fatores determinantes da capacidade funcional entre idosos. Rev Saude Publica. 2003 fev;37(1):40-8. 15. Almeida OP. Mini exame do estado mental e o
diagnóstico de demência no Brasil. Arq Neuro Psiquiatr. 1998 set;56(3B):605-12.
16. Paradela EMP, Lourenço RA, Veras RP. Validação da escala de depressão geriátrica em um ambulatório geral. Rev Saude Publica. 2005 dez;39(6):918-23. 17. Marengoni A, Angleman S, Melis R, Mangialasche F,
Karp A, Garmen A, et al. Aging with multimorbidity: a systematic review of the literature. Ageing Res Rev. 2011 Sep;10(4):430-9.
18. Secretaria Municipal de Saúde (Florianópolis). Capital idoso [Internet]. Florianópolis: Secretaria Municipal de Saúde; 2009 [citado 2015 out 22]. Disponível em: http://portal.pmf.sc.gov.br/entidades/ saude/index.php?cms=capital+idoso&menu=5
19. Ramos LR. Fatores determinantes do envelhecimento saudável em idosos residentes em centro urbano: Projeto Epidoso, São Paulo. Cad Saude Publica. 2003 jun;19(3):793-8.
20. Ono, LM. Capacidade funcional como preditor de mortalidade em idosos de Florianópolis: Estudo EpiFloripa Idoso [dissertação]. Florianópolis: Universidade Federal de Santa Catarina, Centro de Ciências da Saúde; 2015. 21. Medeiros FL, Xavier AJ, Schneider IJC, Ramos LR,
Sigulem D, d'Orsi E. Inclusão digital e capacidade funcional de idosos residentes em Florianópolis, Santa Catarina, Brasil (EpiFloripa 2009-2010). Rev Bras Epidemiol. 2012 mar;15(1):106-22.
22. Xavier AJ, d'Orsi E, Wardle J, Demakakos P, Smith SG, von Wagner C. Internet use and cancer-preventive behaviors in older adults: findings from a longitudinal cohort study. Cancer Epidemiol Biomarkers Prev. 2013 Oct; 22(11):2066-74.
23. Xavier AJ, D’Orsi E, Oliveira CM, Orrell M, Demakakos P, Biddulph JP, et al. English Longitudinal Study of Aging: can internet/e-mail use reduce cognitive decline? J Gerontol A Biol Sci Med Sci. 2014;69(9):1117-21. 24. D'Orsi E, Xavier AJ, Steptoe A, Oliveira C, Ramos
LR, Orrell M, et al. Socioeconomic and lifestyle factors related to instrumental activity of daily living dynamics: results from the english longitudinal study of ageing. J Am Geriatr Soc. 2014 Sep;62(9):1630-9. 25. Gatto SL, Tak SH. Computer, internet, and e-mail
use among older adults: benefits and barriers. Educ Gerontol. 2008 Aug;34(9):800-11.
26. Batistoni SST, Neri AL, Cupertino APFB. Medidas prospectivas de sintomas depressivos entre idosos residentes na comunidade. Rev Saude Publica. 2010 dez;44(6):1137-43.
27. Peel NM. Epidemiology of falls in older age. Can J Aging. 2011 Mar;30(1):7-19.
28. Ministério da Saúde (BR). Secretaria de Vigilância em Saúde. Departamento de Análise de Situação de Saúde. Plano de Ações Estratégicas para o Enfrentamento das Doenças Crônicas Não Transmissíveis (DCNT) no Brasil 2011-2022. Brasília: Ministério da Saúde; 2011 [citado 2016 abr 4]. Disponível em: http://bvsms.saude.gov.br/ bvs/publicacoes/plano_acoes_enfrent_dcnt_2011.pdf 29. Ministério da Saúde (BR). Secretaria de Vigilância
em Saúde. Departamento de Vigilância de Doenças e Agravos não Transmissíveis e Promoção da Saúde. Doenças Vigitel Brasil 2013: vigilância de fatores de risco e proteção para doenças crônicas por inquérito telefônico. Brasília: Ministério da Saúde; 2014 [citado 2016 abr 4]. Disponível em: http://bvsms.saude.gov. br/bvs/publicacoes/vigitel_brasil_2013
30. World Health Organization. Noncommunicable Diseases (NCD) Country Profiles [Internet]. Geneva: World Health Organization; 2010 [cited 2016 Abr 4]. Available from: http://www.who.int/nmh/publications/ ncd-profiles-2014/en/