r
~
~
e eli1A
· 1~
~~~
.i *·~X A: *· 3*
*·
~~~~~~
u
HEALTH CONDITIONS
IN
THE AMERICAS 1961-1962
PREPARED FOR
THE XV MEETING
OF
THE DIRECTING COUNCIL
Scientific Publications No. 104
August 1964
PAN AMERICAN
HEALTH ORGANIZATION
Pan American Sanitary Bureau - Regional Office of the
WORLD HEALTH ORGANIZATION
The recent impetus given in the Americas to National Health Planning has produced an increasing awareness of the need forac-curate statistical information. Governments are in agreement onthe advantages of working toward concrete objectives with well defined program action, careful measurement of results and evaluation of the social impact, followed, if necessary, by readjustment of goals
and methods. At each stage of this process factual data, as
relia-ble as possirelia-ble, are of paramount importance.
In the Pan American Health Organization we have been
witnessing progress during the last ten years in the registration, collection and analysis of vital and health statistics in the Region
of the Americas. However, as these data are used, evidence of
deficiencies also appear, and it is not always possible to assess
their validity. Thus it may be advisable at this time, at least in
some countries, to organize demonstration or "measurement" areas where accurate and reliable information can be developed, under-stood and wisely used. Extension of the measurement areas to the
entire counitry would of course gradually follow. The Pan American
Health Organization is interested in the development of such areas and offers its technical assistance to countries in this activity.
In government, policy decisions are being based on
tech-nical knowledge far more frequently than in the past. In the health
field, biostatistics is one of the indispensable disciplines for ob-taining this knowledge and for its application.
The Organization has the responsibility, as expressed in
the Pan American Sanitary Code, to present to Member
Govern-ments in a comprehensive manner information on health conditions
in the Region. This report prepared as recommended has two
objectives: first, to serve each national government andsecond, to provide data which will make it possible to analyze and attack on a scientific basis the problems of a regional nature or thosecom-mon to several countries.
b Horwitz
Director
TABLE OF CONTENTS
Page
FOREWORD ... iii
INTRODUCTION ... CHAPTER I. VITAL STATISTICS Population ... 1
Births ... 8
Deaths ... 9
CHAPTER II. COMMUNICABLE DISEASES Quarantinable Diseases ... ... 38
CHAPTER mI. HEALTH SERVICES Hospitals ... 47
Other Health Services ... 56
CHAPTER IV. HEALTH MANPOWER Physicians ... 61
Nurses and Nursing Auxiliaries ... 63
Dentists ... 65
Other Health Personnel ... 66
APPENDIX ... 69
INDEX ... 70
Table Page
CHAPTER I. VITAL STATISTICS
1 Estimated Populations (in Millions) and Percentage Distribution in the Three Regions of the Americas in 1950, 1960 and 1980 with Annual
Percentage Growth,1950-1960 ... 2
2 Population Data from Censuses Around 1950 and 1960 with Annual Rate
of Increase in the Decade, in the Americas ... 3
3 Percentage Distribution of Population by Age Group, Based on Censuses
Taken Around 1960,in the Americas ... 4
4 Percentage of Population Living in Cities with 100, 000 or More Inhab-itants, in Other Urban Areas and in Rural Areas in 15 Countries of
the Americas, According to Censuses Around 1960 ... 5
5 Percentage Distribution of the Labor Force into Three Sectors, in Ten
Countries of the Americas, According to Censuses Around 1960 ... 6
6 Per Capita National Income in the Three Regions of the Americas, 1962. 6
7 Number Attending Primary and Secondary Schools and Ratio to
Popula-tion of 5-14 Years of Age in the Americas, Recent Years... 7
8 Number and Percentage Literate of Population 15 Years of Age and
Over in Nine Countries of the Americas, 1960... 7
9 Estimated Midyear Populations in the Americas, 1960-1963 ... 7
10 Number of Live Births with Rates per 1, 000 Population in the Americas,
1961-1962 ... 9
11 Number of Deaths with Rates per 1, 000 Population in the Americas,
1961-1962 ... 11
12 Number of Deaths from Specific Causes in the Americas, Recent Years. 12
13 Death Rates per 100, 000 Population from Specific Causes in the
Americas, Recent Years ... 16
14 First Five Principal Causes of Death with Rates per 100, 000
Population in the Americas, Recent Years ... 20
15 Five Principal Causes of Death byRank Order in 22 American Countries 22
16 Deaths from Infectious and Parasitic Diseases (001 - 138) with Rates
per 100, 000 Population in Countries of the Americas ... 22
17 Deaths from Ill-Defined and Unknown Causes (780-795) with Rates per
100, 000 Population in Countries of the Americas ... 22
18 Number and Percentage of Deaths Under 5 Years of Age and Over 50
Years of Ag n Cotrles ofthe A ermcas, Recerr Yea u, .e... r. 24
19 Deaths from all Causes by Age per 1, 000 Population in Three Countries
in the Americas, 1940 and 1961 ... 24
20 Number of Infant Deaths with Rates per 1, 000 Live Births in the
Americas, 1961-1962 ... 26
21 Neonatal and Post-Neonatal Death Rates in the Americas, Recent Years. 27
22 Deaths and Death Rates per 1, 000 Populatian Among Children Under 5
Years of Age in Countries of the Americas, Recent Years ... 27
23 First Five Principal Causes of Death Among Children Under 5 Years of Age, Under 1 Year and 1-4 Years with Rates per 100, 000 Population in
the Americas, Recent Years ... 29
24 Five Principal Causes of Death by Rank Order for Children Under 1 Year
and 1-4 Years of Age in 18 Countries of the Americas, 1962 ... 33
25 Number of Maternal Deaths with Rates per 1, 000 Live Births in the
Americas, 1961-1962 ... 33
26 Deaths from Selected Causes with Rates per 100, 000 Population in Three
Countries, 1940 and 1961 ... 34
27 Percentage Change in Death Rates per 100, 000 Population and in Pro-portionate Mortality from Selected Causes in Three Countries, 1940
and 1961 ... 35
28 Deaths from Selected Causes per 100, 000 Population, by Age, in Three
Countries of the Americas, 1940 and 1961 ... 37
CHAPTER II. COMMUNICABLE DISEASES
29 Reported Cases of Selected Notifiable Diseases in the Americas, 1962 .. 39
30 Reported Cases of Quarantinable Diseases in the Americas, 1954-1963.. 42
31 Reported Cases of Quarantinable Diseases by Country, in the Americas,
1963 ... 42
32 Reported Cases of Plague by Major Political Divisions of Each Country,
in the Americas, 1961-1963 ... 42
33 Number of Smallpox Vaccinations in the Americas, 1961 and 1962 ... 43
34 Number of Vaccinations Against Yellow Fever in the Americas, 1961
and 1962 ... 45
CHAPTER Im. HEALTH SERVICES
35 Number of Hospitals by Type in the Three Regions of the Americas, 1962 47
36 Number of Hospitals by Type in the Americas, Around 1962 ... 48
37 Number of Hospital Beds per 1, 000 Population by Type in Three Regions
of the Ame ricas, 1962 ... 49
38 Number of Hospital Beds by Type of Hospital, with Rates per 1, 000
Population in the Americas, Around 1962 ... 50
39 Number and Percentage of Hospitals by Size in Six Countries in the
Americas, Around 1962 ... 49
40 Average Number of Beds in General and Other Hospitals in Three
Re-gions of the Americas, Around 1962 ... 51
41 Number and Percentage of Hospitals and Hospital Beds with Government
Ownership in 13 Countries of the Americas, Around 1962 ... 51
42 Number of Hospital Beds and Rate per 1, 000 Population in Capitals and
Large Cities in 16 Countries, Around 1962 ... 51
43 Admissions and Patient Days with Rates per 1, 000 Population and Average
Length of Stay in General Hospitals in 12 Countries ... 53
44 Admissions and Patient Days with Rates per 1, 000 Population in Mental
Hospitals in 11 Countries, Around 1962 ... 54
45 Admissions and Patierit Days with Rates per 1, 000 Population in
Tuber-culosis Hospitals in 8 Countries, Around 1962 ... 54
46 Number and Percentage Distribution of Hospital Discharges by Diagnosis
in Four Countries, Around 1961 ... 55
47 Total Consultations in Outpatient Clinics of Hospitals and Health Centers
with Numbers per 1, 000 Population in 14 Countries, 1962 ... 56
48 Number of Health Centers and Establishments for Out-Patient Care
(Ex-cluding Hospitals) in 17 Countries, 1962 ... 56
49 Number of Deliveries Attended by Qualified Physicians or Midwives and
Number of Children Under 1 Year and 1-5 Years Attended in Health
Service Units in 12 Countries, Around 1962 ... 57
50 Number of Persons Immunized Against Diphtheria in the Americas, 1961
and 1962 ... 58
51 Number of Persons Immunized Against Whooping Cough, in the Americas,
1961 and 1962 ... 58
CHAPTER IV. HEALTH MANPOWER
52 Number of Physicians, Schools of Medicine and Medical Graduates with
Ratios of Physicians per 10, 000 Population in the Americas, Recent Years 61
53 Number of Physicians and Ratios per 10, 000 Population in Capitals and
Large Cities and in Remainder of These Countries, in 13 Countries,
Around 1962 ... ... 62
54 Number of NuJrses and Nursing Auxiliaries with Ratios per 10, 000
Popu-lation, in the Americas ... 64
55 Number of Dentists with Ratios per 10, 000 Population and Schools of
Dentistry with Graduates Per Year, in the Americas, Around 1962 ... 65
56 Personnel for Medical and Health Services in the Americas, 1962 ... 66
57 Governmental Personnel for Medical and Health Services in the Anm ricas,
1962 ... 67
Figure Page
CHAPTER I. VITAL STATISTICS
1 Annual Percentage Growth Rates of Population Between the Two Most
Recent Censuses, in Countries of the Americas ... 2
2 Percentage Distribution by Sex and Age of Population in Three American
Countries, Recent Census ... 2
3 Percentage of Population Living in Cities with 100, 000 or More Inhab-itants, in Other Urban Areas and in Rural Areas, According to Censuses
Taken Around 1960 ... 5
4 Percentage Distribution of Labor Force into Three Sectors in Countries
in the Three Regions of the Americas, 1960 ... 5
5 Per Capita National Income in the Three Regions of the Americas, 1962. 5
6 Students in Primary and Secondary Schools and Population in Age Group 5-14 Years with Ratio of Students to Population in Latin America, 1954
and 1960 ... 6
7 Ratio of Students in Primary and Secondary Schools to Population in Age
Group 5-14 Years in Latin American Countries, 1954 and 1960 ... 8
8 Births, Deaths and Excess of Births Over Deaths per 1, 000 Population
in the Three Regions of the Americas, 1953-1962 ... 10
9 Percentage of Deaths in Three Age Groups in Countries of the Americas,
Around 1961 ... 24
10 Deaths from all Causes per 1, 000 Population by Age in Chile, Mexico
and United States, 1940 and 1961 ... 25
11 Deaths from all Causes per 1, 000 Population by Age in Chile, Mexico
and United States, 1940 and 1961 ... 25
12 Deaths Under One Year oaf Age per 1, 000 Live Births in Six Countries of
the Americas, 1953-1962 ... 26
13 Deaths of Children 1-4 Years of Age per 1, 000 Population in Six
Coun-tries of the Americas, 1953-1962 ... 28
14 Deaths from Tuberculosis, all Other Infective and Parasitic Diseases,
Gastritis, Enteritis, etc., and Influenza and Pneumonia per 100, 000
Population by Age in Chile, Mexico and United States, 1940 and 1961... 36
15 Deaths from Malignant Neoplasms, Vascular Lesions Affecting Central Nervous System and Diseases of the Heart per 100, 000 Population by
Age in Chile, Mexico and United States, 1940 and 1961 ... 36
CHAPTERIL COMMUNICABLE DISEASES
16 Reported Cases of Smallpox in the Americas, 1950-1963 ... 43
17 Reported Cases of Louse-borne Typhus by Major Political Divisions of
Each Country, in the Americas, 1963 ... 44
18 Reported Cases of Jungle Yellow Fever by Major Political Divisions of
Each Country, and Location, in the Americas, 1963 ... 45
CHAPTER III. HEALTH SERVICES
19 Hospital Beds per 1, 000 Population by Type of Hospital in the Three Regions of the Americas, Around 1962 ...
20 Percentage Distribution of Hospitals by Size, in Six Countries, Around
1962 ... 51
21 Percentage of Beds in Governmental Hospitals in 13 Countries of the
Americas, Around 1962 ... 52
22 Hospital Beds per 1, 000 Population in Capitals and Large Cities and in
Remainder of These Countries, in the Americas, Around 1962 ... 52
23 Percentage Change in Total and Per Capita Food Production and in
Popu-lation in Northern and Latin America from 1953-1954 to 1962-1963 .... 59
24 Work Time Required to Purchase Three Basic Foods in Selected
Coun-tries of the Americas, 1954 and 1962 ... 59
CHAPTER IV. HEALTH MANPOWER
25 Number of Physicians, Nurses, Nursing Auxiliaries and Dentists per
10, 000, Population in the Three Regions of the Americas, 1962 ... 62
26 Physicians per 10, 000 Population in Capitals and Large Cities and in
Remainder of These Countries, in the Americas, Around 1962 ... 63
EXPLANATION OF SYMBOLS
Data not available ...
NonQ ...
Less than half of unit employed ... 0. 0
Summary reports on health conditions in the Americas from 1950 to 1960 have been prepared for the XIV, XV and XVI Pan American Sanitary Conferences.(1, 2, 3) Data were collected for these reports through three questionnaires completed in the countries and other areas of the Region. The information provided in the last two questionnaires has also served for the First and Second Reports on the World Health Situation, published by the World Health Organization.
Following the presentation of the Second Report on the World Health Situation, 1957-1960 at
the Fifteenth World Health Assembly in 1962 a Resolution was passed requesting that a Supple-mental Questionnaire for the years 1961 and 1962 be sent to Member Governments and that a Report be presented to the Seventeenth World Health Assembly in 1964. Data obtained through
this questionnaire have recently been published in the Supplement to the Second Report on the World Health Situation, 1961-1962, mainly in the form of individual country resumes.
Information from the same questionnaire together with data received in response to the annual joint request of the World Health Organization and the Pan American Health Organi-zation to the countries for statistics on mortalityby cause and age, on vaccinations, on hospi-tals and on health personnel have been used by PAHO in preparing the present report. An Appendix Table gives the names of the countries and other areas of the Americas from which these two sources of data were received. Publications of the countries as well as other official reports from the countries to PAHO, to WHO and to the United Nations have also served as reference documents. When data from different sources were not in agreement, efforts were made to ascertain the most reliable or consistent figure.
This report is less extensive than the previous Summaries of Four-Year Reports on Health Conditions in the Americas with respect to the health problems included. The largest chapters are concerned with demography and vital statistics and with hospital services in the Region. Population characteristics have been emphasized at this time since data from recent censuses are now becoming available. The new demographic information presented is of considerable significance and use in the health field. Information on numbers of hospitals and hospital beds in the Region is more nearly complete than in the past. Through use of data for selected countries it has been possible to present a more comprehensive picture of hospital utilization than in earlier publications.
Only limited data are given on the communicable diseases since a separate publication, Reported Cases of Notifiable Diseases in the Americas, 1962, has recently been prepared which
contains the details of the reported occurrence of approximately forty diseases in the Region. Since the basic questionnaires requested only limited informationon environmental sanitation, data in this health area are not included here.
Throughout the report indices for evaluating health conditions and measuring progress in health are stressed. Included are those based on population structure, on vital statistics and on resources of hospitals and of manpower, all of which will be valuable in measuring the achievements of the countries of the Americas toward reaching the goals established in the Charter of Punta Del Este. It is hoped that with the addition of data for 1963 and 1964 to those in this and in earlier publications trends of health indices can be shown over an extended period of years in a report for the Pan American Sanitary Conference in 1966.
(1) Summary of Reports on the Health Conditions in the Americas, 1950-1953 (Scientific
Publica-tions No. 25), Washington, 1956.
(2) Summary of Four-Year Reports on Health Conditions in the Americas (Scientific Publications
No. 40), Washington, 1958.
(3) Summary of Four-Year Reports on Health Conditions in the Americas 1957-1960 (Scientific
Publications No. 64) Washington, 1962.
VITAL STATISTICS
Reliable demographic data are a requisite for planning for health services. Knowledge of the age structure, the growth rate andother characteristics of each population is essential as a basis for understand-ing the specific health problems. Moreover indices based on population and vital statistics remain as in the past the indispensable and classical measures of health progress. Included among such indices are the structure of the population by age and by
socio-economic characteristics, the distribution of deaths by age and the level of mortality from selected causes. Development of reliable and complete data in these fields is a recommended goal for each national health service. The information presented in this report is based mainly on summaries received from member governments and indicates the improvementwhichhas occurred in recent years in the quality and availability of data in this field.
POPULATION
The recent censuses in the Region and the demo-graphic data now becoming available from them are of considerable significance in the analysis of health conditions.
In all but three of the 24 countries in the Americas, population censuses have been taken in the years be-tween 1960 and 1964. For only two of the other areas of the Region are recent census data not available. During the present decade these population statistics obtained from censuses will be the basis for projec-tions which are so essential for planning and evaluat-ing health programs.
Provisional information on total population and its distribution by major political divisions is available for most countries. For some, distributions by age, by housing characteristics, by educational level andby occupational status have also been published or pre-pared. These data when available are presented inthis
report.
In the Region of the Americas the population has been growing since 1950 at a faster rate (2.3 per cent per year) than in any other broad Regionof the world. This is due to the extremely high growth rates in Middle and South America. By 1960 Middle America
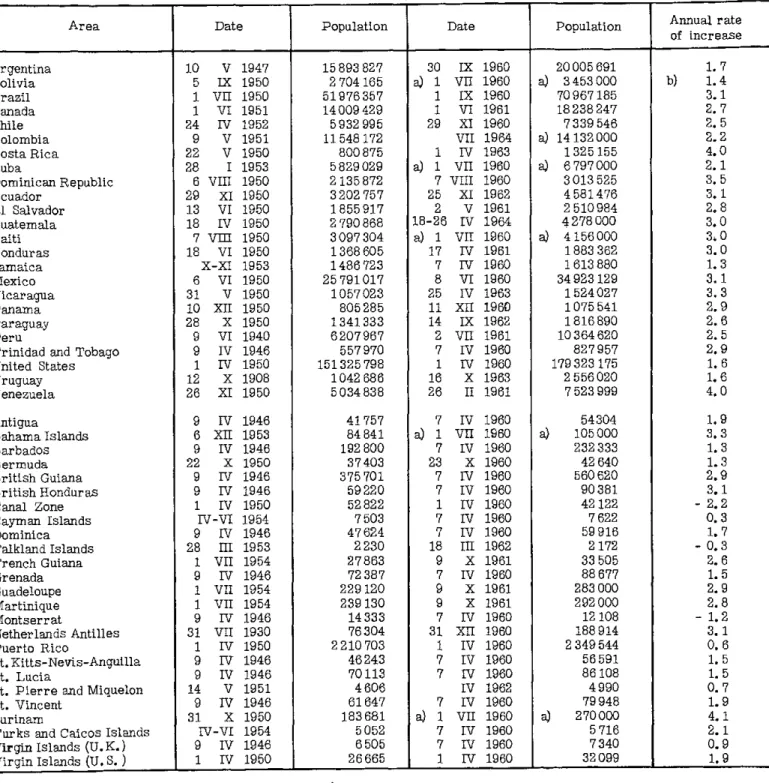
and South America had over 50 per centof the popula-tion of the Region and it is estimated that by 1980 at the present growth rates, this area will include close to 60 per cent of the Regional population (Table 1). In Table 2 are shown the populations in the countries and other areas in the Americas according to the two most recent censuses, usually takenaround 1950 and 1960. For countries without a recent census or for which the result of the enumeration is not yet known, the estimated population for midyear 1960 as published by the United Nations is given instead. Also included in the table is the annual rate of population increase in the period between the censuses, and in Figure 1 these rates are shown for the countries of the Region. The rate of increase ranges from 4.0 per cent per year in Costa Rica to 1.3 per cent in Jamaica. For ten of the 24 countries growth rates are 3 per cent or more, and for another nine between 2 and 2.9 per cent. The remaining five countries which are increasing by 1.3 to 1.7 per cent each year are Argentina, Bolivia, Jamaica, United States and
Uruguay, and they are the only countries in the Americas with a growth rate below the average esti-mated for the world (1.8 per cent).
TABLE 1. ESTIMATED POPULATIONS (IN MILLIONS) AND PERCENTAGE DISTRIBUTION IN THE THREE REGIONS OF
THE AMERICAS IN 1950, 1960 AND 1980 WITH ANNUAL PERCENTAGE GROWTH 1950-1960
1950 1960 1980 Average
annual
Region (a) nnual
Num- Per Numn- Per Numr- Per growth ber cent ber cent ber cent rate (b>
1950-1960
Total 329 100 411 100 603 100 2.3 Northern
'America 167 50.8 200 48. 7 254 42. 1 1.8 Middle
America 51 15. 5 67 16.3 115 19. 1 2.8 South
America 111 33. 7 144 35.0 234 38.8 2. 7 Source: United Nations
(a) Northern America: Middle America: South America:
Bermuda, Canada, St. Pierre and Miquelon and United States.
Caribbean Islands, Central America, Mexico and Panama.
Continent of South America and Falkland Islands.
(b) Annual percentage growth on compound interest formula.
FIGURE 1
ANNUAL PERCENTAGE GROWTH RATES OF POPULATION BETWEEN THE TWO MOST RECENT CENSUSES,
IN COUNTRIES OF THE AMERICAS
COSTA RICA VENEZUELA
DOMINICAN REPUBLIC NICARAGUA BRAZIL
MEXICO ECUADOR HONDURAS GUATEMALA* HAITI* PANAMA
TRINIDAD AND TOBAGO EL SALVADOR CANADA PARAGUAY CHILE PERU COLOMBIA * CUBA * ARGENTINA UNITED STATES URUGUAY
BOLIVIA * JAMAICA
*CENSUS FOR 1960' FOR JULY 1, 1960 1
FIGURE 2
PERCENTAGE DISTRIBUTION BY SEX AND AGE OF POPULATION IN THREE AMERICAN COUNTRIES,
RECENT CENSUS
MALE
UNITED STATES (1960)
60-74
45-59 30-44 15-29 0-14
25 20 15 10 5 0
PER CENT
CHILE (19 75+ 60-74 45-59 30-44 15-29 0-14
25 20 15 10 5 0
PER CENT
FEMALE
0 5 10 15 20 25 PER CENT
60J
0 5 10 15 20 25 PER CENT
HONDURAS (1961J 175+
L
60-74 45-59 30-44 15-290-14
25 20 15 10 5 0
PER CENT
0 5 10 15 20 25
PER CENT
Growth rates in other areas of the Americas showed considerable variation and in general were lower than those for the countries. The highest were for the two areas without censuses in the 1960's, Surinam and the Bahama Islands. For only four was the increase greater than 3 per cent and for five between 2 and 2.9. For the remainder, growth was less marked; for nine between 1 and 1.9 per cent, for four between 0 and 0.9 per cent, and for three de-creases were recorded.
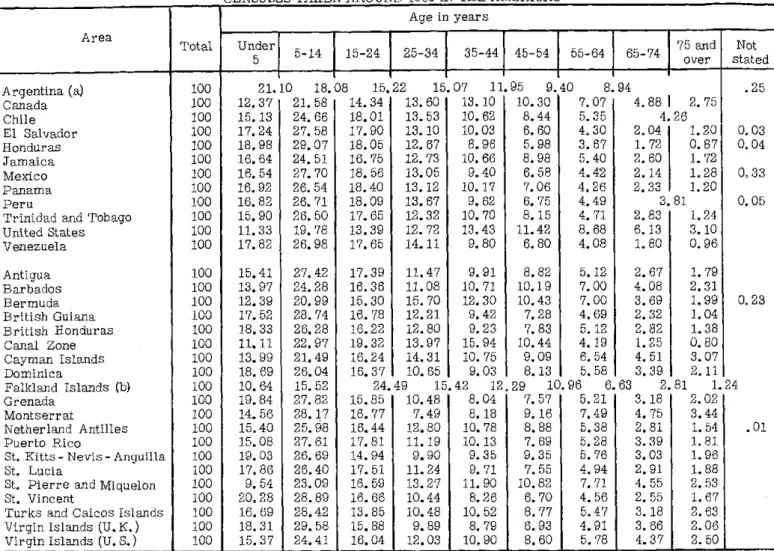
Populations in countries of the Americas vary widely in their age distributions. The percentage _- ' '
u ; i i i idUstribuutions by age groups are given for countries 0 1.0 2.0 3.0 4.0 for which tabulations have already been published, based on a recent census or on a sample from the
PERCENTAGE GROWTH census (Table 3). Such age distributions will
un-doubtedly be used in the period until the next census
5 NOT YET TAKEN. ESTIMATED POPULATION
sNOT YET TKENM ESTIM AIMIA1 rOLWTM DATrE for the estimation of age distributions. In the twelve
TABLE 2. POPULATION DATA FROM CENSUSES AROUND 1950 AND 1960 WITH ANNUAL RATE OF INCREASE IN THE DECADE, IN THE AMERICAS
Area Date Population Date Population of nreae
of increase Argentina Bolivia Brazil Canada Chile Colombia Costa Rica Cuba
Dominican Republic Ecuador
El Salvador Guatemala Haiti Honduras Jamaica Mexico Nicaragua Panama Paraguay Peru
Trinidad and Tobago United States Uruguay Venezuela
Antigua Bahama Islands Barbados Bermuda British Guiana British Honduras Canal Zone Cayman Islands Dominica Falkland Islands French Guiana Grenada Guadeloupe Martinique Montserrat
Netherlands Antilles Puerto Rico
St. Kitts-Nevis-Anguilla St. Lucia
St. Pierre and Miquelon St. Vincent
Surinam
Turks and Caicos Islands
Virgin Islands (U. K.) Virgin Islands (U. S. )
1C 1 1 E E 2c 28 29 13 1E 18 E 31 1( 2E 2E V IX VII VI IV V V B I 3 VIII 9 XI 3 VI IV 7 VIII 3 VI X-XI 3 VI 1 V 0 XII 3 X 9 VI 9 IV 1 IV 2 X 3 XI
9 IV 6 XII 9 IV 22 X
9 IV 9 IV 1 IV IV-VI 9 IV 28 III 1 VII 9 IV 1 VII 1 VII 9 IV 31 VII 1 IV 9 IV 9 IV 14 V 9 IV 31 X IV-VI 9 IV 1 IV
1947 1950 1950 1951 1952 1951 1950 1953 1950 1950 1950 1950 1950 1950 1953 1950 1950 1950 1950 1940 1946 1950 1908 1950 1946 1953 1946 1950 1946 1946 1950 1954 1946 1953 1954 1946 1954 1954 1946 1930 1950 1946 1946 1951 1946 1950 1954 1946 1950
15 893 827 2 704 165 51976357 14009429 5932995 11548172 800875 5829029 2 135 872 3202757 1855917 2 790 868 3097304 1368605 1486723 25791017 1057023 805285 1341333 6207967 557970 151325798 1042 686 5034838 41757 84841 192 800 37403 375701 59220 52 822 7503 47624 2230 27863 72387 229120 239 130 14333 76304 2210703 46243 70113 4606 61647 183681 5052 6505 26665 30 a) 1
1 1 29
1 a) 1 7 25
2 18-26
a) 1 17 7 8 25 11 14 2 7 1 16 26 7 a) 1 7 23 7 7 1 7 7 18 9 7 9 9 7 31 1 7 7 7 a) 1 7 7 1 IX VII IX VI XI VII IV VII VIII XI V IV VII IV IV VI IV XII IX VII IV IV X II IV VII IV X IV IV IV IV IV III X IV X X IV XII IV IV IV IV IV VII IV IV IV 1960 1960 1960 1961 1960 1964 1963 1960 1960 1962 1961 1964 1960 1961 1960 1960 1963 1960 1962 1961 1960 1960 1963 1961 1960 1960 1960 1960 1960 1960 1960 1960 1960 1962 1961 1960 1961 1961 1960 1960 1960 1960 1960 1962 1960 1960 1960 1960 1960 20005691 a) 3 453 000 70967185 18238247 7339 546 a) 14132000 1325155 a) 6797000 3 013 525 4581476 2 510 984 4278 000 a) 4156000 1883 362 1 613 880 34923129 1524027 1075541 1816890 10 364 620 827957 179323 175 2556020 7 523 999
54304
a) 105000
232333 42 640 560620 90381 42 122 7 622 59916 2 172 33 505 88677 283 000 292000 12 108 188 914 2 349 544 56591 86 108 4990 79948 a) 270000 5716 7340 32099
J .5_ _ _ _ _ _ _
1. 7 b) 1.4
3.1 2. 7 2. 5 2.2 4.0 2. 1 3. 5 3. 1 2.8 3. 0 3. 0 3.0 1. 3 3. 1 3. 3 2. 9 2.6 2.5 2.9 1. 6 1. 6 4.0
1.9 3. 3
1. 3 1.3 2.9 3. 1 -2.2 0.3 1. 7 -0. 3 2. 6 1. 5 2.9 2. 8 -1. 2 3. 1 0. 6 1. 5 1. 5 0. 7 1. 9 4.1 2. 1 0.9 1.9
Note: Rate of increase for period between two dates shown.
(a) No recent census or data not yet available; estimated midyear population for 1960 used instead. (b) Based on estimates not on 1950 census.
-TABLE 3. PERCENTAGE DISTRIBUTiON OF POPULATION BY AGE GROUP BASED ON CENSUSES TAKEN AROUND 1960 IN THE AMERICAS
Age in years
Area Total Under
¡
75 and Not5-14 15-24 25-34 35-44 45-54 55-64 65-74
5 over stated
Argentina (a) 100 21.10 18.08 15.22 15.07 11.95 9.40 8.94 .25
Canada 100 12.37 21. 58 14.34 13. 60 13. 10 10.30 7.07 4.88 1 2. 75 Chile 100 15. 13 24. 66 18.01 13. 53 10. 62 8.44 5.35 4.26
El Salvador 100 17. 24 27. 58 17.90 13. 10 10.03 6. 60 4.30 2.04 1.20 0.03 Honduras 100 18.98 29.07 18.05 12.67 8.96 5.98 3.67 1. 72 0. 87 0.04
Jamaica 100 16.64 24. 51 16. 75 12.73 10.66 8.98 5.40 2.60 1. 72 Mexico 100 16.54 27.70 18.56 13.05 9.40 6.58 4.42 2.14 1.28 0,33 Panama 100 16.92 26. 54 18.40 13. 12 10. 17 7.06 4.26 2.33 1.20
Peru 100 16.82 26. 71 18.09 13.67 9.62 6. 75 4.49 3. 81 0.05 Trinidad and Tobago 100 15.90 26.50 17. 65 12.32 10.70 8. 15 4. 71 2.83 1.24 United States 100 11.33 19. 78 13.39 12. 72 13.43 11.42 8. 68 6. 13 3. 10 Venezuela 100 17.82 26.98 17.65 14. 11 9.80 6.80 4.08 1.80 0. 96
Antigua 100 15.41 27.42 17.39 11.47 9.91 8.82 5. 12 2. 67 1.79 Barbados 100 13.97 24.28 16.36 11.08 10.71 10.19 7.00 4.08 2.31 Bermuda 100 12.39 20.99 15.30 15. 70 12.30 10.43 7.00 3. 69 1.99 0.23 British Guiana 100 17. 52 28. 74 16. 78 12.21 9.42 7.28 4. 69 2.32 1.04 British Honduras 100 18.33 26.28 16.22 12.80 9.23 7. 83 5. 12 2.82 1.38 Canal Zone 100 11. 11 22.97 19.32 13.97 15. 94 10.44 4. 19 1.25 0.80 Cayman Islands 100 13.99 21.49 16.24 14.31 10. 75 9.09 6. 54 4. 51 3.07 Dominica 100 18. 69 26.04 16.37 10. 65 9.03 8. 13 5. 58 3.39 2. 11 Falkland Islands (b) 100 10. 64 15.52 24.49 15.42 12.29 10.96 6. 63 2.81 1.24 Grenada 100 19.84 27.82 15.85 10.48 8.04 7. 57 5.21 3.18 2.02 Montserrat 100 14. 56 28. 17 16. 77 7.49 8. 18 9. 16 7.49 4. 75 3.44 Netherland Antilles 100 15.40 25.98 16.44 12.80 10. 78 8. 88 5.38 2.81 1. 54 .01 Puerto Rico 100 15.08 27. 61 17.81 11. 19 10. 13 7.69 5.28 3.39 1.81 St. Kitts - Nevis - Anguilla 100 19.03 26. 69 14.94 9.90 9.35 9.35 5. 76 3.03 1.96 St. Lucia 100 17. 86 26.40 17. 51 11.24 9. 71 7. 55 4.94 2.91 1.88 St. Pierre and Miquelon 100 9. 54 23.09 16. 59 13.27 11. 90 10.82 7. 71 4. 55 2. 53 St. Vincent 100 20.28 28.89 16.66 10.44 8.26 6. 70 4. 56 2. 55 1. 67 Turks and Caicos Islands 100 16. 69 28.42 13.85 10.48 10. 52 8. 77 5.47 3. 18 2. 63 Virgin Islands (U. K.) 100 18. 31 29. 58 15. 88 9.89 8. 79 6. 93 4.91 3. 66 2.06 Virgin Islands (U. S.) 100 15.37 24.41 16.04 12.03 10.90 8.60 5. 78 4.37 2. 50
Note: Based on samples in some countries.
(a) Age groups: Under 10, 10-19, 20-29, 30-39, 40-49, 50-59, 60 and over. (b) Age groups: 15-29, 30-39, 40-49, 50-59, 60-69, 70-79, 80 and over.
countries for which data are available the proportion of the total population under 5 years of age varied from 11 to 19 per cent. Forthe other areas of the Americas the range was similar, from 10 to 20 per cent. The proportion under 15 years of age is lowest in the United States (31 per cent) and highest in Honduras (48 per cent). The distributions of the populations of Canada and Argentina are those most nearly similar to that of the United States. At the other end nf the age span the proportion in the age group of 65 years and over ranges from over 9 to less than 3 per cent of the population, the highest being for the United States and the lowest for Honduras. Three countries were selected to show in Figure 2 the differing
pat-terns of age structure in the Region - the two ex-tremes, United States and Honduras, and Chile which has an intermediate distribution.
Knowledge of the geographic distribution of the population is essential in planning and evaluating health programs and in assessing the adequacy of the resources available and their distribution. During the past decade there have been high growth rates, due in
TABLE 4. PERCENTAGE OF POPULATION LIVING IN CITIES WITH 100, 000 OR MORE INHABITANTS IN OTHER URBAN AND IN RURAL AREAS.IN 15 COUNTRIES OF THE AMERICAS,ACCORDING TO CENSUSES AROUND 1960
In cities of In other
Country 100, 000 urban ural or more areas
Argentina 42.8 a) 23.6 a) 33.6
Brazil 18.8 21.6 59.6
Canada 22.8 33.0 44.2
Costa Rica 9.4 25.1 65.5
Dominican Republic 12.2 18.3 69.5
El Salvador 9.9 28.6 61.5
Honduras 7. 1 15.4 77.5
Jamaica 7.7 24.5 67.8
Mexico 19.2 31.5 49.3
Nicaragua 14.8 26.3 58.9
Panama 25.4 17.3 57.3
Paraguay 16.8 18.8 64.4
Peru 19.6 27.5 52.9
United States 28.4 36. 7 34.9
Venezuela 26.9 36.8 36.3
a) Estimated.
PERCENTAGE DISTRIBUTION OF LABOR FORCE INTO THREE SECTORS IN COUNTRIES IN THE THREE REGIONS
OF THE AMERICAS, 1960
NORTHERN AMERICA 12 COUNTRIES)
SOUTH AMERICA (4 COUNTRIES)
M AGRICULTURE = INDUSTRY
MIDDLE AMERICA 14 COUNTRIES)
TR< n TRADE AND i 1SERVICES
FIGURE 3
PERCENTAGE OF POPULATION LIVING IN CITIES WITH 100,000 OR MORE INHABITANTS, IN OTHER URBAN AREAS
AND IN RURAL AREAS, ACCORDING TO CENSUSES TAKEN AROUND 1960
ARGENTINA UNITED STATES VENEZUELA PANAMA CANADA PERU MEXICO BRAZIL PARAGUAY NICARAGUA DOMINICAN REP. EL SALVADOR COSTA RICA JAMAICA HONDURAS
FIGURE 5
PER CAPITA NATIONAL INCOME IN THE THREE REGIONS
OF THE AMERICAS, 1962
2500
2000 1
u,
-J
o
-i
o
u,
Z
u
o EU~~~~~~~~~~~~~~~~~~~~~~~~~ I
~//////////////
~//////// / /I////
~//////////////,
'////////////D '~//////////~
~//////////////////
0 1020/3/4050/6/7080/9/10
PERCENTAGE
IN CITIES OF IN OTHER IN RURAL 100,000 AND OVER UR URBAN AREAS MAREAS
opposite situation exists, large proportions living in rural sections. Material from recent censuses showing the percentage of population living in cities of 100,000 and over, in other urban areas, and in rural areas is presented in Table 4 and Figure 3. In Argentina almost 43 per cent of the population lives in cities of at least 100,000 inhabitants while only 34 per cent lives in rural areas. This represents a greater
1500 oo
1000oo
500
-O
NORTHERN MIDDLE AMERICA
TABLE 5. PERCENTAGE DISTRIBUTION OF THE LABOR FORCE INTO THREE SECTORS, IN TEN COUNTRIES OF THE AMERICAS, ACCORDING TO CENSUSES AROUND 1960
Total Agriculture Industry Trade Not
and mining and and stated
Country __________ _________ construction services
Number Per cent Number Per cent Number Per cent Number Per cent Number Per cent
Argentina 7 599 000 100 1 504 000 19.8 2 339 000 30. 8 2 988 000 39. 3 768 000 10. 1 Canada 6472 000 100 907000 14.0 1836000 28.4 3570000 55.2 159 000 2.5 Chile 2 356 000 100 745000 31.6 571000 24.2 914 000 38.8 126 000 5. 3 El Salvador 807 000 100 486 000 60.2 135 000 16. 7 178 000 22. 1 8000 1. 0 Honduras 580 000 100 383 000 66.0 55 000 9.5 106 000 18.3 36 000 6. 2 Mexico 11 332 000 100 6 287 000 55.5 1965 000 17.3 2 999 000 26.5 81000 0. 7 Panama 311000 100 156 000 50.2 40 000 12.9 110 000 35.4 5 000 1. 6 Peru 3 034 000 100 1559000 51.4 512 000 16.9 840000 27; 7 123000 4. 1 United States 69877000 100 5 233 000 7. 5 22838000 32. 7 37072000 53. 1 4 734 000 6. 8 Venezuela 2 407 000 100 820 000 34.1 423 000 17. 6 1008 000 41.9 156000 6. 4
TABLE 6. PER CAPITA NATIONAL INCOME IN THE THREE REGIONS OF THE AMERICAS, 1962
National income Per
Region and capita
country National Total Per incom currency (millions) capita in US$
NorthernAmerica 2 338
Canada Dollar 30 400 1634 1516 United States Dollar 450 000 2 421 2 421
Middle America 311
Costa Rica Colon 2 661 2 089 314
Dominican Republic Peso 616 191 191
El Salvador Colon 1402 534 213
Guatemala Quetzal 612 152 152
Honduras Lempira 732 375 187
Jamaica Pound 225 137 384
Mexico Peso 160 500 4 311 344 Nicaragua Cordoba 2936 1861 254
Panama Balboa 427 373 373
Trinidad and Tobago Dollar 779 871 508
South America 200
Argentina Peso 906000 42 301 315 Brazil (a) Cruzeiro 1879000 26 608 130
Chile Escudo 5306 661 273
Colombia Peso 28200 1909 172
Ecuador Sucre 13 400 2 925 132
Paraguay Guarani 27 300 14 701 117
Peru Sol 49 400 4 652 173
Venezuela Bolivar 20900 2 655 585
(a) For 1960.
degree of urbanization than in the United States where only 28 per cent is in comparable large cities and 35 per cent in rural areas. Venezuela is fairly similar to the United States in its urban-rural distribution. At the other extreme, in Honduras, only 7 per cent
FIGURE 6
STUDENTS IN PRIMARY AND SECONDARY SCHOOLS AND POPULATION IN AGE GROUP 5-14 YEARS WITH RATIO OF
STUDENTS TO POPULATION IN LATIN AMERICA, 1954 AND 1960
1954
0.43
1960
0 10 20 30 40
PERSONS IN MILLIONS
50 60
lives in a city of 100,000 population and 78 per cent resides in rural areas. In general the distributions shown emphasize that a large proportion of the popu-lation of Latin American countries is living in rural areas and health services must be provided which are adapted to this environment. It can be estimated from
wte avaiiabie data that close to 60 per cent of the population in Latin America lives in rural areas, essentially in communities of less than 2,000 popula-tion. (The definitions of rural in the data shown are not always uniform.)
Closely related to the urban-rural distribution
I I
I I I
I'ABLE 7. NUMBER ATTENDING PRIMARY AND SECOND-ARY SCHOOLS AND RATIO TO POPULATION OF 5-14 YEARS
OF AGE, IN THE AMERICAS, RECENT YEARS Population Students in primary Country Year 5-14 years and secondary chools
of age Number Ratio Argentina 1960 4 032 000 2 984 308 0. 74
Bolivia 1960 824 000 380 853 0. 46
Brazil 1961 18 674 789 8 795 064 0. 47 Canada 1959 3 780 967 a) 4010471 1.06
Chile 1960 1907 600 1315 646 0. 69
Colombia 1960 3 659 000 1830 690 0. 50 Costa Rica 1961 321 900 236 879 0. 73
Cuba 1960 1543 000 1323264 0.86
Dominican
Republic 1961 837 906 b) 519 827 0.62 Ecuador 1959 1 110 866 603 860 0. 54 El Salvador 1960 676 856 342121 0. 50 Guatemala 1961 988 788 350 008 0. 35
Haiti 1959 1018206 252 519 0.25
Honduras 1961 542 560 234 759 0. 43
Jamaica 1960 397 000 c) 279 260 0. 70
Mexico 1960 9 675 360 5148195 0. 53
Nicaragua 1958 368 524 134 250 0. 36
Panama 1961 295 308 199 598 0.68
Paraguay 1960 422 000 315138 0.75
Peru 1959 2 637 055 1533 014 0. 58
Trinidad and
Tobago 1961 229 800 202 847 0.88
United States 1960 35 465 272 b) 40 598000 1. 14
Uruguay 1959 543 008 380162 0.70
Venezuela 1959 1921374 1162 314 0. 60 (a) Including public schools offering technical courses with programs at secondary level. (b) Including technical edu-cation. (c) Not including unaided schools.
TABLE 8. NUMBER AND PERCENTAGE LITERATE OF POPULATION 15 YEARS OF AGE AND OVER IN
NINE COUNTRIES OF THE AMERICAS
Population Literate Percentage Country Year 15 Years Population er
and over Population Literate Argentina (a) 1960 14199299 12 925652 91. 0 Chile (b) 1960 4 440 800 3 711700 83.6 Ecuador (b) 1962 2 478 133 1667 799 67.3 El Salvador (b, c) 1961 1694 880 813 470 48.0 Honduras (b) 1961 969 700| 432 200 44.6 Mexico 1960 19 471022 12 728102 65.4 Panama (c) 1960 698 624 546 818 78. 3 United States (ad) 1959 121373000 118 754 000 97. 8 Venezuela (b) 1961 4153275 2 677550 64. 5 (a) Data for population 14 years and over. (b) Based on a sample. (c) Data for population 10 years and over. (d) Based on a special sample survey.
TABLE 9. ESTIMATED MIDYEAR POPULATIONS IN THE AMERICAS, 1960-1963
Area 1962 1963
Argentina Bolivia Brazil b) Canada Chile Colombia Costa Rica Cuba
Dominican Republic Ecuador
El Salvador
Guatemala Haiti Honduras Jamaica Mexico Nicaragua Panama Paraguay
Peru c)
Trinidad and Tobag¢ United States
Uruguay Venezuela
Antigua
Bahama Islands Barbados
Bermuda British Guiana British Honduras Canal Zone Cayman Islands Dominica Falkland Islands
French Guiana
Grenada
Guadeloupe
Martinique Montserrat Netherlands Antilles Puerto Rico St. Kitts, Nevis,
Anguilla
St. Lucia
St. Pierre and Miquelon
St. Vincent
Surinam
Turks and Caicos Islands
Virgin Islands (U. K. Virgin Islands (U. S.
a)20 744 000 3 453 000
70 619 000 17909000 7736000 14132 000
1171000 6797000 2 999 000
4317000
b) 2 454000
3 765 000 4156000 1838000
b) 1620 000
34988000 1477000 1062 000 1768000
10116000 841000 179992000 2 832 000 7364000 54000 105000 232000 44000 567 000 90000 42000 8000 60000 2 000
) 33000
89000 269000 283 000 12 000 190000 2362 000 57000 86000 5000 80000 270000 6000 7000 32000 21078000 3 500000 72 729000 18269000 7938000 14 443 000 1225000
6933000
3 110000 4455000 2 523 000
3 886000 4249000 1893000 1634000 36 091000 1526000 1 115000 1812 000 10365000 867000 183 057 000 2 873000 7612000 56000 108000 232 000 45000 583 000 94000 43000 8000 61000 2 000 34000 90000 279000 290000 13000 194000 2 409 000
59000 89 000 5000 82 000 283000 6000 8000 33 000 21418000 3 54900C 74 902 00C 18 600 00
802900C 14 769 00
1274000 7 06800C 3 220000
4 581000 2 627 000 4 017000
4 346000 1950 000 1641000
37 233 000
1578000
1 146000
1857000 10 620000
894 000
185 890000
2 914000 7872000 58000 111000 232 000 46000 598 000 96000 45000 8000 61000 2000 34000 91000 289000 297000 13 000 198000 2460000 60000 92 000 5000 82 000 307000 6000 8000 35000
21 762 000
3596000
77141000 18928000
8222 000
15 098 000
1338000
7203000
3 334 000 4 726000
2 721000 4095 000 4 448000 2 008000 1687000 38416000
i)
16280001177000 1 903 000 10 881000 d) 921000 188616000 )2955000 8144000
60000 114 000
235 000
47000 612 000 99000 50000 8000 62 000 2 000
35000
91000 297 000 303 000 13 000 202 000
2 513000 61000 95 000 5 000 82 000 330000 6000 8000 37000
a) Census figure inconsistent with series; replaced with previous estimate; b) Differs from UN publications; c) Series estimated on basis of growth between last two censuses; d) PAHO estimate Sources: United Nations, Monthly Bulletin of Statistics, June 1964;
Population and Vital Statistics Reports, Statistical Papers, Series A, April 1, 1964; Demographic Yearbook, 1962
For the territories, figures for 1963 are mainly PAHO estimates based on U. N. series.
of the population is the division of the labor force into three sectors of activity, (Table 5 and Figure 4).
FIGURE 7
RATIO OF STUDENTS IN PRIMARY AND SECONDARY
SCHOOLS TO POPULATION IN AGE GROUP 5-14 YEARS IN LATIN AMERICAN COUNTRIES, 1954 AND 1960
MIDDLE AMERICA
.P- - I--l~TRINIDAD
CUBA
pCOSITA RICA JAMAICA
...
~
.~ DOMINICANo,,-w / / REPUBLIC
MEXICO EL SALVADOR
GU TtEMALA
NICARAGUA ''''----..-'oHdAIIl
n
nr I I
1954 1960
SOUTH AMERICA
wPARAGUAY
-- ARGENTINA
U, CHILE
- rf -URUGUA¥ VENEZUELA PERU
ECUADOR
OLOMBIA BRA UZI -BOLíVIA
1954 1960
YEAR
employed in agricnlture. iFor the three regions of the Americas the distribution of the labor force into three sectors, namely, agriculture, industry, and trades and services is shown. Three rather distinctive patterns emerge with Northern and Middle America at the extremes and South America in the intermediate position. In Northern America only 8.6 per cent of the economically active population is employed in agriculture and mining as compared to 32.6 in South and 56.7 per cent in Middle America. Industry ac-counts for over one third of the employed in Northern
America (34.5 per cent), 27.0 per cent in South and 17.0 per cent in Middle America. As regards the remaining sector, trade and services, the largest proportion is found in Northern America, 56.9 percent, as against 40.4 per cent in South and 26.3 per cent in Middle America. Per capita national income in a recent year, 1962, (Table 6 and Figure 5) reflects the high employment in agriculture and the resulting low income in many countries.
Another factor closely related to both health and demography is the educational level of the population. One measure commonly used is the ratio of the number of primary and secondary school students to the population in the age group 5-14 years. The limi-tations of the ratio are recognized. The students may not necessarily be from the age group specified and also the younger children in the group may not be admitted to school, for example those of 5 years of age. A second indicator often used is the proportion literate of the population over fifteen years of age. As shown in Figure 6 the ratio of school attend-ance to the population 5-14 years of age has been increasing in Latin America and by 1960 had reached a ratio of 0.55. The range was wide from 0.87 in Trinidad and Tobago and 0.86 in Cubatoa low of 0.24. Data already available are given in Tables 7'and 8 and in Figure 7.
A basic population table (Table 9) has been pre-pared for the years 1960-1963 for countries and other areas of the Americas, which has been used for calculations in this report. For the most part these data are taken from estimates published by the United Nations. Occasionally whenonly provisional figures were available from recent censuses, previous estimations were retained to provide consistency in consecutive years.
BIRTHS
Registered birth rates in the three regions of the Americas have shown little change in the pastdecade, remaining throughout at approximately the same levels. A decrease is observed in Northern America from a rate of slightly over 25 per 1,000 population
ir e per4cd ... l9S3-1D57 to a 'low of 22.7 iLn i962
(Figure 8). In Middle and South America rates have remained at about 43 and 34 per 1,000 population re-spectively. Completeness of birth registration and the procedures and requirements for registration vary widely among the countries in the Region. Estimates
point to underregistration in many areas, which in a few countries may amount to nearly 50 per cent of the total births. This stresses the value of the improve-ment of birth registration to obtain reliable data for planning and evaluating health services as well as for
use in other fields.
In Table 10 are presented for 1961 and 1962 the numbers of live births with rates per 1,0oopopulation for all areas of the Americas except Haiti and Brazil. Shown in the table for Brazil are data for the State of Sao Paulo with a population in 1961 of over 13 mrillion
0.9
0.9
0.{
0.;
0.I
O.
o 4 .K
w
0.
0.3
0.2
0.1
and for the city of Recife (State of Pernambuco) with a population of 867,000.
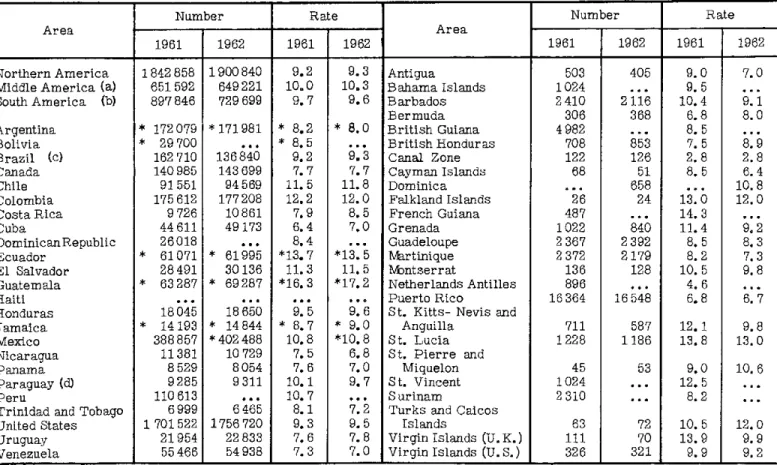
In nine of the countries, registered birth rates exceeded 40 per 1,000 population and in another eight they were between 30 and 40 per 1,000. The highest registered rates, close to 50 per 1,000, were in
countries of Middle America - Costa Rica, El
Salvador and Guatemala. The lowest were in Argentina, United States and Uruguay, approximately 22 per 1,000 population. The areas other than countries showed similar variation with birth rates ranging from 16 to 49 per 1,000 population. In seven areas the rates were in excess of 40 per 1,000.
TABLE 10. NUMBER OF LIVE BIRTHS WITH RATES PER 1, 000 POPULATION IN THE AMERICAS, 1961-1962
Number Rate Number Rate
Area Area
1961 1962 1961 1962 1961 1962 1961 1962
Northern America 4 745 303 4 638 359 23. 6 22.7 Antigua 1768 1787 31.6 30.8 Middle America (a) 2749469 2 706 028 42. 4 42.6 Bahama Islands 2943 2865 27.3 31.2 South America (b) 2947006 2037847 34.1 33.7 Barbados 6805 6883 29.3 29.7
Bermuda 1184 1185 26.3 25.8
Argentina *470214 *472899 *22.3 *22.1 British Guiana * 22 864 24012 *39.2 40.2
Bolivia * 93 145 ... * 26. 6 ... British Honduras 4 244 4461 45.1 46. 5
Brazil (c) 471689 ... 33.0 ... Canal Zone 781 735 18.2 16.3
Canada 475 700 469 693 26.0 25.3 Cayman Islands 277 290 34.6 36.3
Chile 263 985 275 960 33.3 34.4 Dominica . 2 566 ... 42. 1
Colombia 626120 658104 43.4 44.6 WFalkland Islands 48 49 24.0 24.5 Costa Rica (d) 57 385 53 720 50.7 49.2 French Guiana 1066 1099 31.4 32.3 Cuba (e) 225 400 236 653 32.5 33.5 Grenada 3 691 3419 41.0 37.6
Dominican Republic 102 585 ... 33.0 ... Guadeloupe 10 047 10 914 36.0 37.8
Ecuador *199 081 * 202 995 *44.7 *44. 3 Martinique 10488 10 641 36.2 35.8 El Salvador 124871 127 315 49. 5 48.5 Montserrat 335 324 25.8 24.9 Guatemala *193883 * 191420 * 49. 9 *47. 7 Netherlands Antilles 6338 6 529 33.7 32.9
Haiti ... .. .. ... Puerto Rico 75418 76 596 30.3 31.4
Honduras 85842 92 128 45. 3 47. 2 St. Kitts - Nevis and
Jamaica * 66945 * 66948 * 41.0 * 40.8 Anguilla 2038 2112 34.5 35.2 Mexico 1621917 1662790 44.9 44.7 St. Lucia 4011 3935 45.1 42.8 Nicaragua 59 582 60020 39.0 38.0 St. Pierre and
Panama 43 200 44 960 38.7 39.2 Miquelon 93 119 18.6 23.8
Paraguay 49405 ... 27.3 ... S t. Vincent 3986 ... 48.6 ...
Peru 396356 ... 38.2 .. S urinam 12 600 ... 44.5 ...
Trinidad and Tobago 32 991 34 111 38.1 38. 2 Turks and Caicos
United States 4268326 4167362 23.3 22.4 Islands 244 252 40.7 42.0 Uruguay * 65450 ... *22. 5 Virgin Islands (U.K.)I 261 283 32.6 35.4 Venezuela *340433 * 337279 *44. 7 *42.8 Virgin Islands (U.S.) 1193 1371 36.2 39.2
* Provisional.
(a) Excludes Haiti and Dominica in 1961 and Dominican Republic, Haiti and St. Vincent in 1962. (b) Excludes Uruguay in 1961, and Bolivia, Brazil, Paraguay, Peru and Surinam in 1962. (c) Data for the State of Sao Paulo and the city of Recife. (d) By year of occurrence. (e) Estimated by country.
DEATHS
Crude death rates for the three regions of the Americas - that is the number of deaths per 1,000 population of all ages - are at present similar in magnitude. In 1962 the death rate for Northern America was 9.3 per 1,000 population, for Middle America
FIGURE 8
BIRTHS, DEATHS AND EXCESS OF BIRTHS OVER DEATHS PER 1000 POPULATION
IN THE THREE REGIONS OF THE AMERICAS, 1953-1962
50.0
40.0
Z
O
I
-o
o o o
&U el
30.01
20.01
10.0
5.0
NORTHERN AMERICA
BIRTHS
EXCESS
- DEATHS
* «
u T~~~~~~~~~~~~~
MIDDLE AMERICA
BIRTHS
- EXCESS
OEATHS
1953 55 57 59 61 53 55 57
YEARS
In Table 11 the numbers of deaths with rates per 1,000 population are shown for 1961 and 1962 for all countries and other areas of the Americas with the exception of Haiti and Brazil. For Brazil mortality data for the State of Sao Paulo and the cities of Rio de Janeiro (State of Guanabara) and Recife (State of Pernambuco) with a combined population in 1961 of almost 18 million are presented. In the countries of the Region mortality rates varied in 1962 from 6.8 per 1,000 population in Nicaragua to 17.2 in Guate-mala. In the other areas the range was from 2.8 to 13.0. For 16 of the 23 countries for which rates are shown the mortality was less than 10 per 1,000 population. Similarly in 18 of the 25 territories mortality had fallen below 10 per 1,000 by 1962.
Tn Fiprire 8 iS shovm t+he trend ^f th' o.e dea-o+th
rates in the three regions from 1953 through 1962. No change is observable in Northern America where
SOUTH AMERICA
BIRTHS
EXCESS
DEATHS
59 61 53 55 57 59 61
each year the proportion of persons increases in the older age groups in which mortality rates are highest.
However age adjustment produces death rates which decrease by approximately 10 per cent in the decade ( 1 ). While the crude death rate in Northern America has remained unchanged that in Middle America has decreased by 25 per cent in the same decade and that in South America by 15 per cent.
Data on causes of death are available for 22 of the countries and 18 of the other areas of the Region for 1962 or for an earlier year. Causes of death are given in accordance with a slight expansion of the B List of the International Classification of Diseases. The main sources of data are the questionnaires com-pleted by the countries in response to the requests
World Health Organization for the Supplement to the Second Report on the World Health Situation,
1961-(1) Trends, 1963, U.S. Health, Education and Welfare Department, Washington D. C.
-1962, and for annual mortality tabulations in accord-ance with the A List of the Classification. In a few instances data were supplemented from other sources.
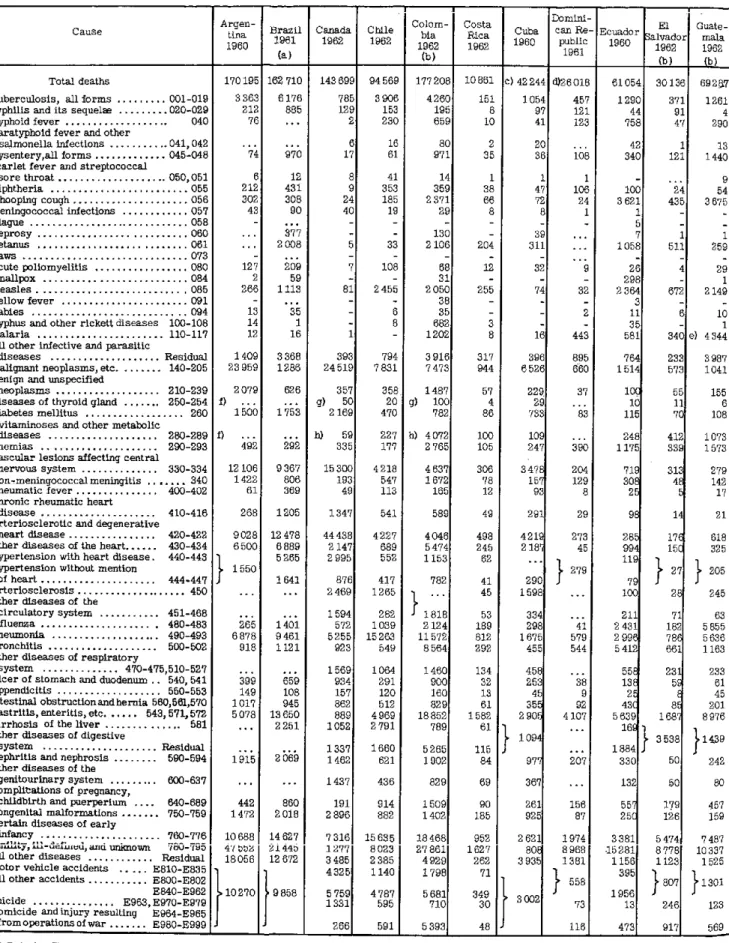
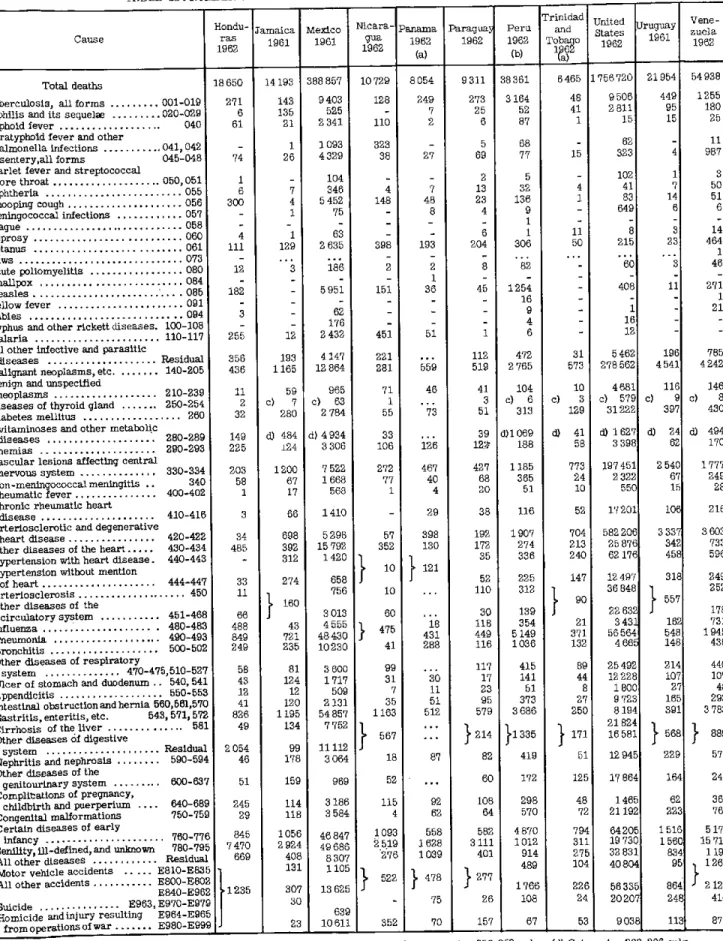
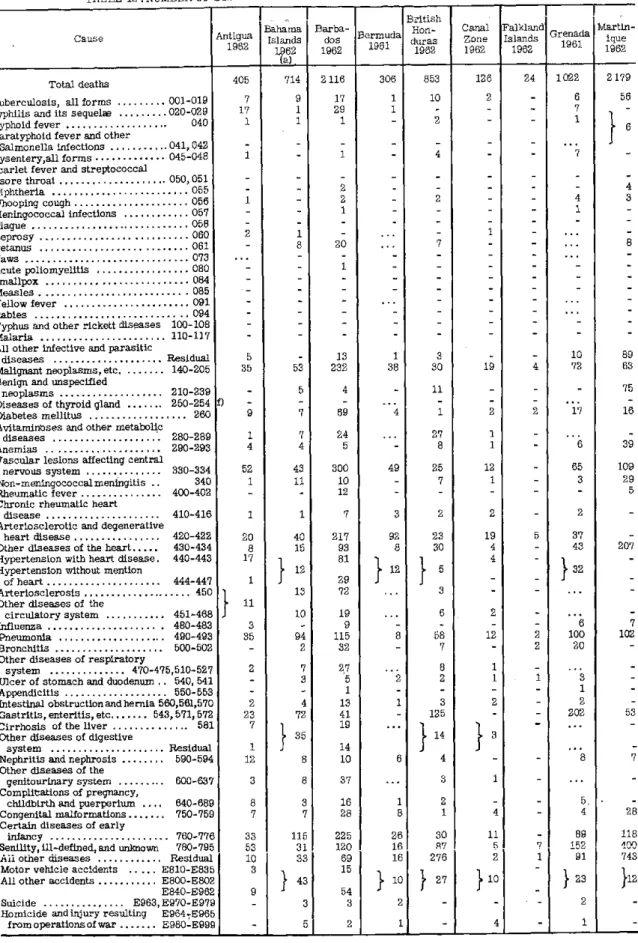
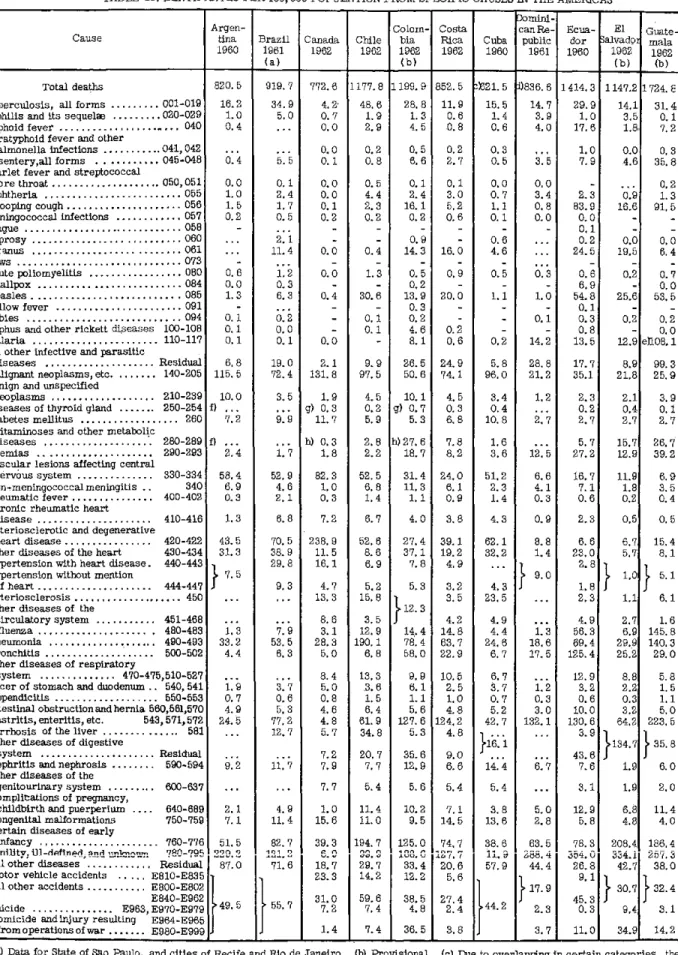
The numbers of deaths from specific causes are given in Table 12 and the rates per 100,000 population in Table 13. An understanding of the limitations of these data, of the extent and quality of the medical certification, is essential for their interpretation and use. In spite of their limitations these data furnish useful indices for the evaluation of health conditions
in the Region and of the quality of the statistical
information.
As in previous reports the first five principal causes of death have been determined for each country
(Table 14). The method of grouping used for selection of the principal causes is that recommendedbyCuriel which excludes residual groups of diseases and the fil
defined and unknown causes (2).
In the last decade a noticeable change has been observed in the leading causes of death with a shift away from the communicable diseases as the leading causes. In five of the 22 countries gastritis and enteritis, mainly infectious in origin, retains its im-portance as the leading cause and infive influenza and pneumonia is the principal cause of mortality. How-ever in seven countries diseases of the heart is now the first cause and in two malignant neoplasms.
TABLE 11. NUTMBER OF DEATHS WITH RATES PER 1, 000 POPULATION IN THE AMERICAS, 1961-1962
Number Rate Number Rate
Area Area
1961 1962 1961 1962 1961 1962 1961 1962
Northern America 1842 858 1900840 9.2 9. 3 Antigua 503 405 9.0 7. 0 Middle America (a) 651 592 649 221 10.0 10.3 Bahama Islands 1024 .. 9. 5
South America (b) 897846 729 699 9.7 9.6 Barbados 2 410 2116 10.4 9.1
Bermuda 306 368 6.8 8.0
Argentina * 172079 * 171981 * 8.2 * 8.0 British Guiana 4982 ... 8. 5
Bolivia * 29 700 ... * 8.5 ... British Honduras 708 853 7. 5 8. 9
Brazil (c) 162 710 136 840 9.2 9.3 Canal Zone 122 126 2. 8 2. 8 Canada 140 985 143 699 7. 7 7. 7 Cayman Islands 68 51 8. 5 6. 4
Chile 91551 94 569 11. 5 11.8 Dominica .. 658 ... 10.8
Colombia 175 612 177 208 12.2 12.0 Falkland Islands 26 24 13. 0 12. 0
Costa Rica 9 726 10 861 7.9 8.5 French Guiana 487 ... 14. 3
Cuba 44 611 49173 6.4 7.0 Grenada 1022 840 11.4 9.2
Dominican Republic 26018 ... 8.4 ... Guadeloupe 2 367 2 392 8. 5 8.3
Ecuador * 61071* 61995 *13. 7 *13.5 lVartinique 2 372 2179 8.2 7. 3 El Salvador 28491 30136 11.3 11.5 lVbntserrat 136 128 10. 5 9.8 Guatemala * 63287 * 69287 *16.3 *17.2 Netherlands Antilles 896 ... 4.6 .
Haiti ... ... ... ... Puerto Rico 16364 16548 6. 8 6. 7
Honduras 18045 18650 9.5 9.6 St. Kitts- Nevis and
Jamaica * 14193 * 14 844 * 8.7 * 9.0 Anguilla 711 587 12. 1 9.8 Mexico 388857 *402488 10.8 *10.8 St. Lucia 1228 1186 13. 8 13.0 Nicaragua 11381 10 729 7. 5 6.8 St. Pierre and
Panama 8 529 8 054 7. 6 7.0 Miquelon 45 53 9.0 10. 6
Paraguay (d) 9285 9 311 10. 1 9. 7 St. Vincent 1024 ... 12.5 .
Peru 110 613 ... 10. 7 ... S urinam 2 310 ... 8.2 ...
Trinidad and Tobago 6999 6 465 8.1 7.2 Turks and Caicos
United States 1 701 522 1756 720 9.3 9. 5 Islands 63 72 10. 5 12.0 Uruguay 21954 22 833 7. 6 7. 8 Virgin Islands (U. K.) 111 70 13. 9 9. 9 Venezuela 55 466 54 938 7. 3 7. 0 Virgin Islands (U. S.) 326 321 9. 9 9. 2
* Provisional
(a) Excludes Haiti and Dominica in 1961 and Dominican Republic, Haiti, Bahama Islands, Netherlands Antilles and St. Vincent in 1962. (b) Excludes Bolivia, Peru, British Guiana, French Guiana and Surinam in 1962. (c) Data for State of Sao Paulo and cities of Recife and Rio de Janeiro. (d) Area of information only.
(2) Curiel, D., Causas Principales de Muerte, Boletin de la Oficina Sanitaria Panamericana,
TABLE 12. NUMBER OF DEATHS FROM SPECIFIC CAUSES IN THE AMERICAS
Domini-~~~Cause
tign- B1razid1 a Cl Colom- Costa 1Cua DcalnRi- Ecuadr EGuate-Argetin-ai bla Rica 19 alvador mala
1961 1962 1962 __a
1960 62 1962 1 961 19
1
1962 1962(a) ____1961 (b> (b>
Total deaths
Tuberculosis, all forms ... 001-019 Syphilis and its sequelae ... 020-029
Typhoid fever ... 040
Paratyphoid fever and other
salmonella infections ... 041,042 Dysentery,all forms ... 045-048 Scarlet fever and streptococcal
sore throat ... 050,051 Diphtheria ... 055 Whooping cough ... 056 Meningococcal infections ... 057 Plague ... 058
Leprosy ... 060
Tetanus ... 061
Yaws ... 073 Acute poliomyelitis ... 080 Smallpox ... 084 Measles ... 085 Yellow fever ... 091 Rabies ... 094 Typhus and other rickett diseases 100-108 Malaria ... 110-117 All other infective and parasitic
diseases ... Residual Malignant neoplasms, etc ... 140-205 Benign and unspecified
neoplasms ... 210-239 Diseases of thyroid gland ... 250-254 Diabetes mellitus ... 260 Avitaminoses and other metabolic
diseases ... 280-289
Anemias ... 290-293
Vascular lesions affecting central nervous system ... 330-334 Non-meningococcal meningitis ... 340 Rheumatic fever ... 400-402 Chronic rheumatic heart
disease ... 410-416 Arteriosclerotic and degenerative
heart disease ... 420-422 Other diseases of the heart ... 430-434 Hypertension with heart disease. 440-443 Hypertension without mention
of heart ... 444-447 Arteriosclerosis ... 450 Other diseases of the
circulatory system ... 451-468 Influenza ... 480-483 Pneumonia ... 490-493 Bronchitis ... 500-502 Other diseases of respiratory
system ... 470-475,510-527 Ulcer of stomach and duodenum .. 540, 541 Appendicitis ... 550-553 Intestinal obstructionandhernia 560,561,570 Gastritis, enteritis, etc ... 543, 571, 572 Cirrhosis of the liver ... 581 Other diseases of digestive
system ... Residual Nephritis and nephrosis ... 590-594 Other diseases of the
genitourinary system ... 600-637 Complitations of pregnancy,
childbirth and puerperium .... 640-689 Congenital malformations ... 750-759 Certain diseases of early
infancy ... 760-776 Snility, U-def;ld, and unnimown 780-795 All other diseases ... Residual Motor vehicle accidents ... E810-E835 All other accidents ... E800-E802 E840-E962 Suicide ... E963, E970-E979 Homicide and injury resulting E964-E965 from operations of war ... E980-E999
170195 162 710 143699 94569 177208 10 861 c) 42244 d)26018
3 363 6 176
212 885
76 ...
... 74 6 212 302 43 127 2 266 13 14 12 1 409 23 959 2079 f) . . . 1 50
f) .. 492 12 106 1422 61 268 9028 6500
} 1550
265 6878 918 399 149 1017 5078 ... ... 442 1 472 10688
41 002Z 18056
t10270
970 12 431 308 90 ... 377 2008 209 59 1 113 35 1 16 3368 1286 626 1 753 ... 292 9 367 806 369 1205 12 478 6889 5 265 1641 ... ... 1401 9 461 1121 659 108 945 13 650 2 25119i-5 2069
...
860 2 018
14627
Z1 44b
12 672
t9858
785 129 2 6 17 8 9 24 40 5 7 81 1 393 24519 357g) 50
2 169
h) 59
335
15 300 193 49
1347
44 438 2 147 2 995 876 2 469 1 594 572 5255 923 1569 934 157 862 889 1052 1 337 1 462 1437 191 2 896
7 316 1277 3 485 4325 5 759 1331 266 3 906 153 230 16 61 41 353 185 19 33 108 2455 6 8 794 7 831 358 20 470 227 177 4218 547 113 541 4227 689 552 417 1265 282 1039 15 263 549 1064 291 120 512 4 969 2791 1 660 621 436 914 882 15 635 8023 2385 1140 4 787 595 591 4260 195 659 80 971 14 359 2371 29 130 2 106 68 31 2 050 38 35 682 1202 3916 7 473 1487 g> 100 782
h) 4072 2 765 4637 1 672 165 589 4046 5 474 1153 782
1818
2124 11572 8 564 1460 900 160 829 18 852 789 5265 1 902 829 1509 1 402
18 468 27 861 4 929 1798 5 681 710 5 393 151 8 10 2 35 1 38 66 8 204 12 255 3 8 317 944 57 4 86 100 105 306 78 12 49 498 245 62 41 45 53 189 812 292 134 32 13 61 1582 61 115 84 69 90 185 952 1627 262 71 349 30 48
1054 457
121 123
D ... 108 1 106 24 1 ... 9 32 2 443 895 6-60 37 83 390 204 129 8 29 273 45 }279 41 579 544 38 9 92 4 107 ... 207 156 87 97 41 20 36 1 47 72 8 39 311 32 74 16 396 6526 229 29 733 109 247 3 478 157 93 291 421 218 ... 290 1598 334 298 1675 455 458 253 45 35 2 90
} 109
97 367 261 925 808 3 935
3 002
2 621 1974
8 968 1381
} 558
73 116 61054 129C 44 751 42 340 100 3621 1051 21 291 2364 2 11 31 581 764 1514 10( 1c 115 248 1175 719 308 25 98 285 994 119 79 100 211 2 431 299 541 55 13 2 43 5 639 16 1 884 330 13 55 25 3013( 37: 9: 4' 12: 431 511 672 34C 23n 571 51 11 7C 412 331 31.2 41 14 17e 151
27
28 71 182 786 661 23 5 8 168} 3538
50 50
179 126
3 69287
1 1261
1 4
7 290
1 13
1 1440
9
4 54
5 3 675
1 1
1 259
4 29
1 2 149
10 1 e) 4 344
3 3 987
3 1041
155 6 108
2 1073
1 573 279 142 17 21 618 325 205 245 63 5 855 5636 1 163 233 61 45 201 8976 }1439 242 80 457 159
3381 5474 7487
15281 1 156 395 1956 13 473 8 778 1 123
} 807
246
917
10 337 1 525
} 1301
123
569
(a) Data for State of Sao Paulo, and cities of Recife, and Rio de Janeiro. (b) Provisional. (c) Due to overlapping in certain categories, the total reported for all causes (42, 244) is less than the total (43, 198) obtained by the addition of categories. (d) Total classified by cause amounting to 23,389 deaths. (e) Includes 4, 268 deaths classified as due to malaria not medically certified. (f) Included in residual all other diseases. (g) Categories 250-252. (h) Categories 280-286 only.
1 <, I I sv I