and timely administered based on an electronic
immunization registry, Araraquara-SP, Brazil, 2012-2014*
Correspondence:
Márcia de Cantuária Tauil – Av. Dr. Arnaldo, No. 715, Cerqueira Cesar, São Paulo-SP, Brasil. CEP: 01246-904 E-mail: [email protected]
Abstract
Objective: to describe vaccine coverage by type of vaccine at 12 and 24 months of age. Methods: descriptive cohort study with children born in 2012, living in Araraquara-SP, Brazil, recorded in the Information System on Live Births (Sinasc); a manual linkage of Sinasc data with an electronic immunization registry (EIR) was performed; the assessment was based on vaccination status according to São Paulo State recommendations, and on doses received and timely administered. Results: 2,740 children were registered on Sinasc and 99.6% of them were included into EIR; among the 2,612 (95.3%) children studied, the triple viral vaccine (measles, mumps and rubella) had the lowest coverage at 12 months for received dose (74.8%) and at 24 months for timely vaccination (53.5%) and received doses (88.0%). Conclusion: coverage was higher than 90% for most vaccines; however, delayed vaccination was observed, which indicates the need to intensify actions aimed at timely vaccination.
Keywords: Child; Immunization Coverage; Electronic Health Record; Epidemiology, Descriptive; Cohort Studies.
doi: 10.5123/S1679-49742017000400014
*This article was based on the PhD thesis defended by Márcia de Cantuária Tauil, to the School of Public Health, University of São Paulo, in 2017. This study was funded by the Coordination for the Improvement of Higher Education Personnel (CAPES), the Ministry of Education (MEC), and São Paulo Research Foundation (FAPESP). The main author received a doctorate scholarship (FAPESP: Process No. 2014/11714-7), and Ana Paula Sayuri Sato received research assistance (FAPESP: Process No. 2014/05183-9).
Márcia de Cantuária Tauil1
Ana Paula Sayuri Sato2
Ângela Aparecida Costa2
Marta Inenami2
Vinícius Leati de Rossi Ferreira1
Eliseu Alves Waldman2
1Universidade de São Paulo, Programa de Pós-Graduação em Saúde Pública, São Paulo-SP, Brasil
Introduction
Brazil has a routine immunization schedule, of universal and free access. Besides the vaccination routine in health services, the National Immunization Program (NIP) uses the strategy of national vaccination days in order to increase vaccination coverage.1 The coverage
achieved by NIP vaccines is usually high,2 although it is
not always homogeneous among different social groups and different vaccines.3,4
The estimates of vaccination coverage in Brazil are obtained through administrative method, where the numerator is defined by the number of vaccine doses administered that are registered in the health units, and the denominator is defined by the population estimates.5
This method supports the planning of NIP actions, but it is inaccurate, because it does not allow the identification of micro areas of low coverage; therefore, it is necessary to carry out periodic vaccination coverage surveys.6
An electronic and nominal registration system of vaccination is especially important when it comes to understanding the vaccination coverage, particularly in a scenario where there is periodic incorporation of new vaccines.5 Electronic immunization registry (EIR) assist
in the scheduling of vaccines and identification of absent patients. They are useful instruments for achieving and maintaining high vaccination coverage, which helps preventing the reoccurrence of diseases that are already under control. The EIR also allow an analysis of vaccination opportunity, that is, vaccination at the recommended age with proper intervals between doses, once they provide individual data, with date and batch of each dose received.7
Studies based on electronic vaccination systems in Brazil are scarce.3 This fact enables researches that use these
systems as data sources, especially in the current process of implementation of NIP Information System (IS-NIP), which has national coverage.5 In Latin America, only a few studies
have assessed vaccination opportunity regarding the schedule compliance over time.8,9 For the immunization programs,
monitoring the immunization status at the appropriate age is essential to identify missed immunization opportunities, and to define the disease risk in the population, especially those diseases in which age is a risk factor related to severity or higher occurrence of complications8,10 – for instance,
the vaccine against tuberculosis (Calmette-Guérin bacillus [BCG]), administered at birth, preventing tuberculous meningitis in the first year of life.
Regarding the assumptions presented, this study aimed to describe the vaccine coverage according to vaccine type at 12 and 24 months of age, in the municipality of Araraquara, São Paulo State, Brazil.
Methods
This is a descriptive cohort study, carried out in Araraquara-SP, from 2012 to 2014.
In 2011, Araraquara had an estimated population of 210,673 inhabitants;11 2,569 were recorded as live births
in that year.2 In 2010, the local Human Development Index (HDI) was 0.815, ranking 14th in the national
HDI classification by municipality.12 In that same year,
the proportion of resident population with monthly per capita household income of up to half a minimum wage was 12.6%; and the proportion of illiterates aged 15 or more, 3.3%.2
Since 1987, the Special Health Service of Araraquara (SHSA), a school health unit of the School of Public Health of the University of São Paulo (USP), assisted by São Carlos IT Center also from USP, has been managing the first EIR implemented in the country. In 2011, this registry was reformulated and became part of the online information and management system in Public Health, named 'Juarez' in honor of Professor Edmundo Juarez, of the School of Public Health/USP, who directed SHSA for many years and founded EIR. This system has four components: (i) outpatient registration and control; (ii) health program and epidemiological surveillance; (iii) laboratory control; and (iv) vaccination control. In the 'vaccination control' component, it is possible to obtain detailed vaccination data from children born and/or residents in the municipality.13
As it is a consolidated program, Araraquara EIR allows detailed analyses of the vaccination coverage in this medium-sized municipality. The individuals' immunization schedules are filed in it, in order to reduce the possibility of information loss, as well as to allow access to this information from any primary health care unit of the municipality.
An electronic and nominal registration
system of vaccination is especially
important when it comes to
In Araraquara, at the time of the study, there were 28 primary health care units that performed vaccination activities, and the health professionals of each unit had access to EIR data in real time, including vaccination data into the system daily. In turn, the five private services from the municipality sent periodically nominal information, regarding vaccination activities, to SHSA, so that it could be included into Juarez System (information collected by the SHSA team).
The study population was composed by the cohort of live births of mothers resident in Araraquara, registered at the Information System on Live Births (Sinasc) from January 1st to December 31st, 2012. Children who moved
from the municipality were excluded, as well as those who died before 13 months of age, whose death was recorded at the Mortality Information System (SIM). The identification of the children who moved from the municipality was based on EIR data, and it was not possible to obtain the moving date. Sinasc is filled in with the Declaration of Live Birth (DLB), an official standardized document that is mandatory throughout the country and required in order to register the child at the civil registry office.14, 15
The study variables were those related to the immunization status, that is, date of birth and age at the time of vaccination, vaccines received according to the recommendations of São Paulo State Health Department in 2012 and 2013, date of vaccine administration, doses received and dose intervals.
The sources of data used were Sinasc and SIM, databases provided by the Municipal Health Department; and Juarez System EIR, database provided by SHSA.
In order to verify if all live births in 2012 of mothers resident in Araraquara-SP and registered at Sinasc (2,740 records) had also been included into EIR (3,194 records), these databases were manually linked. Previously, the consistency of the data was verified: for example, the dates of vaccines that were not registered in ascending order, along with the doses administered, were reorganized. We also verified the existence of duplications in both databases. After organizing the mothers’ names alphabetically in both databases, the variables 'child's birth date', 'child's sex', 'residence address' and 'gestation type' were used to verify possible duplicities, one by one.
Afterwards, deaths were excluded according to SIM data from 2012 to 2014 (30 records), through manual search, by checking the pairs according to mother's
name, child's date of birth, child's sex, birth weight and DLB number. Therefore, the final database used in the analysis was constituted.
The EIR analysis was based on two indicators: coverage and duplication of records. Coverage was calculated in percentage; the number of children registered at EIR was the numerator, and the denominator was the total number of children born to women living in the municipality of Araraquara, registered at Sinasc. A study published in 2008, when the databases of the civil registry and Sinasc were linked, showed that there was a difference of less than 1% between these two bases, which is why, in this study, Sinasc was considered gold standard.16 Duplicity was calculated considering the
number of children duplicated at EIR as the numerator and the total number of children registered at EIR as the denominator.
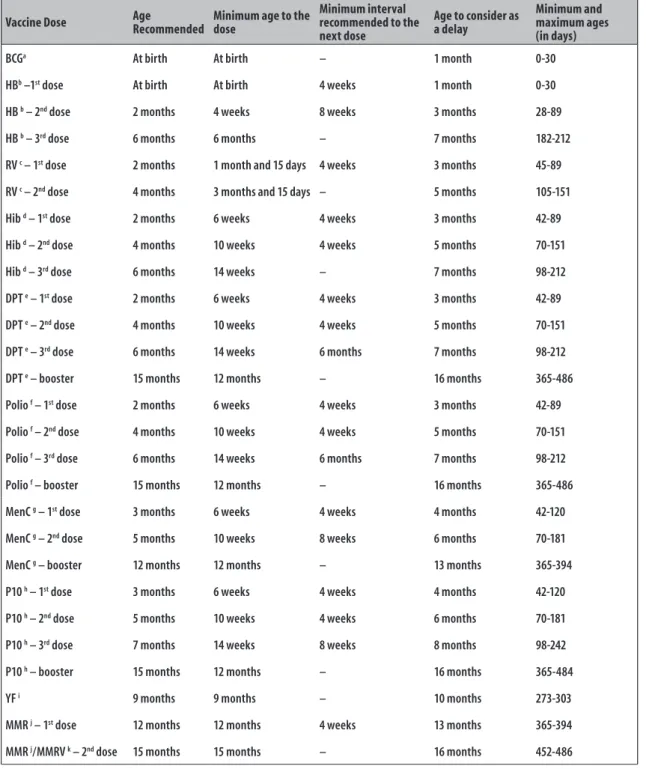
The immunization status was assessed based on recommendations of São Paulo State Health Department, published in 2012 and 2013.17 Figure 1 presents
a table adapted from the recommendations of the Brazilian National Immunization Program18 and the
Centers for Disease Control and Prevention of the United States (CDC/US).19 The delay was defined by a
vaccine received a month after the age recommended by the immunization routine. The vaccination coverage was analyzed according to the doses received – doses recommended according to the vaccination schedule up to the maximum ages of 12 months (394 days) and 24 months (730 days) –; and timely doses – recommended doses according to the vaccination schedule, taking into account the minimum and maximum age when each vaccine was administered, and the appropriate intervals between doses.17
Vaccination coverage was calculated by considering the children recorded at EIR who received all doses of each vaccine as the numerator and, as the denominator, the total number of children recorded at Sinasc and EIR (after excluding deaths and those who had moved from Araraquara).
Vaccine coverage, according to vaccine type, was estimated in accordance with the respective 95% confidence intervals (95% CI), at 12 and 24 months of age, according to doses received and timely administered doses.
Vaccine Dose Age Recommended Minimum age to the dose
Minimum interval recommended to the next dose
Age to consider as a delay
Minimum and maximum ages (in days)
BCGa At birth At birth – 1 month 0-30
HBb –1st dose At birth At birth 4 weeks 1 month 0-30
HB b – 2nd dose 2 months 4 weeks 8 weeks 3 months 28-89
HB b – 3rd dose 6 months 6 months – 7 months 182-212
RV c – 1st dose 2 months 1 month and 15 days 4 weeks 3 months 45-89
RV c – 2nd dose 4 months 3 months and 15 days – 5 months 105-151
Hib d – 1st dose 2 months 6 weeks 4 weeks 3 months 42-89
Hib d – 2nd dose 4 months 10 weeks 4 weeks 5 months 70-151
Hib d – 3rd dose 6 months 14 weeks – 7 months 98-212
DPT e – 1st dose 2 months 6 weeks 4 weeks 3 months 42-89
DPT e – 2nd dose 4 months 10 weeks 4 weeks 5 months 70-151
DPT e – 3rd dose 6 months 14 weeks 6 months 7 months 98-212
DPT e – booster 15 months 12 months – 16 months 365-486
Polio f – 1st dose 2 months 6 weeks 4 weeks 3 months 42-89
Polio f – 2nd dose 4 months 10 weeks 4 weeks 5 months 70-151
Polio f – 3rd dose 6 months 14 weeks 6 months 7 months 98-212
Polio f – booster 15 months 12 months – 16 months 365-486
MenC g – 1st dose 3 months 6 weeks 4 weeks 4 months 42-120
MenC g – 2nd dose 5 months 10 weeks 8 weeks 6 months 70-181
MenC g – booster 12 months 12 months – 13 months 365-394
P10 h – 1st dose 3 months 6 weeks 4 weeks 4 months 42-120
P10 h – 2nd dose 5 months 10 weeks 4 weeks 6 months 70-181
P10 h – 3rd dose 7 months 14 weeks 8 weeks 8 months 98-242
P10 h – booster 15 months 12 months – 16 months 365-484
YF i 9 months 9 months – 10 months 273-303
MMR j – 1st dose 12 months 12 months 4 weeks 13 months 365-394
MMR j/MMRV k – 2nd dose 15 months 15 months – 16 months 452-486
a) BCG: Bacillus Calmette-Guérin vaccine. b) HB: hepatitis B vaccine. c) RV: rotavirus oral vaccine.
d) Hib: Haemophilus influenzae type b vaccine.
e) DPT: triple bacterial vaccine (combined vaccine against diphtheria, tetanus and whole-cell pertussis, includes the acellular bacterial vaccine [DPaT]). f) Polio: includes the attenuated poliomyelitis 3-valent oral vaccine (VOP) and the inactive poliomyelitis 3-valent injectable vaccine (VIP). g) MenC: meningococcal C conjugate vaccine.
h) P10: pneumococcal 10-valent conjugate vaccine. i) YF: yellow fever vaccine.
j) MMR: measles, mumps and rubella vaccine. k) MMRV: measles, mumps, rubella and varicella vaccine.
Note: The table was adapted from the recommendations of the Brazilian National Immunization Program18 and the Centers for Disease Control and Prevention/EUA.19
The modified Kaplan-Meier curve21 was used in
order to visualize the proportion of children timely vaccinated, in agreement with the vaccine schedule up to 24 months of age. Time zero indicates the birth of the children and, for the analysis of time spent until the event, we considered as event not receiving the vaccine doses recommended in the indicated time interval (Figure 1), that is:
a) event 1 (BCG; hepatitis B vaccine [HB 1]); b) event 2 (combined vaccine against diphtheria,
tetanus and pertussis [DTP 1], polio vaccine [Polio 1], Haemophilus influenzae type b vaccine [Hib 1], rotavirus oral vaccine [RV], HB 2 );
c) event 3 (10-valent pneumococcal conjugate vaccine/13-valent conjugated pneumococcal vaccine [PCV 1]; meningococcal C conjugate vaccine [MenC 1]); d) event 4 (DTP 2, Polio 2, Hib 2, RV 2);
e) event 5 (PCV 2; MenC 2);
f) event 6 (DTP 3, Polio 3, Hib 3, HB 3); g) event 7 (PCV 3);
h) event 8 (yellow fever vaccine [YF]);
i) event 9 (measles, mumps and rubella vaccine [MMR 1], MenC 3); and
j) event 10 (DTP 4, Polio 4, PCV 4, MMR 2)
Children who did not receive the vaccine(s) timely were no longer eligible to be followed up and, therefore, were excluded from the analysis (of the proportion numerator). The child was censored when all the recommended doses of vaccine up to 24 months old had been timely administered.
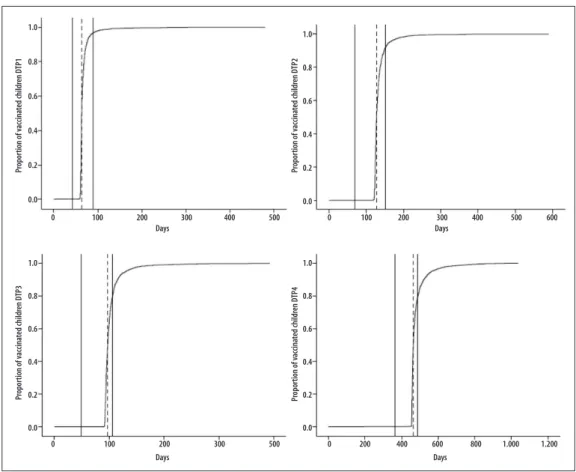
The modified Kaplan-Meier curve [1-s (t)]20 was used
to describe the time spent until each dose of DTP (1st,
2nd, 3rd or 4th dose) and to estimate vaccine coverage
in different moments. The observation period of each child started at birth (time zero) and continued until the date when the last child in the cohort received a certain dose of DTP vaccine. The total period of observation was divided into short time intervals, limited by the date when each child received a dose of DTP. The DTP vaccine was chosen for this analysis because it is (i) one of the vaccines recommended by the World Health Organization,22 it is
(ii) injectable and multi-dose (three doses and a booster) and because of (iii) the long period since it has been included into the vaccination schedule.23 The softwares
used in the analyses were SPSS Statistics version 21 and Microsoft Office Excel for Mac® 2011.
The research project was approved by the Research Ethics Committee of the School of Public Health, University
of São Paulo, on July 3rd, 2014: Protocol No. 707,588
and Certificate of Presentation for Ethical Appreciation (CAEE) No. 30987314.0.0000.5421.
Results
In 2012, 2,740 children born to mothers resident in Araraquara were registered at Sinasc, and no duplicity was found. Out of this total, 2,731 (99.7%) were at Juarez System EIR and 3 (0.1%) were duplicated in this system (n=2,728). EIR coverage was estimated at 99.6% (2,728/2,740). Out of the total number of children identified on Sinasc, 98 (3.6%) were excluded because they had moved from the municipality and 30 (1.1%) were excluded because they had died; all of them were less than 13 months old. Thus, 2,612 children (95.3%) were included in the study.
The number of vaccine schedules identified and included in the study for Polio, DTP, HB, PCV, MMR and Hib vaccines is presented on Table 1. Some explanations for the different vaccine schedules are related to: a) vaccines’ availability at the time of vaccination; b) change of schedules in the period – for example,
the inclusion of the 5-valent vaccine (DTP/Hib/HB) in the second half of 2012 and the MMRV vaccine in 2013 –;
c) recommendation for the child to receive combined vaccine against diphtheria, tetanus and acellular pertussis (DTaP) because of the high risk of post-vaccination adverse event; and
d) the vaccines offered by the private service are not the same as those offered by the public service – for example, 13-valent pneumococcal conjugate vaccine (P13) instead of 10-valent pneumococcal conjugate vaccine (P10).
Table 1 – Number of vaccine schedules included into the study in Araraquara, São Paulo, 2012-2013
Vaccines Number of Vaccine Schedules
HBa 3
Hibb 10
DPTc 24
Poliod 7
PCVe 3
MMRf/MMRVg 2
a) HB: hepatitis B vaccine.
b) Hib: Haemophilus influenzae type b vaccine.
c) DPT: triple bacterial vaccine (combined vaccine against diphtheria, tetanus and whole-cell pertussis, includes the acellular bacterial vaccine [DPaT]). d) Polio: includes the attenuated poliomyelitis 3-valent oral vaccine (VOP) and the inactive poliomyelitis 3-valent injectable vaccine (VIP).
e) PCV: pneumococcal conjugate vaccine; includes pneumococcal 10-valent conjugate vaccine (P10) and pneumococcal 13-valent conjugate vaccine (P13). f) MMR: measles, mumps and rubella vaccine.
g) MMRV: measles, mumps, rubella and varicella vaccine.
Table 2 – Vaccine coverage at 12 and 24 months of age according to doses received and timely administered among the live births (N=2,612), Araraquara, São Paulo, 2012
Vaccine
12 months 24 months
Received dosesa Timely administeredb Received dosesa Timely administeredb
% 95%CIc % 95%CIc % 95%CIc % 95%CIc
BCGd 99.9 99.9;100.0 98.5 98.0;99.0 99.9 99.9;100.0 98.5 98.0;99.0
HBe 98.0 97.4;98.5 78.9 77.3;80.4 98.4 97.9;98.9 78.9 77.3;80.4
RVf 95.0 94.2;95.8 90.0 88.8;91.1 95.0 94.2;95.9 90.0 88.8;91.1
Hibg 96.6 95.9;97.3 77.5 75.9;79.1 97.7 97.1;98.3 77.5 75.9;79.1
DTPh 97.4 96.8;98.0 78.0 76.4;79.6 93.4 92.5;94.4 63.0 61.2;64.9
Polioi 97.5 96.9;98.1 78.1 76.6;79.7 93.4 92.5;94.4 63.1 61.3;65.0
MenCj 75.6 73.9;77.2 68.7 66.9;70.5 95.1 94.2;95.9 68.7 66.9;70.5
PCVk 95.5 94.7;96.3 71.8 70.1;73.5 89.3 88.1;90.5 55.4 53.5;57.3
YFl 93.0 92.0;94.0 80.5 79.0;82.0 95.6 94.8;96.4 80.5 79.0;82.0
MMR/MMRV m 74.8 73.2;76.5 74.6 73.0;76.3 88.0 86.7;89.2 53.5 51.6;55.4
a) Received doses: doses recommended according to the vaccine schedule up to the maximum age of 12 months (394 days) and 24 months (730 days).
b) Timely administered: doses recommended according to the vaccine schedule, considering the minimum and maximum age for each vaccine and the appropriate intervals between doses. c) 95%CI: confidence interval of 95%.
d) BCG: Calmette-Guérin bacillus vaccine – at birth. e) HB: hepatitis B vaccine – at birth, at 2 and at 6 months old. f) RV: rotavirus oral vaccine – at 2 and 4 months old.
g) Hib: Haemophilus influenzae type b vaccine – at 2, 4 and 6 months.
h) DTP: triple bacterial vaccine (combination vaccine against diphtheria, tetanus and whole-cell pertussis, includes the acellular bacterial vaccine [DTaP]) – at 2, 4, 6 and 15 months old. i) Polio: includes the attenuated poliomyelitis 3-valent oral vaccine (VOP) and the inactive poliomyelitis 3-valent injectable vaccine (VIP) – at 2, 4, 6 and 15 months –; 23 (0,9%) children received at
least one dose of 6-valent (DTaP/Hib/HB/VIP) or inactivated 5-valent (DTaP/VIP/Hib).
j) MenC: meningococcal C conjugate vaccine – at 3, 5 and 12 months –; the booster dose was changed in 2013, from 15 to 12 months; the vaccine coverage of the two doses and the booster up to 15 months old is 91,7% (2,395/2,612) – 95%CI 90.6;92.8.
k) PCV: pneumococcal conjugate vaccine; includes pneumococcal 10-valent conjugate vaccine (P10) and pneumococcal 13-valent conjugate vaccine (P13); 20 (0.8%) children received at least one P13 doses – indicated at 3, 5, 7 and 15 months old.
l) YF: yellow fever vaccine – at 9 months old.
had the highest coverage for doses received (93%) and timely administered (63%).
The proportion of children timely vaccinated, in agreement with the recommended doses up to 24 months old, is presented in Figure 2. Among the children followed up, 32.8% timely received all the vaccines. The deepest reduction in the proportion of children timely vaccinated (28.9%) occurred when the vaccines DTP 4, Polio 4, PCV 4 and MMR 2 should have been administered.
The proportion of children vaccinated with each dose of DTP over time can be seen in the four curves of Figure 3. Vaccine coverage for 1st, 2nd, 3rd, and 4th doses were
99.2%, 98.9%, 98, 3% and 94.4%, respectively. Among the children who took the DTP vaccine, there was timely
vaccination for the 1st dose, in 96.6% (2,504/2,592) of
the cases, for the 2nd dose, in 91.8% (2,371/2,582), for
the 3rd dose in 80.0% (2,054/2,568) and for the 4th dose
in 78.6% (1,941/2,468); 50% of the children took the 1st, 2nd, 3rd and 4th doses of DTP at approximately 64, 128,
194 and 464 days, respectively. Vaccine coverage of 1st,
2nd, 3rd and 4th doses of DTP reached approximately 90%
at 75, 150, 233 and 528 days, in that order.
Discussion
Vaccination coverage was above 90% for most of the vaccines analyzed. However, lower percentages were observed concerning the doses timely administered. Analyses over time revealed vaccination delay.
Subtitle:
a) BCG: Calmette-Guérin bacillus vaccine. b) HB: hepatitis B vaccine.
c) DTP: triple bacterial vaccine (combined vaccine against diphtheria, tetanus and whole-cell pertussis, includes the acellular bacterial vaccine [DTaP]). d) Polio: includes the attenuated poliomyelitis 3-valent oral vaccine (VOP) and the inactive poliomyelitis 3-valent injectable vaccine (VIP). e) Hib: Haemophilus influenzae type b vaccine.
f) RV: rotavirus oral vaccine.
g) PCV: pneumococcal conjugate vaccine; includes pneumococcal 10-valent conjugate vaccine (P10) and pneumococcal 13-valent conjugate vaccine (P13). h) MenC: meningococcal C conjugate vaccine.
i) YF: yellow fever vaccine.
j) MMR: measles, mumps and rubella vaccine, (includes measles, mumps, rubella and varicella vaccine [MMRV]).
Note: The lines are decreasing due to the occurrence of events (not receiving the recommended vaccine doses according to the time interval indicated).
Figure 2 – Proportion of children timely vaccinated, according to the recommended doses over time, among live births (N=2,612), Araraquara, São Paulo, 2012
1.0
0.8
0.6
0.4
0.2
0.0
Pr
opor
tion of v
accina
ted childr
en
BCGa
HBb1
DTPc 1
Poliod 1
Hibe 1
RVf 1
HBb 2
PCVg 1
MenCh 1
DTPc 2
Poliod 2
Hibe 2
RVf 2
PCVg 2
MenCh 2
DTPc 3
Poliod 3
Hibe 3
HBb 3 PCVg 3
YFi
MMRj 1
MenCh 3
DTPc 4
Poliod 4
PCg 4
The limitations of this study are related to the use of secondary data. The exclusion of children who moved from the municipality may have overestimated or underestimated the results; however, as this percentage was small, it is possible that it has not affected – at least significantly – the results. The fact that not all vaccine doses were filled into EIR may have led to an underestimate of vaccine coverage. However, the fact that we considered different vaccine schedules for calculating the vaccination coverage and vaccination opportunities regarding Polio, DTP, HB, PCV, MMR/MMRV and Hib collaborated to improve data quality. It is important to highlight that in Araraquara, there is a routine of search for children in the civil registry and SIM in order to verify if they are registered at Juarez System.
The high coverage of children registered at EIR and the low duplication of records reinforce their
usefulness regarding monitoring and control of the vaccines administered. Moreover, EIR proved to be very useful for research, allowing a good use of information recorded in it.
In the study period, BCG, RV, PCV, Polio, HB, Hib and DTP vaccines administered at the age of 12 months old presented vaccine coverage for doses received over 95%. Nevertheless, we should highlight the importance of opportunity for the recommended vaccines, which was lower than 90% for most of them. It is also important to remember that the MMR/MMRV and MenC vaccines changed in the vaccination schedule of 2013, a measure that may have influenced the vaccination schedule. Another vaccine that deserves attention is PCV: the booster dose, which should be administered at the age of 15 months old, caused a decrease in its coverage at 24 months old. The variety
Pr
opor
tion of v
accina
ted childr
en DTP1
Pr
opor
tion of v
accina
ted childr
en DTP3
Pr
opor
tion of v
accina
ted childr
en DTP2
Pr
opor
tion of v
accina
ted childr
en DTP4
1.0
0.8
0.6
0.4
0.2
0.0
1.0
0.8
0.6
0.4
0.2
0.0
1.0
0.8
0.6
0.4
0.2
0.0 1.0
0.8
0.6
0.4
0.2
0.0
Days Days
Days Days
0 100 200 300 400 500 0 100 200 300 400 500 600
0 100 200 300 500 0 200 400 600 800 1.000 1.200
Note:
Kaplan-Meier inverse curves [1-s(t)].
The areas among the continuous vertical lines indicate the recommended period to vaccination. The dashed lines mark the medians of the vaccination days of the studied children.
of vaccine schedules found for Polio, DTP, HB, PCV, MMR/MMRV and Hib vaccines shows the complexity of analyzing coverage data in face of these differences, especially concerning public and private vaccination networks. Moreover, over the years, the vaccination schedule became increasingly complex after vaccines such as PCV, MenC and RV were included.
Similarly to Araraquara, a vaccination coverage research, regarding the age of 18 months old, took place in 2007-2008 in Salvador, capital of Bahia State,24 and
identified greater coverage of BCG, DTP and Polio; and lower MMR coverage. In other capitals of the Brazilian Northeast region, concerning the same period of 2007-2008,25 lower vaccination coverage was found at the
age of 12 months for BCG, DTP, Hib, HB and Polio, and higher coverage for MMR, when compared to Araraquara.
A study carried out in 2004, also based on EIR from Curitiba, capital of Paraná State,³ on vaccine coverage per doses received at 12 and 24 months old presented similarities to what was found in Araraquara; the exception was the MMR vaccine, which presented lower coverage in Araraquara. The authors suggest that the link to health services was an important factor for these results. As in the present study, the proportion of children registered at the EIR of Curitiba was quite high; however, the percentage of duplicate cases was higher than what was found in Araraquara.
Vaccine coverage according to doses received and doses timely administered are different ways of assessing vaccination schedule; the latter allows visualizing a decrease or increase in vaccination over time. Kaplan-Meier curve proved to be very useful for monitoring the vaccine schedule in its different stages, that is, for every dose(s) included. The graphic presentation provides quick and comprehensive overview of the complex issue of vaccination in a population over time. Estimating the proportion of children vaccinated at any time – and vice versa – enables two measures: (i) the investigation of age when the goal of vaccine coverage for a given disease is achieved in a population; and (ii) checking whether the recommended vaccination schedule is being well implemented, by observing the median of vaccination age of the population.20
Except for the BCG and RV, vaccine coverage by timely administered doses was below 90% for the vaccines analyzed. In São Luís, capital of Maranhão State,26 a
household survey conducted in 2006 involving 427 children identified fewer vaccine opportunities at 12 months old for BCG, HB, DTP, and Polio, compared to
the results of Araraquara. In El Salvador,9 a household
survey carried out in 2011, involving 2,550 children, revealed percentages of vaccination opportunity similar to those found in Araraquara, except for BCG and RV, which were better in Araraquara. In Buenos Aires, Argentina,8 a 2002 population-based survey regarding
1,391 children showed lower percentages of DTP, HB, and MMR vaccines. In the USA,27 a sample of 11,710
children of the 2012 national survey revealed greater opportunity for MMR vaccine than in Araraquara, but all the other vaccines presented lower percentages.
A study conducted in three municipalities of South Africa,28 from 2006 to 2008, involving 1,137 children
from zero to 24 months old, identified lower percentages of timely vaccine coverage for the 1st and 2nd doses of
DTP, and higher percentage for the 3rd dose of this
vaccine. In El Salvador,9 the vaccination opportunities
of the three doses of DTP and its booster were lower than in Araraquara.
Still regarding opportunity, in this study, DTP vaccination coverage in the first two doses reached 90% within the recommended period, different from Germany, according to a national survey involving 782 children in the year 1999.20 There is evidence in the literature that delayed
vaccination is clinically important because the child may be exposed to complications from these diseases.29
In conclusion, vaccine coverage in the municipality of Araraquara is heterogeneous and experiences delays. Thus, it is relevant to intensify actions aimed at timely vaccination, especially MMRV and PCV (booster). The results of this study may have implications for vaccination programs in Brazilian municipalities with similar characteristics to those of Araraquara, who have implemented – or are implementing – the electronic immunization registry – EIR.
Authors' Contributions
1. Teixeira AMS, Domingues CMAS. Monitoramento rápido de coberturas vacinais pós-campanhas de vacinação no Brasil: 2008, 2011 e 2012. Epidemiol Serv Saude, 2013 out-dez;22(4):565-78.
2. Ministério da Saúde (BR). Informações de saúde [Internet]. Brasília: Departamento de Informática do SUS (Datasus); 2013 [citado 2015 dez 20]. Disponível em: http://www2.datasus.gov.br/DATASUS/ index.php?area=02
3. Luhm KR, Cardoso MRA, Waldman EA. Cobertura vacinal em menores de dois anos a partir de registro informatizado de imunização em Curitiba, PR. Rev Saúde Pública. 2011 fev;45(1):90-98.
4. Barata RB, Ribeiro MC, de Moraes JC, Flannery B. Socioeconomic inequalities and vaccination coverage: results of an immunisation coverage survey in 27 Brazilian capitals, 2007-2008. J Epidemiol Community Health. 2012 Oct; 66(10):934-41.
5. Domingues CMAS, Teixeira AMS. Coberturas vacinais e doenças imunopreveníveis no Brasil no período 1982-2012: avanços e desafios do Programa Nacional de Imunizações. Epidemiol Serv Saude. 2013 jan-mar;22(1):9-27.
6. Mota E. Inquérito domiciliar e cobertura vacinal: a perspectiva do estudo das desigualdades sociais no acesso à imunização básica infantil. Rev Bras Epidemiol. 2008 maio;11(Supl 1):125-8.
7. Sato APS. Programa Nacional de Imunização: sistema informatizado como opção a novos desafios. Rev Saúde Pública. 2015;49:39.
8. Dayan GH, Shaw KM, Baughman AL, Orellana LC, Forlenza R, Ellis A, et al. Assessment of delay in age-appropriate vaccination using survival analysis. Am J Epidemiol. 2006 Mar;163(6):561-70.
9. Suárez-Castaneda E, Pezzoli L, Elas M, Baltrons R, Crespin-Elías EO, Pleitez OAR, et al. Routine childhood vaccination programme coverage, El Salvador, 2011—In search of timeliness. Vaccine. 2014 Jan;32(4):437-44.
10. Barros MGM, Santos MCS, Bertolini RPT, Netto VBP, Andrade MS. Perda de oportunidade de vacinação: aspectos relacionados à atuação da atenção primária em Recife, Pernambuco, 2012. Epidemiol Serv Saúde. 2015 out-dez;24(4):701-10.
11. Instituto Brasileiro de Geografia e Estatística. Cidades@: São Paulo, Araraquara [Internet]. Rio de Janeiro: Instituto Brasileiro de Geografia e Estatística; 2011 [citado 2015 jul 17]. Disponível em: http://www.ibge.gov.br/cidadesat/xtras/perfil. php?codmun=350320
12. Atlas do Desenvolvimento Humano no Brasil. Araraquara, SP [Internet]. Brasília: Programa das Nações Unidas para o Desenvolvimento (PNUD); 2010 [citado 2015 ago 19]. Disponível em: http://www.atlasbrasil.org.br/2013/pt/perfil_m/ araraquara_sp
13. Sato APS, Ferreira VLR, Tauil MC, Rodrigues LC, Barros MB, Martineli E, et al. Uso de registro informatizado de imunização na vigilância de eventos adversos pós-vacina. Rev Saúde Pública. No prelo 2017.
14. Pedraza DF. Qualidade do Sistema de Informações sobre Nascidos Vivos (Sinasc): análise crítica da literatura. Ciênc Saúde Coletiva. 2012 out;17(10):2729-37.
15. Oliveira MM, Andrade SSCA, Dimech GS, Oliveira JCG, Malta DC, Rabello Neto DL, et al. Avaliação do Sistema de Informações sobre Nascidos Vivos. Brasil, 2006 a 2010. Epidemiol Serv Saúde. 2015 out-dez;24(4):629-40.
16. Waldvogel BC, Ferreira CEC, Camargo ABM, Jordani MS, Ortiz LP. Base unificada de nascimentos e óbitos no estado de São Paulo: instrumento para aprimorar os indicadores de saúde. São Paulo Perspec. 2008 jan-jun;22(1):5-18.
17. Secretaria de Estado da Saúde de São Paulo. Coordenadoria de Controle de Doenças. Centro de Vigilância Epidemiológica ‘Prof. Alexandre Vranjac’. Informe técnico. Campanha nacional de atualização de cadernetas de vacinação em crianças menores de 5 anos [Internet]. São Paulo: Secretaria de Estado da Saúde de São Paulo; 2012 [citado 2017 jan 17]. 7p. Disponível em: http://www.saude.sp.gov.br/resources/ ccd/publicacoes/documentos-tecnicos-internacionais/ novo/informe_campanha_nac_atualizacao_
cadernetas.pdf
18. Ministério da Saúde (BR). Secretaria de Vigilância em Saúde. Departamento de Vigilância das Doenças Transmissíveis. Manual de normas e procedimentos para vacinação [Internet]. Brasília: Ministério da Saúde; 2014 [citado 2017 jan 17]. 176 p. Disponível
em: http://www.saude.pr.gov.br/arquivos/File/-01VACINA/manual_procedimentos_2014.pdf
19. Centers for Disease Control and Prevention. General recommendations on immunization: recommendations of the advisory committee on immunization practices (ACIP). MMWR. 2011 Jan;60(2):1-64.
20. Laubereau B, Hermann M, Schmitt HJ, Weil J, von Kries R. Detection of delayed vaccinations: a new approach to visualize vaccine uptake. Epidemiol Infect. 2002 Apr;128:185-92.
21. Babirye JN, Engebretsen IM, Makumbi F, Fadnes LT, Wamani H, Tylleskar T, et al. Timeliness of childhood vaccinations in Kampala Uganda: a community based cross-sectional study. PLoS ONE. 2012 Apr;7(4):e35432. 22. World Health Organization. Immunization
surveillance, assessment and monitoring: vaccine preventable diseases, 2014 data [internet]. Geneva; 2014 [cited 2015 Mar 20]. Available in: http://www. who.int/topics/immunization/en/
23. Temporão JG. O Programa Nacional de Imunizações (PNI): origens e desenvolvimento. Hist Cienc Saude Manguinhos. 2003;10 Suppl 2:601-17.
24. Barata RB, Pereira SM. Desigualdades sociais e cobertura vacinal na cidade de Salvador, Bahia. Rev Bras Epidemiol. 2013 jun;16(2):266-77.
25. Queiroz LLC, Monteiro SG, Mochel EG, Veras MASM, Sousa FGM, Bezerra MLM, et al. Cobertura vacinal do esquema básico para o primeiro ano de vida nas capitais do Nordeste brasileiro. Cad Saúde Pública. 2013 fev;29(2):294-302.
26. Yokokura AVCP, Silva AAM, Bernardes ACF, Lamy Filho F, Alves MTSSB, Cabra NAL, et al. Cobertura vacinal e fatores associados ao esquema vacinal básico incompleto aos 12 meses de idade, São Luís, Maranhão, Brasil, 2006. Cad Saúde Pública. 2013 mar;29(3):522-34.
27. Kurosky SK, Davis KL, Krishnarajah G. Completion and compliance of childhood vaccinations in the United States. Vaccine. 2016 Jan; 34(3):387-94.
28. Fadnes LT, Jackson D, Engebretsen IMS, Zembe W, Sanders D, Sommerfelt H, et al. Vaccination coverage and timeliness in three South African areas: a prospective study. BMC Public Health. 2011 May;11:404.
29. Straney L, Schibler A, Ganeshalingham A, Alexander J, Festa M, Slater A, et al. Burden and outcomes of severe pertussis infection in critically Ill infants. Pediatr Crit Care Med. 2016 Aug;17(8):735-42.
Received on 30/03/2017