FREE THEMES
1 Faculdade de Saúde Pública, Universidade de São Paulo. Av. Dr. Arnaldo 715, Cerqueira César. 01246-904 São Paulo SP Brasil. [email protected] 2 Secretaria Estadual de Saúde de Mato Grosso. Cuiabá MT Brasil. 3 Instituto de Saúde Coletiva Universidade Federal de Mato Grosso (UFMT). Cuiabá MT Brasil. 4 Faculdade de Economia, UFMT. Cuiabá MT Brasil.
Population-based study on infant mortality
Abstract Although Brazil has reduced social, economic and health indicators disparities in the last decade, intra- and inter-regional differences in child mortality rates (CMR) persist in regions such as the state capital of Mato Grosso. This pop-ulation-based study aimed to investigate factors associated with child mortality in five cohorts of live births (LB) of mothers living in Cuiabá (MT), Brazil, 2006-2010, through probabilistic linkage in 47,018 LB. We used hierarchical logis-tic regression analysis. Of the 617 child deaths, 48% occurred in the early neonatal period. CMR ranged from 14.6 to 12.0 deaths per thousand LB. The following remained independently associated with death: mothers without companion (OR = 1.32); low number of prenatal consultations (OR = 1.65); low birthweight (OR = 4.83); prematu-rity (OR = 3.05); Apgar ≤ 7 at the first minute (OR = 3.19); Apgar ≤ 7 at the fifth minute (OR = 4.95); congenital malformations (OR = 14.91) and male gender (OR = 1.26). CMR has declined in Cuiabá, however, there is need to guide public healthcare policies in the prenatal and perinatal period to reduce early neonatal mortality and fur-ther studies to identify the causes of preventable deaths.
Key words Child mortality, Information systems, Risk factors, Vital statistics
Jaqueline Costa Lima 1
Alexandre Marchezoni Mingarelli 2
Neuber José Segri3
Arturo Alejandro Zavala Zavala4
Lima JC
Introduction
One of the goals proposed in the Millennium Development Goals (MDGs) in mother and child health was to reduce child mortality rate (CMR) to below 15.7 deaths per thousand live births (LB) by 20151. Brazil achieved this mark in
2011, achieving a rate of 15.31,2.
Among the emerging countries of the BRICS (Brazil, Russia, India, China and South Africa), Brazil was the best performer in reducing child mortality between 1990 and 2010, followed by
China3. However, compared to the other South
American countries, Brazil has higher rates than Ecuador, Colombia, Argentina, Uruguay and Chile, with the latter two showing rates below 10/1,000 LB in 20131.
While Brazil has reduced social, economic and health indicators disparities in the last de-cade4,5, intra- and interregional differences in
child mortality rates persist5. In 2010, the North
had rates ranging from 11.0 to 21.8 deaths/1,000 LB; in the Northeast, rates ranged between 11.9 and 17.8 deaths/1,000 LB; in the Southeast and South, rates had a lower variation, ranging be-tween 9.1 and 13.2 deaths/1,000 LB. In turn, Midwest capitals have very similar rates, varying from 12.6 to 13.2 deaths/1,000 LB2.
Midwest capitals emerge among those that showed the greatest drop in child mortality rates in the last two decades, following the significant improvement of social and economic indicators in this period6. However, child mortality has been
little studied in this region7,8.
The method such as linkage with the Live Births Information System (SINASC) and the Mortality Information System (SIM) has been widely used for studies of factors associated with child mortality7,9. Some of these factors are well
known, such as low mother schooling, low num-ber of prenatal consultations, mother’s age, pre-maturity and low birthweight4,5,9-13.
Linkage enables the identification of individ-uals or records that are part of two or more dis-tinct databases14. This feature has the
advantag-es of low operational cost, speed and feasibility, using data already recorded by health services7,14.
Despite this facility, only one child mortality study was conducted in capital Cuiabá using this method7.
Cuiabá has good SINASC and SIM coverage (over 90%)15 and good variables completeness of
both systems16,17, essential for the linkage. Due to
research gaps in the Midwest, we developed this study aiming at investigating factors associated
with child mortality in the LB cohorts of mothers residing in Cuiabá from 2006 to 2010.
Methodology
This is a retrospective population-based cohort study. The study population consisted of cohorts of born between January 1, 2006 and December 31, 2010, children of mothers living in the city of Cuiabá (MT), totaling 47,018 LB. The area of in-terest was capital Cuiabá (MT), with a population of 550,000 inhabitants in the last census, with a Human Development Index (HDI) of 0.785, Gini Index of 0.59, fertility rate of 1.79 children per woman in fertile age, and average per capita in-come of 1,161.49 Brazilian reais in 20106.
Included in the study were live births with a duly completed Live Birth Certificate (LBC), and child deaths not matched by the linkage method, without date of birth and the mother’s name and not found after manual search were excluded.
Children included in the study were selected from the SINASC database and deaths were iden-tified in the SIM database. Probabilistic linkage was performed after standardizing the two data-bases (capitalization, no semicolons), establish-ing a sestablish-ingle database. The Registry Plus™ Link Plus, version 3.0 beta software (Centers for Dis-ease Control and Prevention, CDC, http://www. cdc.gov) was used for linkage.
With regard to linkage, a blocking strategy for variable gender and matching in which pairs were made (a SINASC record with a SIM record) was used: the mother’s name and the date of birth18. The established cutoff point was six to
find the largest possible number of pairs18. In case
of divergence of data between the Death Certif-icate (DC) and Live Birth CertifCertif-icate (LBC), the information contained in the LBC was consid-ered a golden standard because it was of good quality and with a low percentage of information ignored7. Non-electronically related deaths were
processed manually by examining SINASC and the original LBC records.
Data source of this research was the Birth and Death Surveillance Management of the Municipal Health Secretariat of Cuiabá (MT) and the State Health Secretariat of Mato Gros-so. Univariate analyzes and logistic regression were processed in Stata, version 13.0.
aúd e C ole tiv a, 22(3):931-939, 2017
calculation method for child mortality compo-nents considered the early neonatal periods – deaths from 0 to 6 days of life; late neonatal – 7 to 27 days of life and postneonatal – deaths from 28 to 364 days of life as numerator and LB as de-nominator, multiplied by one thousand.
The dependent variable was the probability of death in the first year of life, whereas the inde-pendent variables were the potential factors asso-ciated with death, divided into determinants for the investigation of the factors associated with child mortality.
Gross odds ratios (OR) were estimated and adjusted with the respective 95% confidence intervals, using hierarchical multiple logistic re-gression19. The Hosmer-Lemeshow test was used
to verify significance of the final model.
For the analysis of the hierarchical model, we took as distal determinants the socioeconomic variables: mother marital status and schooling – in years of study. The variables of intermedi-ate determinants (care-relintermedi-ated) were number of prenatal consultations, location of birth, hospital type, and type of delivery. Proximate determi-nants were mother biological variable (age) and child biological variables: pregnancy type, gesta-tional age in weeks, birthweight in grams, gender, race/skin color, Apgar index at the first and fifth minute and congenital malformation.
The hierarchical statistical analysis is based on a conceptual model that describes the relation-ship between risk factors19. In this study, the
hier-archical analysis followed the distal-proximate di-rection, using as a starting point block 1variables, which join block 2 variables and, finally, block 3 variables, thus forming the final hierarchical model. Within each block, variables with a value of p <0.20 in the univariate analysis were includ-ed in the assembly of the respective block model, using the stepwise forward procedure. Variables with a value of p<0.05 and those with biological plausibility remained within each block.
This study was approved by the Research Eth-ics Committee of the Júlio Müller University Hos-pital, of the Federal University of Mato Grosso.
Results
Of the initial total of 698 deaths related to the five birth cohorts (2006 to 2010), two deaths (0.3%) were excluded because they did not bear the mother’s name nor the date of birth. After linkage between SINASC (47,018 LB) and SIM (696 deaths), 607 deaths were paired (87%), with
597 (98%) true pairs and 13 (2%) non-true pairs. After exclusion of the 13 non-true pairs and in-clusion of the 23 true pairs resulting from the manual search, the final casuistry was 617 deaths (Figure 1).
The average CMR for the five-year period was 13.1 deaths/1,000 LB, and most deaths occurred in the neonatal period n = 414 (67.1%), especial-ly in the earespecial-ly neonatal period, 48.1% (n = 297). CMR increased from 11.4 deaths/1,000 LB in 2006 to 14.6 in 2008, followed by a decline to 12.0 deaths/1,000 LB in 2010. In the period un-der study, the main component responsible for child mortality was neonatal (Table 1).
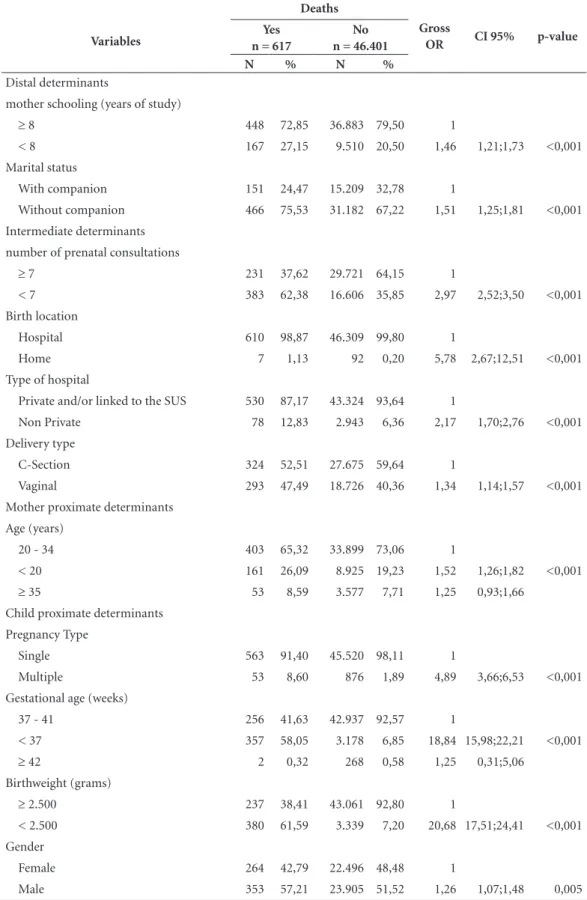
Of live births, 6.85% (3,178 / 46,401) were born preterm, 7.20% (3,339 / 46,401) with low birthweight, 51.52% (23,905 / 46,401) were male, 35.85% (16,606 / 46,401) were of mothers who had less than seven prenatal consultations, 59.64% (27,675 / 46,401) were born by cesare-an section cesare-and 67.22% (31,182 / 46,401) were of mothers without companion.
Of the newborns who died, 58.05% (357/617) were born preterm, 61.59% (380/617) with low birthweight, 57.21% (353/617) were males, 62.38% (383/617) were of mothers who had less than seven prenatal consultations, 52.51% (324/617) of deaths were of cesarean section and 75.53% (466/617) were of mothers without com-panion. In the univariate analysis, all variables analyzed were associated with death (Table 2).
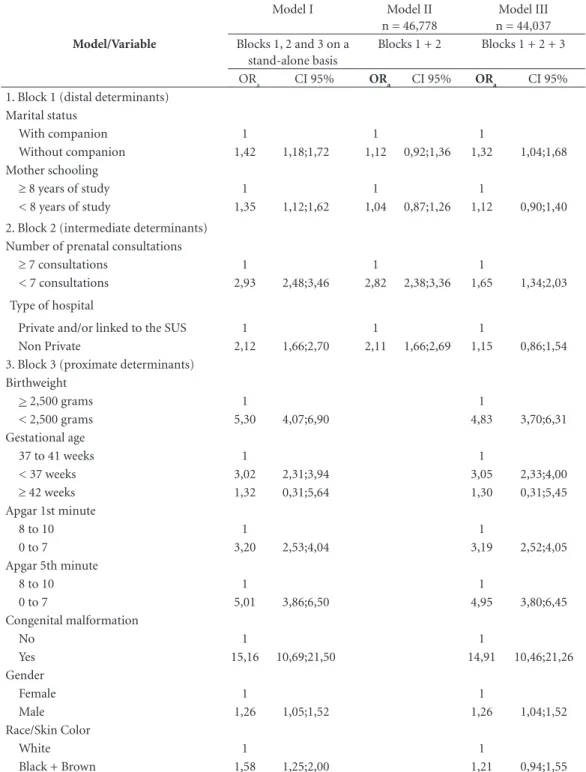
Table 3 shows the result of the model applied for each block in the first column. In the second column, we observe the intermediate model, composing block 1 (distal determinants) with block 2 (intermediate determinants). The third column shows the final model, by adding to the two previous blocks to block 3 (proximate deter-minants). Since it is hierarchical, results can be read horizontally (a given variable along the ad-justment) and diagonally (adjustment between blocks), as indicated in bold in Table 3.
Lima JC
model. The race / skin color black + brown was associated in isolation, but lost significance after adjusting the model.
The marital status of mother without com-panion (OR = 1.32, CI95% = 1.04;1.68) and low number of prenatal consultations (OR = 1.65, CI95% = 1.34;2.03) of the distal and intermedi-ate determinants, respectively, remained inde-pendently associated with child deaths. Variables
of the biological determinants were the most strongly associated with the outcome, with OR = 4.83 (CI95% = 3.70;6.31) for low birthweight, OR = 3.05 (CI95% = 2.33;4.00) for prematurity, OR = 3.19 CI95% = 2.52;4.05) for anoxia in the first minute, OR = 4.95 (CI95% = 3.80;6.45), for anoxia in the fifth minute, OR = 14.91 (CI95% = 10.46; 21.26) for congenital malformation and (OR = 1.26 CI95% = 1.04;1.52) for male gender (Table 3).
Figure 1. Linkage between the Live Births Information Systems (SINASC) and Mortality Information System
(SIM), 2006-2010.
{
{
13 excluded Not true pairs
594 True pairs
617 True pairs 607 Pairs
SIM 698 deaths
Linkage
Sinasc 47.018 LB
records not matched through linkage
SIM 696 deaths
Excluded 2 date of birth and mother´s namenot available
MANUAL SEARCH
•23 LBC found through
manual search
•30 LBC from other municipalities
•33 LBC not found
•3 fetal deaths (coding errors)
Deaths 2006 2007 2008 2009 2010 Total
Neonatal period (n) 74 87 86 90 77 414
Early neonatal period (n) 58 66 63 55 55 297
Late neonatal period (n) 16 21 23 35 22 117
Postneonatal period (n) 34 35 54 45 35 203
First year of life (n) 108 122 140 135 112 617 Number of live births (LB) 9.443 9.284 9.601 9.351 9.339 47.018
NCMR 7,8 9,4 9,0 9,6 8,2 8,8
ENCMR 6,1 7,1 6,6 5,9 5,9 6,3
LNCMR 1,7 2,3 2,4 3,7 2,4 2,5
PNCMR 3,6 3,8 5,6 4,8 3,7 4,3
CMR 11,4 13,1 14,6 14,4 12,0 13,1
Captions: NCMR = Neonatal Child Mortality Rate; ENCMR = Early Neonatal Child Mortality Rate; LNCMR = Late Neonatal Child Mortality Rate; PNCMR = Postneonatal Child Mortality Rate; CMR: Child Mortality Rate.
aúd
e C
ole
tiv
a,
22(3):931-939,
2017
Table 2. Univariate analysis of variables associated with child death by determinants (distal, intermediate and
proximate), municipality of Cuiabá, 2006-2010.
Variables
Deaths
Gross
OR CI 95% p-value
Yes n = 617
No n = 46.401
N % N %
Distal determinants
mother schooling (years of study)
≥ 8 448 72,85 36.883 79,50 1
< 8 167 27,15 9.510 20,50 1,46 1,21;1,73 <0,001 Marital status
With companion 151 24,47 15.209 32,78 1
Without companion 466 75,53 31.182 67,22 1,51 1,25;1,81 <0,001 Intermediate determinants
number of prenatal consultations
≥ 7 231 37,62 29.721 64,15 1
< 7 383 62,38 16.606 35,85 2,97 2,52;3,50 <0,001 Birth location
Hospital 610 98,87 46.309 99,80 1
Home 7 1,13 92 0,20 5,78 2,67;12,51 <0,001
Type of hospital
Private and/or linked to the SUS 530 87,17 43.324 93,64 1
Non Private 78 12,83 2.943 6,36 2,17 1,70;2,76 <0,001 Delivery type
C-Section 324 52,51 27.675 59,64 1
Vaginal 293 47,49 18.726 40,36 1,34 1,14;1,57 <0,001 Mother proximate determinants
Age (years)
20 - 34 403 65,32 33.899 73,06 1
< 20 161 26,09 8.925 19,23 1,52 1,26;1,82 <0,001
≥ 35 53 8,59 3.577 7,71 1,25 0,93;1,66
Child proximate determinants Pregnancy Type
Single 563 91,40 45.520 98,11 1
Multiple 53 8,60 876 1,89 4,89 3,66;6,53 <0,001 Gestational age (weeks)
37 - 41 256 41,63 42.937 92,57 1
< 37 357 58,05 3.178 6,85 18,84 15,98;22,21 <0,001
≥ 42 2 0,32 268 0,58 1,25 0,31;5,06
Birthweight (grams)
≥ 2.500 237 38,41 43.061 92,80 1
< 2.500 380 61,59 3.339 7,20 20,68 17,51;24,41 <0,001 Gender
Female 264 42,79 22.496 48,48 1
Male 353 57,21 23.905 51,52 1,26 1,07;1,48 0,005
Lima JC
Discussion
The linkage was useful in the identification of live births that resulted into death in order to deter-mine the factors associated with infant mortali-ty, was operationally feasible and had a low cost (free software). Its use is a stimulus to work with secondary data, and it is possible to incorporate it into the routine of municipal health services7,9.
There was variation of CMR in Cuiabá in the period studied. From 2006 to 2008, it increased, declining again in 2009 and 2010. Caution should be used when interpreting such results, since they do not necessarily mean that CMR has increased, but rather that there has been an improvement in the information systems over the years.
Between 2006 and 2010, CMR in Cuiabá stood below average for the Midwest and Brazil, ranging from 17.7 to 15.9 deaths per 1,000 LB and 19.4 to 16.2 deaths per 1,000 LB, respective-ly11. However, findings of this study are similar to
those published in other Brazilian regions and in other countries1-9,20.
This development was a reflection of public policies such as the Bolsa Alimentação21 (food
grant) and the Bolsa Família (family grant) Pro-gram22 adopted in recent decades that have had a
positive influence toward reducing child
mortal-ity, such as social policies, mainly in health, edu-cation and fight against poverty, making social, economic and health conditions indicators more favorable5,21,22.
Factors associated with child death in Cuiabá were marital status without companion, low number of prenatal consultations, low birth-weight, prematurity, Apgar ≤ 7 in the first min-ute, Apgar ≤ 7 in the fifth minute, congenital malformation and male gender. These factors corroborate those found by other authors5,7-9,11,20.
Attention is drawn to the prevalence of con-genital malformation that remained stable in the Midwest from 1990 to 2007, while decreas-ing in the South and Southeast and increasdecreas-ing the North and Northeast4. Mother’s exposure to
pesticides widely used in Mato Grosso was asso-ciated with the highest occurrence of congenital malformations in the state23. On the other hand,
congenital malformations were associated with death, a result consistent with that of another study8, again in the capital Cuiabá.
As of 2003 and 2004, low birthweight rates remained stable in all Brazilian regions, except in Midwest capitals, which increased by 0.87% per year24. Authors5 have argued that low birthweight
may be related to the increased prevalence of ce-sarean section. This may make sense for Cuiabá, Variables
Deaths
Gross
OR CI 95% p-value
Yes n = 617
No n = 46.401
N % N %
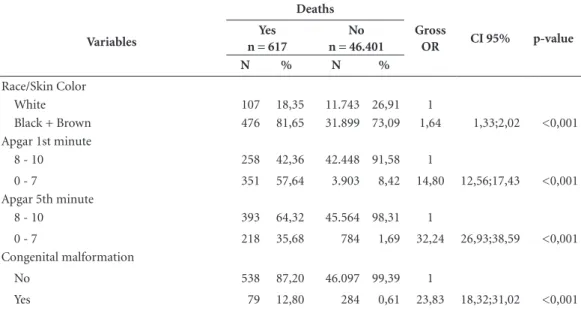
Race/Skin Color
White 107 18,35 11.743 26,91 1
Black + Brown 476 81,65 31.899 73,09 1,64 1,33;2,02 <0,001 Apgar 1st minute
8 - 10 258 42,36 42.448 91,58 1
0 - 7 351 57,64 3.903 8,42 14,80 12,56;17,43 <0,001 Apgar 5th minute
8 - 10 393 64,32 45.564 98,31 1
0 - 7 218 35,68 784 1,69 32,24 26,93;38,59 <0,001 Congenital malformation
No 538 87,20 46.097 99,39 1
Yes 79 12,80 284 0,61 23,83 18,32;31,02 <0,001
Note: Totals for some variables may vary because of blank values. OR = odds ratio; CI95% = 95% Confidence Interval.
aúd
e C
ole
tiv
a,
22(3):931-939,
2017
since the proportion of cesarean section among LBs in this study was approximately 60% and 52.5% among deaths.
The retrospective nature and the use of sec-ondary data are the main methodological lim-itations of this study; however, there was a low Model/Variable
Model I Model II n = 46,778
Model III n = 44,037 Blocks 1, 2 and 3 on a
stand-alone basis
Blocks 1 + 2 Blocks 1 + 2 + 3
ORa CI 95% ORa CI 95% ORa CI 95%
1. Block 1 (distal determinants) Marital status
With companion 1 1 1
Without companion 1,42 1,18;1,72 1,12 0,92;1,36 1,32 1,04;1,68 Mother schooling
≥ 8 years of study 1 1 1
< 8 years of study 1,35 1,12;1,62 1,04 0,87;1,26 1,12 0,90;1,40 2. Block 2 (intermediate determinants)
Number of prenatal consultations
≥ 7 consultations 1 1 1
< 7 consultations 2,93 2,48;3,46 2,82 2,38;3,36 1,65 1,34;2,03
Type of hospital
Private and/or linked to the SUS 1 1 1
Non Private 2,12 1,66;2,70 2,11 1,66;2,69 1,15 0,86;1,54 3. Block 3 (proximate determinants)
Birthweight
> 2,500 grams 1 1
< 2,500 grams 5,30 4,07;6,90 4,83 3,70;6,31 Gestational age
37 to 41 weeks 1 1
< 37 weeks 3,02 2,31;3,94 3,05 2,33;4,00
≥ 42 weeks 1,32 0,31;5,64 1,30 0,31;5,45
Apgar 1st minute
8 to 10 1 1
0 to 7 3,20 2,53;4,04 3,19 2,52;4,05
Apgar 5th minute
8 to 10 1 1
0 to 7 5,01 3,86;6,50 4,95 3,80;6,45
Congenital malformation
No 1 1
Yes 15,16 10,69;21,50 14,91 10,46;21,26
Gender
Female 1 1
Male 1,26 1,05;1,52 1,26 1,04;1,52
Race/Skin Color
White 1 1
Black + Brown 1,58 1,25;2,00 1,21 0,94;1,55
Obs.: Pearson’s (p = 0.96) and Hosmer-Lemeshow’s (p = 0.19) adjustment tests indicate a good fit of the model. ORa = adjusted odds ratio; CI95% = 95% Confidence Interval; SUS = Unified Health System.
Lima JC
percentage of losses due to underreporting and coding errors that prevented matching at the time of linkage.
There was a decrease in child mortality in Cuiabá, with the neonatal period accounting for 67.1% of child deaths. Factors associated with child death in the city show that efforts are needed to increase the number of prenatal consultations, trained staff for resuscitation in delivery rooms and that intensive neonatal units equipped to at-tend premature babies are required, since accord-ing to the World Health Organization (WHO)25,
up to 75% of newborn deaths can be avoided if effective health measures are taken at birth and during the first week of life. Due to the important participation of the early neonatal component in almost half of child deaths, new studies are need-ed to identify the preventable causes that result in deaths in this subgroup to guide local managers in the implementation of public policies.
Collaborations
aúd e C ole tiv a, 22(3):931-939, 2017 References
1. United Nations Children’s Fund. Committing to child survival: a promise renewed. Progress Report 2014. [acessado 2016 fev 4]. Disponível em: http://files.uni-cef.org/publications/files/APR_2014_web_15Sept14. pdf
2. Brasil. Ministério da Saúde (MS). Indicadores de mor-talidade. Dados de acesso público 2014. [acessado 2014 dez 11]. Disponível em: http://tabnet.datasus.gov.br/ cgi/idb2012/c01b.htm
3. Mújica OJ, Vázquez E, Duarte EC, Cortez-Escalante JJ, Molinab J, Barbosa da Silva Junior J. Socioeconomic inequalities and mortality trends in BRICS, 1990–2010.
BullWorld Health Organ 2014; 92(6):405-412. 4. Barros FC, Matijasevich A, Requejo JH, Giugliani E,
Maranhão AC, Monteiro CA, Barros AJ, Bustreo F, Me-rialdi M, Victora CG. Recent trends in maternal, new-born, and child health in Brazil: progress toward mil-lennium development goals 4 and 5. Am J Public Health
2010; 100(10):1877-1889.
5. Victora CG, Aquino EML, Leal MC, Monteiro CA, Barros FC, Szwarcwald CL. Saúde de mães e crian-ças no Brasil: progressos e desafios. Lancet 2011; 6736(11):60134-60138.
6. Instituto de Pesquisa Econômica e Aplicada (IPEA). Atlas do Desenvolvimento Humano 2013. [acesso em 20 fev 2015]. Disponível em: http://atlasbrasil.org. br/2013/pt/perfil/.
7. Morais CAM, Takano OA, Souza JSF. Mortalidade in-fantil em Cuiabá, Mato Grosso, Brasil, 2005: compara-ção entre o cálculo direto e após o linkage entre bancos de dados de nascidos vivos e óbitos infantis. Cad Saude Publica 2011; 27(2):287-294.
8. Gaiva MAM, Fujimori E, Sato APS. Neonatal mortality in infants with low birth weight. Rev Esc Enferm USP
2014; 48(5):778-785.
9. Santos HG, Andrade SM, Silva AMR, Carvalho WO, Mesas AE. Risk factors for infant mortality in a munic-ipality in southern Brazil: a comparison of two cohorts using hierarchical analysis. Cad Saude Publica 2012; 28(10):1915-1926.
10. Sovio U, Dibden A, Koupilc I. Social determinants of infant mortality in a historical Swedish cohort. Pediatr Perinat Epidemiol 2012; 26(5):408-420.
11. Brasil. Ministério da Saúde (MS). Secretaria de Vigi-lância em Saúde. Departamento de Análise de Situação de Saúde. Saúde Brasil 2011: uma análise da situação de saúde e a vigilância da saúde da mulher. Brasília: MS; 2012.
12. Almeida MF, Alencar GP, Schoeps D, Novaes HMD, Campbell O, Rodrigues LC. Sobrevida e fatores de risco para mortalidade neonatal em uma coorte de nascidos vivos de muito baixo peso ao nascer, na Região Sul do Município de São Paulo, Brasil. Cad Saude Publica
2011; 27(6):1088-1098.
13. Partridge S, Balayla J, Holcroft CA, Abenhaim HA. In-adequate prenatal care utilization and risks of infant mortality and poor birth outcome: a retrospective analysis of 28,729,765 U.S. deliveries over 8 years. Amer J Perinatol 2012; 29(10):787-794.
14. Almeida MF, Mello JMHP. O uso da técnica de “Linka-ge” de sistemas de informação em estudos de coorte sobre mortalidade neonatal. Rev Saude Publica 1996; 30(2):141-147.
15. Szwarcwald CL, Morais Neto OL, Frias PG, Souza Ju-nior PRB, Escalante JJC, Lima RB, Viola RC. Busca ati-va de óbitos e nascimentos no Nordeste e na Amazônia Legal: estimação das coberturas do SIM e do Sinasc nos municípios brasileiros. In: Brasil. Ministério da Saúde (MS). Saúde Brasil 2010: uma análise da situação de saúde e de evidências selecionadas de impacto de ações de vigilância em saúde. Brasília: MS; 2011. p. 79-98. 16. Brasil. Ministério da Saúde (MS) [Internet]. Sistema de
Informação sobre Nascidos Vivos (SINASC). Dados de acesso público 2014. [acessado 2015 dez 9]. Disponí-vel em: http://www2.aids.gov.br/cgi/tabcgi.exe?compl/ dnprinc.def
17. Brasil. Ministério da Saúde (MS) [Internet]. Sistema de Informação sobre Mortalidade (SIM). Dados de acesso público 2014. [acessado 2015 dez 9]. Disponível em: http://www2.aids.gov.br/cgi/deftohtm.exe?compl/ princ.def.
18. Brasil. Ministério da Saúde (MS). Secretaria de Vigilân-cia em Saúde. Departamento de Análise da Situação de Saúde. Link Plus – Guia simplificado do usuário. Texto original do user’s guide do Link Plus traduzido e modifi-cado pelo DASIS/SVS/MS. Brasília: MS; 2014. 19. Victora CG, Huttly SR, Fuchs SC, Olinto MT. The role
of conceptual frameworks in epidemiological anal-ysis: a hierarchical approach. Int J Epidemiol 1997; 26(1):224-227.
20. Balayla J, Azoulay L, Abenhaim HA. Maternal marital status and the risk of stillbirth and infant death: a pop-ulation-based cohort study on 40 million births in the United States. Womens Health Issues 2011; 21(5):361-365.
21. Lagarde M, Haines A, Palmer N. Conditional cash transfers for improving uptake of health interventions in low- and middle-income countries: a systematic re-view. JAMA 2007; 298(16):1900-1910.
22. Rasella D, Aquino R, Santos CAT, Paes-Sousa R, Barreto ML. Effect of a conditional cash transfer programme on childhood mortality: a nationwide analysis of Bra-zilian municipalities. Lancet 2013; 382(9886):57-64. 23. Oliveira NP, Moi GP, Atanaka-Santos M, Silva AMC,
Pignati WA. Malformações congênitas em municípios de grande utilização de agrotóxicos em Mato Grosso, Brasil. Cien Saude Colet 2014; 19(10):4123-4130. 24. Veloso HJF, Silva AAM, Barbieri MA, Goldani MZ
Lamy Filho F, Simões VMF, Batista RFL, Alves M T SSB, Bettiol H. Tendência secular da taxa de baixo peso ao nascer nas capitais brasileiras de 1996 a 2010. Cad Sau-de Publica 2013; 29(1):91-101.
25. World Health Organization (WHO). Newborns: re-ducing mortality. [Internet]. Jan 2016 [cited 2016 May 10]. Available from: http://www.who.int/mediacentre/ factsheets/fs333/en/
Article submitted 16/02/2016 Approved 20/06/2016