SUMMARY
Objective: To estimate the risk of hospitalization for asthma in children ater exposure to air pollutants in a medium-sized city in Southeast Brazil. Methods: An ecological time series study was carried out with hospitalization data for asthma in children under 10 years of age living in São José dos Campos, SP, Brazil, and concentrations of particulate matter with aerodynamic diameter < 10 microns, sulfur dioxide, and ozone; data were also obtained on relative humidity and temperatures. Pearson’s coeicient correlation was used for the study variables. To estimate the association between hospitalizations due to asthma and air pollutants, Poisson regression generalized additive models were built, according to lags of up to seven days. Results: here was a strong correlation be-tween hospitalizations and the pollutants particulate matter and sulfur dioxide. Expo-sure to particulate matter and sulfur dioxide were associated with signiicant relative risks of 1.01 to 1.04 of hospitalization due to asthma on the same day and within three days ater exposure. Increases in the concentrations of these pollutants increase the risk of hospitalization between 8% and 19%. Conclusion: here is evidence of the efect of air pollutants on asthma hospitalization in a medium-sized city in Southeast Brazil. Keywords: Asthma; air pollutants; particulate material; sulfur dioxide; children’s health; time series study.
©2012 Elsevier Editora Ltda. All rights reserved.
Study conducted at Department of Medicine, Universidade de
Taubaté (Unitau) Taubaté, SP, Brazil
Submitted on: 09/09/2011 Approved on: 02/10/2012
Financial Support: FAPESP grant # 2009/09487-4.
Correspondence to: Luiz Fernando Costa Nascimento
Avenida Tiradentes, 500 Taubaté – SP, Brazil CEP: 12030-180 [email protected]
Conlict of interest: None.
Asthma and air pollutants: a time series study
CAMILA TROLEZ AMÂNCIO1, LUIZ FERNANDO COSTA NASCIMENTO2INTRODUCTION
Air pollution is deined as the presence of foreign sub-stances in the air that afect the health and well-being of living beings1. his problem is likely to have adverse efects
on health, even when pollutant levels are within the stan-dards required by legislation.
he groups that are most susceptible to its adverse ef-fects are children and the elderly2,3. For children, the fact
is due to greater exposure to pollutants, increased minute ventilation, and higher levels of physical activity4. Among
the efects of chronic exposure to air pollution in children and adolescents, one can highlight stunted development and decreased lung function, as well as the increased num-ber of episodes of respiratory illness and hospitalizations5,6.
he air pollutants associated with outcomes such as chronic diseases in children and increases in the risk of death are mainly particulate matter (PM10), sulfur dioxide (SO2), and ozone (O3)7. In spite of evidence showing the
association between exposure to air pollutants and dam-age to health, the mechanisms by which they cause these diseases are yet to be elucidated, but it is believed that the histological lesions caused by pollutants in the lung paren-chyma may increase the harmful efects of viruses and/or allergens8.
Exposure to PM10 is associated with increased mor-bidity through diferent mechanisms of action, including local inlammation, injury by oxidative stress, and endo-thelial dysfunction9. SO
2 is a respiratory irritant that has
the capacity to deposit in the distal regions of the upper airways and lung parenchyma. Exposure to O3, in turn, is associated with a decrease in lung function, increased re-activity and inlammation of airways, and altered macro-phage function10.
It is believed that the adverse efects caused by expo-sure to environmental pollutants have a performance lag, i.e., an individual exposed to a pollutant on a given day may present with an acute asthma attack a few days later2.
Asthma, a chronic disease of genetic nature and en-vironmental component, very common among children, is the main cause for the prolonged impairment of their health in developed countries, and shows a high preva-lence in developing countries11,12. he disease is
charac-terized by resulting from bronchial inlammation, with an exaggerated response of the lower airways and limited airlow in these airways13. It is estimated that about 10%
of the world’s population and 20% of the population of Latin America have the disease14; approximately 24% of
Brazilian schoolchildren15, with predominance of the male
gender16. In addition to being a disease that poses a
pub-lic health problem, asthma has a high socioeconomic im-pact17. he inancial cost due to hospitalization for asthma
in children and adolescents is around R$ 6 million for the federal and state government18.
he present study aims to estimate the association be-tween exposure to the air pollutants PM10, SO2, and O3 and hospital admissions for asthma in children in São Jose dos Campos, state of São Paulo, Brazil.
METHODS
he study was carried out in São José dos Campos, a mid-size city in the countryside of the state of São Paulo, Brazil. It is located at coordinates 23 0 10’ S and 450 52’ W, 600
m above sea level; its climate is altitude tropical humid. It has an important industrial sector and is transected by the most important and busiest highway in Brazil. It had an estimated population of just over 600,000 inhabitants in 2009. It is located between São Paulo and Rio de Janeiro, the two largest Brazilian cities, and is transected by Via Dutra, a highway with intense traic19.
his is an ecological time series study, which assessed hospitalizations for asthma (ICD10: J45) in individuals aged zero to ten years living in the city of São José dos Campos, from January 1, 2004 to December 31, 2005. Data were obtained from the Department of Information and Informatics of the National Health System20. Data on levels
of the environmental pollutants PM10 and SO2 were also selected, in their daily means, and O3, in its daily eight-hour maximum levels, obtained from the Environmental Sanitation Technology Company, which has a measuring station in São José dos Campos21. PM
10 was measured
us-ing a beta monitor, SO2 was measured through the cou-lometry technique, and O3, by chemiluminescence; all were quantiied in μg/m3. he temperature and humidity
data were obtained from the Science, Space Technology and Applications Foundation22.
Since there can be a gap behavior for the efects of pol-lutants, i.e., hospitalization occurs not only on the same day (lag 0), but also on subsequent days (lag 1, lag 2...), a lag template was constructed of zero to seven days for each of the pollutants in the study.
To estimate the risk of asthma hospitalization due to exposure to pollutants, Poisson regression generalized ad-ditive model was used. For this reason, the air pollutants were always analyzed together in a multipollutant model, adjusted for humidity, minimum temperature, and con-trolled by day of week and seasonality. he computer pro-gram used for this analysis was Statistica.
RESULTS
During the study period, there were 841 hospital admis-sions for bronchial asthma in individuals aged 0-19 years living in São Jose dos Campos. he daily mean was 1.15 hospitalizations (SD = 1.26), ranging from zero to seven.
Variables Mean SD Minimum Maximum IQD
PM10 (μg/m3) 25.2 13.4 6.0 100.0 17.0
SO2 (μg/m3) 4.6 3.2 1.0 31.0 3.0
O3 (μg/m3) 74.3 32.4 9.0 232.0 41
Minimum temperature (°C) 15.4 2.7 7.4 20.5 4.0
Humidity (%) 79.6 6.8 54.0 99.3 19.3
SD, standard deviation; IQD, interquartile difference.
Table 1 – Descriptive analysis of atmospheric variables – São José dos Campos, SP, Brazil, 2004-2005
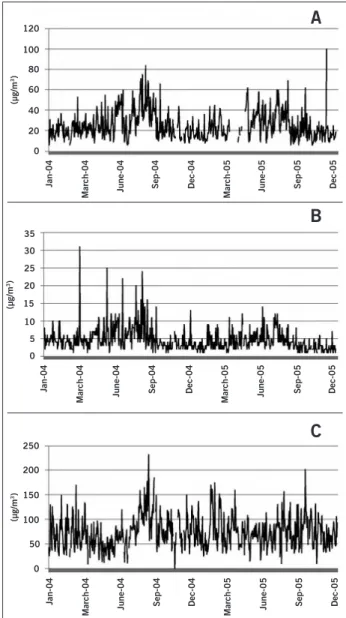
Figure 1 – Pollutants values (μg/m3), during the study period in São José dos Campos, SP, Brazil. (A) Particulate matter, (B) sulfur dioxide, (C) ozone.
a
Jan-04
March-04 June-04
Sep-04 Dec-04
March-05 June-05
Sep-05 Dec-05
(µg/m
3)
120
100
80
60
40
20
0
Jan-04
March-04 June-04
Sep-04 Dec-04
March-05 June-05
Sep-05 Dec-05
(µg/m
3)
35
25 30
20
15
10
5
0
Jan-04
March-04 June-04
Sep-04 Dec-04
March-05 June-05
Sep-05 Dec-05
(µg/m
3)
250
200
150
100
50
0
A
B
C
missing data regarding hospitalizations for asthma. hesemissing data did not afect the outcome of the study. Mean values with their standard deviations, minimum, and maximum values and interquartile diferences are shown in Table 1. Figure 1 shows that the PM10 and SO2 have a seasonal characteristic.
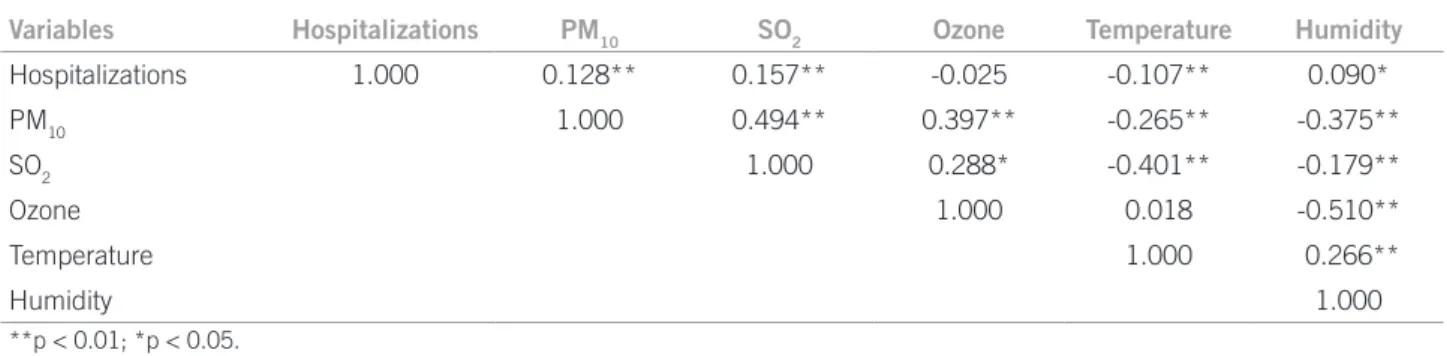
Table 2 presents the correlation matrix between vari-ables of the study. Hospital admissions for asthma showed a positive correlation with PM10 and SO2, and a negative correlation with O3. Among the pollutants, positive cor-relations were observed. he meteorological variables showed negative correlations with pollutants, except for ozone, which was positively correlated with temperature; as for hospitalization, there was a positive correlation with humidity and a negative correlation with temperature.
he months with the highest numbers of admissions were April, May, and June in both years of study, respec-tively, 54, 106, and 51 admissions in 2004 and 53, 52, and 54 in 2005.
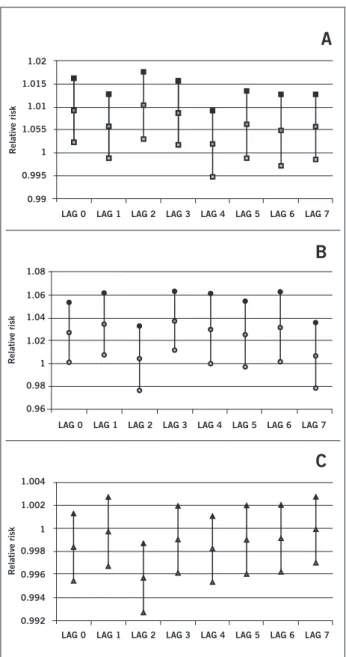
Based on Poisson regression, with the three pollutants analyzed together, adjusted for minimum temperature and humidity and controlled per day of week and seasonality, regression coeicients were obtained and the respective standard-errors for each pollutant in each lag structure (Table 3). he relative risks and their 95% conidence in-tervals are shown in Figure 2.
Noteworthy is the combination that occurs on the same, second, and third days of exposure to PM10 and on the irst, third, and sixth days ater exposure to SO2. he increase of 17 µg/m3 PM
10 results in an increase in the
rela-tive risk of 16% and 19%; an increase in the concentration of SO2 of 3 µg/m3 leads to an increase in the relative risk
between 8% and 14%.
DISCUSSION
here have been few studies on the efects of pollution as a cause of hospitalization due to asthma, and this is the irst to be conducted in a mid-sized city such as São José dos Campos.
PM10 was the pollutant most oten associated with hos-pitalizations for asthma, with statistical signiicance both on the same day of exposure and on the second and third days of exposure. In a study by Gouveia et al.23, conducted
in São Paulo, Brazil, it was observed that an increase of 10 µg/m3 in the levels of inhalable PM
10 is associated with an
Table 2 – Pearson’s correlation matrix between the meteorological variables – São José dos Campos, SP, Brazil, 2004-2005
Variables Hospitalizations PM10 SO2 Ozone Temperature Humidity
Hospitalizations 1.000 0.128** 0.157** -0.025 -0.107** 0.090*
PM10 1.000 0.494** 0.397** -0.265** -0.375**
SO2 1.000 0.288* -0.401** -0.179**
Ozone 1.000 0.018 -0.510**
Temperature 1.000 0.266**
Humidity 1.000
**p < 0.01; *p < 0.05.
Table 3 – Coeficients of regression and respective standard-errors for air pollutants in all days of the analyzed lag structure – São José dos Campos, SP, Brazil, 2004-2005
PM10 SO2 O3
Coeficient SE Coeficient SE Coeficient SE
Lag0 0.00922# 0.00349 0.02682# 0.01287 -0.00164 0.00148
Lag1 0.00573 0.00352 0.03354# 0.01336 -0.00028 0.00153
Lag2 0.01023# 0.00365 0.004488 0.01438 -0.00431 0.00153
Lag3 0.00864# 0.00352 0.03652# 0.01247 -0.00098 0.00149
Lag4 0.00198 0.00367 0.02963# 0.01512 -0.00181 0.00146
Lag5 0.00613 0.00371 0.02534 0.01416 -0.00101 0.00152
Lag6 0.00493 0.00394 0.03125# 0.01504 -0.00086 0.00149
Lag7 0.00564 0.00361 0.00678 0.01461 -0.00012 0.00146
SE, standard-error; #p < 0.05.
signiicant deleterious efects on health, leading to up 15% increase in mortality24.
he study by Gouveia et al.23 found a mean PM 10
dur-ing the study period of 54.49 µg/m3, a much higher level
than the one found in the present study, 24 µg/m3. he
same occurred with the study conducted in Curitiba2,
which showed a mean of 90.39 µg/m3 for PM
10. A possible
explanation for such diferences would be the highest con-centration of uncontrolled combustion in the cities of São Paulo and Curitiba, compared to São José dos Campos, as this is one reason for PM10 emission.
SO2 was the pollutant most oten associated with hos-pitalizations for asthma, presenting as a risk factor on the same day of exposure and ater the irst, third, and sixth days. A study that used Poisson regression analysis and was conducted in São Paulo, found a statistically signiicant positive association between asthma and this pollutant23.
Likewise, SO2 was also a risk factor, both when analyzed alone and when considered together with other pollutants on an average of four days, in the city of São Paulo25. he
mean concentrations found in this study are within the range considered acceptable by the WHO, which accepts a maximum level of exposure of 20 μg/m3 for 24 hours24.
In a study conducted in São Paulo, a mean SO2 of 17.71 μg/m3 was observed, which difers from the value
found in this study23. he same diference occurred when
it was compared with a study carried out in the city of Rio de Janeiro, which showed a mean value of 18.59 μg/m3 for
SO226. hese facts can be explained by higher emissions of
that pollutant in São Paulo and Rio de Janeiro, due to a larger vehicular leet, one of the main sources of that air pollutant.
As for O3, it was observed that this pollutant was not a statistically signiicant risk factor in any of the analyzed lag structures. he study by Bakonyi et al.2 showed a
statisti-cally signiicant efect for O3 only with a moving average of three days. his statistical diference may be due to the fact that their study variable were subjects aged 0-14 years of age treated for all respiratory causes, not just asthma, and also to the fact that they used moving averages and not lag structures, as in the present study.
he maximum daily concentration of this pollutant was 232 μg/m3, with a mean of 74.27 μg/m3 during 2004
and 2005. he manual of the WHO accepts a maximum level of exposure of 100 μg/m3 for 8 hours, for 1 day24.
Lev-els above 240 μg/m3 are associated with signiicant efects
on health, such as decreased lung function, airway inlam-mation, and hyperreactivity.
A mean of 71.79 μg/m3 of ozone was observed
Figure 2 – Relative risks and 95% conidence interval of each pollutant in each lag structure in São José dos Campos, SP, Brazil, 2004-2005. (A) Particulate matter, (B) sulfur dioxide, (C) ozone.
LAG 0
Relative risk
0.99 0.995 1 1.055 1.01 1.015 1.02
LAG 1 LAG 2 LAG 3 LAG 4 LAG 5 LAG 6 LAG 7
A
LAG 0
Relative risk
0.96 0.98 1 1.02 1.04 1.06 1.08
LAG 1 LAG 2 LAG 3 LAG 4 LAG 5 LAG 6 LAG 7
B
C
LAG 0 LAG 1 LAG 2 LAG 3 LAG 4 LAG 5 LAG 6 LAG 7
Relative risk
0.992 0.994 0.996 0.998 1 1.002 1.004
to the value found in this study23. In other studies, in the
cities of Curitiba and Rio de Janeiro, mean O3 values of 63.71 µg/m3 and 81.08 µg/m3, were observed, respectively,
and these are also relatively close to the levels in this study2,26.
In spite of the small magnitude of the RR found, the impact of air pollution on public health must be sub-stantial, taking into account the large number of exposed individuals. he results shown here represent a quantita-tive approximation of the impact of air pollution on the population’s health. It is important to emphasize that the outcome studied here, hospitalization, is just one of many efects caused by air pollution. Efects such as the occur-rence of symptoms, medication use, school absentee-ism, and reduced physical activity, among others, are not
evaluated in this study. hese, although considered to be minor efects to the individual’s health, are of great impor-tance to public health, given the high frequency at which they occur and due to their negative impact on quality of life and negative economic consequences, such as school and work absenteeism.
his study uses secondary data to calculate the coei-cients and relative risks for hospitalizations resulting from increased levels of air pollution. hese data come from very reliable and established sources27,28 and are widely
used in technical and scientiic studies. he fact that the records refer to hospitalizations in public hospitals, which belong to the Public Health System (SUS), is noteworthy. hus, the results shown here relect the efects of air pol-lution in the population that uses this type of healthcare service, which accounts for the majority of the population. On the other hand, information from the hospital in-formation system of SUS used in this study are produced with inancial goals and not strictly for epidemiological studies, and may thus have some degree of inaccuracy. hey may have underestimated the frequency of certain diseases, considering the technological proile of the ser-vice network, as well as diagnostic coding errors. Another problem in this database is the possibility of counting the same patient twice, as the system does not identify hos-pitalizations. However, in ecological time series studies of daily basis, factors whose distribution does not vary daily do not act as potential confounders27.
he quality of information on hospital admissions and other potential problems with this database does not vary from day to day and is not correlated with levels of air pollu-tion. herefore, its implications regarding the estimation of the observed efects are minimal. As for the concentrations of pollutants, O3 exceeded the acceptable value of 160 mg/m3
in 16 occasions, those of PM10 exceeded the value of 50 mg/m3 in 21 days, and SO
2 did not exceed the values
recommended by the National Council for the Environ-ment (Conselho Nacional do Meio Ambiente – Conama)29.
his study demonstrates that even populations of mid-sized cities may be afected by environmental pollution, resulting in an increasing incidence of hospitalizations for asthma and decreased quality of life of citizens.
CONCLUSION
he pollutants PM10 and SO2 were identiied as associated with hospitalization caused by asthma in a mid-sized city, and this information may be useful in the implementation of public health policies in the municipality.
REFERENCES
1. Elson DM. Atmospheric pollution: a global problem. 2nd ed. Oxford: Blackwell;
1992. p.3
3. Gouveia N, Mendonça GAS, Leon AP, Correia JEM, Junger WL, Freaitas CU, et al. Poluição do ar e efeitos na saúde nas populações de grandes metrópoles brasileiras. Epidemiol Serv Saúde. 2003;12:29- 40.
4. American Academy of Pediatrics. Committee on Environmental Health. Am-bient air pollution: health hazards to children. Pediatrics. 2004;114; 1699-707. 5. Brauer M, Hoek G, Smit HA, Jongste JC, Gerritsen J , Postma DS, et al. Air
pollution and development of asthma, allergy and infections in a birth cohort. Eur Respir J. 2007;29:879-88.
6. Gauderman WJ, Avol E, Gilliland F, Vora H, homas D, Berhane K, et al. he efect of air pollution on lung development from 10 to 18 years of age. 2004. N Engl J Med. 2004;351:1057-67.
7. Nascimento LFC, Pereira LAA, Braga ALF, Módolo MCC, Carvalho Jr JA. Efeitos da poluição atmosférica na saúde infantil em São José dos Campos, SP. Rev Saúde Pública. 2006;40:77-82
8. Hiltermann TJ, Stolk J, Van Der Zee SC, Brunekreef B, De Bruijne CR, Fisher PH, et al. Asthma severity and susceptibility to air pollution. Eur Respir J. 1998;11:686-93.
9. Pope CA, Dockery DW. Health efects of ine particulate air pollution: lines that connect. J Air Waste Manage Assoc. 2006;56:709-42.
10. Committee of the Environmental and Occupational Health Assembly of the American horacic Society. Health efects of outdoor air pollution. Am J Respir Crit Care Med. 1996;153:3-50
11. Mascarenhas MDM, Vieira LC, Lanzieri TM, Leal APPR, Duarte AF, Hatch DL. Anthropogenic air pollution and respiratory disease-related emer-gency room visits in Rio Branco, Brazil - September, 2005. J Bras Pneumol. 2008;34:42-6.
12. Prietsch SOM, Fischer GB, César JA, Cervo PV, Sangaletti LL, et al. Fatores de risco para sibilância recorrente em menores de 13 anos no Sul do Brasil. Rev Panam Salud Publica. 2006:20:331-7.
13. Brasil. Portal da Saúde. SUS. Asma grave. [cited 29 Jan 2012]. Available from: http://portal.saude.gov.br/saude/visualizar_texto.cfm?idtxt=23509. 14. Casagrande RRD, Pastorino AC, Souza RGL, Leone C, Solé C, Jacob CMA.
Presença de asma e fatores de risco em escolares da cidade de São Paulo. Rev Saúde Pública. 2008;42:517-23.
15. Solé D, Wandalsen GF, Camelo-Nunes IC, Naspitz CK; ISAAC - Grupo Brasileiro. Prevalence of symptoms of asthma, rhinitis, and atopic eczema among Brazilian children and adolescents identiied by the international study of asthma and allergies in childhood (ISAAC) - phase 3. J Pediatr (Rio J). 2006;82:341-6.
16. González Gómez JG, Barrera Gómez LE, ArévaloOrozco MA. Prevalencia del asma bronquial en la ciudad de Guadalajara, Jalisco, México. Alergia. 1992;39:3-7
17. Corrêa MFP, Melo GO, Costa SS. Substâncias de origem vegetal potencial-mente úteis na terapia da asma. Rev Bras Farmacogn. 2008;18(Supl):785-97. 18. Brasil. Datasus. [cited 14 Oct 2009]. Available from: http://tabnet.datasus.gov.
br/cgi/tabcgi.exe?sih/cnv/mrsp.def.
19. Prefeitura Municipal de São José dos Campos. [cited 4 Feb 2010]. Available from: http://www.sjc.sp.gov.br/acidade/populacao.asp.
20. Brasil. Departamento de Informações e Informática do Sistema Único de Saúde, DATASUS. [cited 16 Sept 2009]. Available from: http://w3.datasus.gov. br/datasus/index.php.
21. Companhia de Tecnologia de Saneamento Ambiental, CETESB. [cited 16 Sept 2009]. Available from: http://www.cetesb.sp.gov.br.
22. Fundação de Ciência, Aplicações e Tecnologia Espaciais, FUNCATE. [cited 16 Sept 2009]. Available from: http://www.funcate.org.br/.
23. Gouveia N, Freitas CU, Martins LC, Marcilio IO. Hospitalizações por causas respiratórias e cardiovasculares associadas à contaminação atmosférica no município de São Paulo, Brasil. Cad Saúde Pública. 2006;22:2669-77. 24. Organização Mundial da Saúde. Air quality guideline. [cited 24 Sept 2009].
Available from: http://whqlibdoc.who.int/hq/2006/WHO_SDE_PHE_ OEH_06.02_eng.pdf.
25. Braga AL, Saldiva PH, Pereira LA, Menezes JJ, Conceição GM, Lin CA, Zanobetti A, Schwartz J, Dockery DW. Health efects of air pollution ex-posure on children and adolescents in São Paulo, Brazil. Pediatr Pulmonol. 2001;31:106-13.
26. Castro HA, Cunha MF, Mendonça GAS, Junger WL, Cunha-Cruz J, Leon AP. Efeitos da poluição do ar na função respiratória de escolares, Rio de Janeiro, RJ. Rev Saúde Pública. 2009;43:26-34.
27. Gouveia N, Fletcher T. Respiratory diseases in children and outdoor air pol-lution in São Paulo, Brazil: a time series analysis. Occup Environ Med. 2000; 57:477-83.
28. Veras C, Martins M. A coniabilidade dos dados nos formulários de Autoriza-ção de InternaAutoriza-ção Hospitalar (AIH), Rio de Janeiro, Brasil. Cad Saúde Pública. 1994;10:339-55.