www.spsp.org.br
REVISTA PAULISTA
DE PEDIATRIA
1984-0462/$ - see front matter © 2014 Sociedade de Pediatria de São Paulo. Published by Elsevier Editora Ltda. All rights reserved.
KEYWORDS
Nutrition assessment; Anthropometry; Nutritional status; Cerebral palsy; Child
Abstract
Objective: To perform anthropometric assessment of patients with quadriplegic, chronic non-progressive encephalopathy, comparing two distinct references of nutritional classification and to compare the estimated height to the length measured by stadiometer. Method: Cross-sectional study including 0-3-year children with quadriplegic chronic non-progressive encephalopathy in secondary public hospital. Length, weight, arm circumference, triceps skinfold and knee height were measured. The arm muscle circumference and estimated height were calculated. The following relations were evaluated: weight-for-age, length-for-age and weight-for-length, using as reference the charts of the World Health Organization (WHO) and those proposed by Krick et al. Results: Fourteen children with a mean age of 21 months were evaluated. Assessment of anthropometric indicators showed significant difference between the two classification methods to assess nutritional indicators length/age (p=0.014), weight/age (p=0.014) and weight/length (p=0.001). There was significant correlation between measured length and estimated height (r=0.796, p=0.001). Evaluation of arm circumference and triceps skinfold showed that most patients presented some degree of malnutrition. According to arm muscle circumference, most were eutrophic.
Conclusions: Specific curves for children with chronic non-progressive encephalopathy appear to underestimate malnutrition when one takes into account indicators involving weight. Curves developed for healthy children can be a good option for clinical practice and weight-for-length indicator and body composition measurements should be considered as complementary tools.
© 2014 Sociedade de Pediatria de São Paulo. Published by Elsevier Editora Ltda. All rights reserved.
ORIGINAL ARTICLE
Anthropometric evaluation of pediatric patients with
non-progressive chronic encephalopathy according to different
methods of classiication
☆Jéssica Socas Teixeira*, Mirian Martins Gomes
Fundação Oswaldo Cruz (FIOCRUZ), Rio de Janeiro, RJ, Brazil
Received 4 December 2013; accepted 18 March 2014
DOI refers to: 10.1590/1984-0462201432308
☆Study conducted at Instituto Nacional da Saúde da Mulher, da Criança e do Adolescente Fernandes Figueira, Fundação Oswaldo Cruz, Rio de Janeiro, RJ, Brazil.
*Corresponding author.
PALAVRAS-CHAVE
Avaliação nutricional; Antropometria; Estado nutricional; Paralisia cerebral; Criança
Avaliação antropométrica de pacientes pediátricos com encefalopatia crônica não
progressiva segundo diferentes métodos de classiicação
Resumo
Objetivo: Realizar a avaliação antropométrica de pacientes com encefalopatia crônica não progressiva quadriplégica, usando referências distintas de classificação do estado nutricional, e comparar a altura estimada com o comprimento mensurado por antropô-metro.
Métodos: Estudo transversal descritivo, incluindo crianças com encefalopatia crônica não progressiva quadriplégica de 0-3 anos em hospital público secundário. Foram aferidos comprimento, peso, circunferência do braço, prega cutânea tricipital e altura do joelho. Foram calculadas a circunferência muscular do braço e a estimativa da altura. Foram ava-liadas as relações peso/idade, comprimento/idade e peso/comprimento, utilizando como referência os gráficos da Organização Mundial de Saúde e os propostos por Krick et al. Resultados: Foram avaliadas 14 crianças com idade média de 21 meses. A avaliação dos indicadores antropométricos mostrou diferença significativa entre os dois métodos de classificação nutricional ao avaliar os indicadores comprimento/idade (p=0,014), peso/idade (p=0,014) e peso/comprimento (p=0,001). Houve correlação significativa entre comprimento mensurado e estatura estimada (r=0,796; p=0,001). A avaliação da circunferência do braço e prega cutânea tricipital mostrou que a maioria dos pacientes apresentava algum grau de desnutrição, mas, de acordo com a medida da circunferência muscular do braço, a maioria estava eutrófica.
Conclusões: Curvas específicas para crianças com encefalopatia parecem subestimar a desnutrição, quando se leva em consideração indicadores que envolvem peso. Curvas elaboradas para crianças hígidas podem ser boa opção para prática clínica, devendo-se considerar indicador peso/estatura e as medidas de composição corporal como ferra-mentas complementares.
© 2014 Sociedade de Pediatria de São Paulo. Publicado por Elsevier Editora Ltda. Todos os direitos reservados.
Introduction
Anthropometrics is used to assess nutritional status, as it is a simple, noninvasive technique with no additional costs. It is, therefore, the tool of choice to assess dimorphism in children.1 It becomes difficult to employ anthropometric methods developed for the general pediatric population in patients with non-progressive chronic encephalopathy (NPCE) due to postural alterations (some children are unable to remain in the standing position, have contrac-tures, scoliosis, and involuntary muscle spasms) and little cooperation (cognitive impairment).2 Although the problem of measurement can be attenuated with the use of alter-native measures, the main problem remains the reference standard.3
Some methods have been validated to measure body composition, such as the doubly-labeled water technique (DEXA), hydrostatic weighing, and bioelectrical imped-ance. However, these methods may not be feasible in clinical follow-up. Clinicians often use a variety of anthropometric measurements to estimate adiposity, but the applicability of such measures in the prediction of body fat percentage in these children is unclear.4
Specific growth references for children with NPCE should facilitate a uniform assessment of growth and nutritional status and simplify the comparative interpre-tation of growth data.5 Moreover, as it is an extremely
heterogeneous condition, the use of growth charts for NPCE as a reference standard may not be very accurate.6
Currently, the Brazilian Food and Nutrition Surveillance System (Sistema de Vigilância Alimentar e Nutricional – SISVAN)7 recommends that the classification to be used in healthy children should be performed using the growth curves of the World Health Organization (WHO).8 A clas-sification method using the curves developed by Krick et al5 is specific for patients with quadriplegic NPCE aged 0 to 120 months according to: weight/age, height/age, and weight/height. Nutritional assessment becomes cru-cial, not only because it allows identifying and monitor-ing cases or possible cases of malnutrition, common in neurologically impaired individuals, but it also allows the adoption of measures to minimize the process through proposals of adequate and individualized dietary coun-seling and monitoring of the nutritional status, aiming to achieve appropriate body size.9
Methods
This is a cross-sectional descriptive study carried out at the Instituto Nacional da Saúde da Mulher, da Criança e do Adolescente Fernandes Figueira in Rio de Janeiro, RJ, Brazil. All children with quadriplegic NPCE aged 0 to 3 years and 11 months, treated and followed at the Motor Physical Therapy Outpatient Clinic at the hospital during the month of September of 2012 that met the criteria were included in the study. The one-month collection period is justified by the fact that new patients are not accepted at the clinic due to a full schedule, and this time interval is enough to collect data from all patients who meet the inclusion cri-teria. Patients with a diagnosis confirmed by a neurologist, whose parents/guardians signed an informed consent form were included, whereas children with some type of associ-ated genetic syndrome were excluded.
Of the total of 20 children with quadriplegic NPCE treated at the clinic, 14 met the study inclusion crite-ria. Anthropometric data were collected on the same day of physical therapy care and recorded in a specific pro-tocol. The assessment of social class was adapted from that of the Brazilian Association of Research Companies (Associação Brasileira de Empresas de Pesquisa – ABEP), in which families are pertinently classified as social classes: A, B, C, D, and E.
Anthropometric assessment was performed by measur-ing the followmeasur-ing parameters: length, usmeasur-ing a horizontal anthropometer 110 cm long and with a 0.1 cm precision; weight, in a digital Filizola® scale (Filizola, São Paulo, Brazil) used to weigh babies, with a maximum capacity of 15 kg and 10 g of variation for children younger than 2 years, and a platform-type Filizola® mechanical scale (Filizola, São Paulo, Brazil) with a maximum capacity of 150 kg and varia-tion 0.1 kg by calculating the weight difference between the child and the caregiver for children older than 2 years; AC, with an inextensible millimeter tape, graduated every 0.5 cm; TSF, using a Lange® skinfold caliper (Power Systems, Inc., Tennessee, USA) with a precision of 1 mm; and knee height (KH), measured with an inextensible millimeter tape with a variation of 0.5 cm, corresponding to the distance between the knee and the ankle.
All these measurements were performed in duplicate and the mean of two measurements was considered for the analysis. Based on these measurements, the AMC and the estimated height by the KH were calculated. The length measured by the stadiometer was compared to the esti-mated height by the KH, according to the formula proposed by Stevenson et al.10
The weight for age (W/A), length for age (L/A), and weight for length (W/L) ratios were assessed using the World Health Organization (WHO) charts8 and those proposed by Krick et al5 as reference. Classification of nutritional status was per-formed by AC, AMC, and TSF, using as reference the values proposed by Frisancho11, for children older than 1 year, and by Jelliffe12 for those younger than 1 year.
All procedures performed in this study were approved by the Research Ethics Committee of the institution, under protocol number: 03375512.2.0000.5269.
For data analysis, measures of central tendency and dispersion were calculated, using the chi-squared test to
evaluate the association between categorical variables. Spearman’s coefficient was used to evaluate associations between measured height and estimated height. A p-value <0.05 was considered significant. The database and sta-tistical analyses were performed using SPSS for Windows software, release 17 (SPSS Inc., Chicago, USA).
Results
A total of 14 children with quadriplegic NPCE were included. Age ranged from 8 to 45 months, with a mean of 21 ± 11 months, and 79% were males. Social class C was the most frequent (85%), and the same frequen-cy was observed for classes B and D (8%). None of the patients was classified as belonging to classes A and E. Of the studied children, most had received prior nutritional counseling (64%), and 56% had been advised by nutrition-ists. Most patients had been hospitalized once since birth (36%). Only 29% had a history of repetitive pneumonia and 21% were fed through gastrostomy.
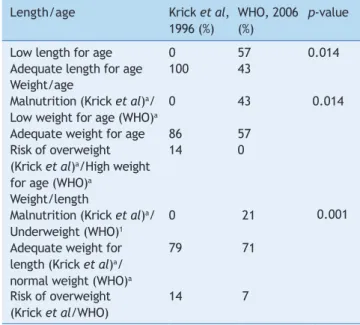
The evaluation of anthropometric indicators based on nutritional classification methods proposed by Krick et al5 and the WHO8 regarding the L/A showed that, accord-ing to the specific reference for patients with NPCE,5 all patients had adequate L/A. When assessed by WHO8 standards, it was observed that the majority (57%) had short L/A. Statistical analysis showed a significant differ-ence (p=0.014) between the two methods used for L/A assessment (Table 1).
Regarding W/A, when assessing the curves by Krick et al,5 it was observed that the majority had adequate W/A (86%), 14% were classified as at risk for overweight, and no child was classified as malnourished. When using the WHO curves,8 it was also observed that the majority had adequate W/A (57%). However, 43% of patients showed low W/A and none had high W/A. A statistical difference was observed between the two methods of assessment (p=0.014; Table 1).
In assessing W/L, it was observed that, when using Krick et al’s reference,5 no patient had malnutrition, 79% had normal W/L, and 14% were at risk of overweight. When using the WHO curves,12 21% of the patients were under-weight, 71% had normal under-weight, 7% were at risk of over-weight, and none showed overweight or obesity. Significant differences were observed regarding the classification of nutritional status, using the W/L index between the refer-ences by Krick et al5 and WHO8 (p=0.001; Table 1).
The classification of nutritional status, obtained by AC, demonstrated that most patients (57%) had some degree of malnutrition. The AMC showed that 58% of the patients had normal weight and the assessment by TSF showed that most patients (86%) were malnourished (Table 2). It was not possible to associate the circumfer-ence and skinfold assessments to the other anthropo-metric indicators (H/A, W/A, and W/L), due to the small sample size.
Table 1 Classiication of nutritional status according to
the length/age, weight/age, and weight/length indicators (Rio de Janeiro, Brazil, 2012)
Length/age Krick et al, 1996 (%)
WHO, 2006 (%)
p-value
Low length for age 0 57 0.014
Adequate length for age 100 43 Weight/age
Malnutrition (Krick et al)a/ Low weight for age (WHO)a
0 43 0.014
Adequate weight for age 86 57 Risk of overweight
(Krick et al)a/High weight for age (WHO)a
14 0
Weight/length
Malnutrition (Krick et al)a/ Underweight (WHO)1
0 21 0.001
Adequate weight for length (Krick et al)a/ normal weight (WHO)a
79 71
Risk of overweight (Krick et al/WHO)
14 7
aThe nomenclatures differ according to the reference used.
Table 2 Classiication of nutritional status according to body composition measurements (Rio de Janeiro, Brazil, 2012)
Normal weight (%)
Malnutrition (%)
Arm circumference 43 57
Arm muscle circumference 58 42 Tricipital skinfold thickness 14 86
Discussion
The health management of children with NPCE requires nutritional assessment as growth disorders and nutritional deficits are present in approximately one third of these pediatric patients.13 For this purpose, a variety of meth-ods, parameters, and classifications have been suggested, leading to results and interpretations at different clini-cal levels, making it difficult to collect data and perform meta-analyses.14
The evaluation of L/A in this study demonstrated that, according to the reference by Krick et al, no child had length deficit, whereas according to the classification of the WHO, the majority had short L/A. There are sever-al reasons why children with NPCE are shorter than their healthy peers of the same age. Shapiro et al15 observed that isolated nutritional factors are not responsible for the delay in linear growth observed in this population. It is suggested that non-nutritional factors and disease sever-ity have a remarkable influence on the growth of children with NPCE.5
According to Stallings et al16 in children with severe cere-bral palsy, linear growth is reduced to lower than the third percentile, considering growth curves for healthy children. This reduction in linear growth can occur due to factors related to the brain injury itself.17 Children with NPCE grow
and develop, but at a slower pace. However, their develop-ment is not only delayed, but disorderly and impaired as a result of the brain injury.18 Moreover, chronic malnutrition or other nutritional deficiencies can impair proper growth and development.9,19
The W/A index evaluated in this study showed that according to the curve by Krick et al, the majority had adequate W/A and none was classified as malnourished. According to the classification by the WHO curves, 43% were underweight for age. Regarding the W/L, it was observed that no patient had malnutrition according to the curves by Krick et al, and that most had adequate W/L.
When evaluating the WHO reference, it was observed that 21% were underweight, most had normal weight, and no patient was overweight or obese. It must be considered that growth and weight gain in these children often differ from those of healthy children of the same age. However, this study demonstrated that, even when considering the curve created for healthy children, most had adequate W/A and weight for height, showing that it is possible to attain this condition despite the diagnosis of NPCE. Since a high percentage of children with a nutritional diagnosis of low W/A according to the WHO was observed, it is suggested that the curve by Krick et al may underestimate low weight. The ideal weight for this population is estimated at the 10th percentile of weight for height in the curves developed for healthy children, allowing for adequate body fat and muscle reserves.5 Since the W/L index assesses the child’s association with him/herself, regardless of age, the find-ings of this study suggest that the reference by Krick et al may underestimate malnutrition in these patients and overestimate the risk of overweight. Krick et al5 suggest that the specific curves are used together with the growth curves for healthy patients, and that the 50th percentile of W/L, according to the reference for NPCE, should be considered the target.
Tomoum et al6 reported a low percentage of malnutrition using the specific reference standards for children with quadriplegic NPCE. Recent data suggest that these refer-ences seem to mask patients’ malnutrition and their needs; therefore they are not considered the preferred method to be used.14 In fact, another study of children with quadriple-gic NPCE, using the WHO reference, demonstrated that 92% of the assessed children were malnourished.20
As it was observed, there are differences regarding the type of growth chart to be used and the cutoff points, which result in different prevalence rates according to the method chosen for assessing nutritional status. This fact was reinforced by the present study, as statistical dif-ferences were observed when comparing the two growth curves on all indicators evaluated, suggesting that the nutritional diagnosis of these patients also depends on the type of reference used.
both are good indicators of nutritional status in children with NPCE.
Studies show a reduction in fat-free mass in patients with NPCE due to impaired linear growth, muscle mass depletion and atrophy.6,23,24 The present study, when assessing the fat-free mass by AMC, found different results from those reported in the literature, as most patients had a nutri-tional classification of normal weight, evidencing that the lean body mass of the assessed patients was still preserved. The TSF is used in the determination of body fat and also allows for the assessment of nutritional status. This appears to be the simplest and most practical method available to determine both subcutaneous and total body fat.6 One study demonstrated that the measurement of triceps skin-fold has sensitivity and specificity to predict malnutrition.4 According to Samson-Fang and Stevenson,25 TSF can be considered the best screening tool for the diagnosis of mal-nutrition in children with NPCE. The present study demon-strated that most patients were malnourished when evalu-ated by this method. Similar results were reported by other studies.4,25 Rieken et al25 showed that children with CP have less subcutaneous fat and more intra-abdominal fat. Another case-control study demonstrated that fat mass is significantly lower in the group with NPCE than in the con-trol group. Fat mass was positively correlated with weight and body mass index in both groups.18
As it was observed in the present study, many children had adipose compartment impairment. Since the assess-ment of the TSF has been reported in the literature for patients with NPCE, it appears that the results can ade-quately reflect the nutritional status of the analyzed patients.
The literature review retrieved four studies that inves-tigated the validity of skinfold measurement and bioelec-trical impedance analysis in children with severe NPCE in comparison with other methods, such as DXA and isotope dilution. Although most studies have reported a favorable ratio for such measures, these conclusions are hampered by small and heterogeneous samples and the lack of meth-odological quality. Therefore, the validity of skinfold mea-surements and bioelectrical impedance analysis in children with NPCE needs a more robust evaluation.26
In the present study, data from the nutritional diagnosis by body composition were closer to the results found when using the WHO curves. However, the small number of cases assessed did not allow for the analysis of the correlation between body composition data and the evaluated curves. Regarding the measurement of height, there is a diffi-culty due to the presence of skeletal contractures and the incapacity of most patients to stand up.18 Stevenson et al10 developed formulas to estimate height by segmental mea-sures; the length from knee to ankle (KH) is the most appro-priate, using the following equation: estimated height= (KHx2.69)+24.2. In the current study, as the patients were not capable of standing up unaided, which was also related to the young age range included in the study, it was not possible to measure the height, but length was measured in all patients, as well as the KH, allowing for the application of the equation proposed by Stevenson et al.10
Statistical analysis evidenced a positive correlation between these two measures, suggesting that the use of
both is safe for nutritional monitoring. This result is cor-roborated by the study by Linhares,27 which demonstrated that the anthropometric method described by Stevenson et al10 allows for a better nutritional monitoring of children with NPCE.
Regarding the comparison of the two methods of nutri-tional status classification of children with NPCE proposed by the current study, statistical differences between the growth curves were observed. It should be noted that the specific curve for children with encephalopathy is limited to the age of 10 years, which restricts its use. Moreover, the specific curves appear to underestimate malnutrition when indices involving weight and body composition are considered.
Therefore, it is suggested that the curves created for healthy children can be a good option for clinical prac-tice, considering the W/H index and, when evaluating the height/age index, the stunting that occurs in most of these patients should be taken into account. The association of measures of body composition, whenever possible, is also recommended as complementary tools. Regarding the mea-surement of height/length, it was observed that, when it is not possible to perform the actual measurement, the esti-mation of stature is a safe method. At any rate, each child must be evaluated individually, and the follow-up needs to be constant, in order to preserve the nutritional status. The small sample size constituted a limitation of the present study, as it reflects the specificity of the assessed encephalopathy (quadriplegic), the fact that only outpa-tients were selected (considering that hospitalization can influence the nutritional status), the short follow-up period, and the reality of the center where the study was conduct-ed, which does not have the facilities to treat a large num-ber of patients.
Further studies, preferably multicenter with larger sam-ple sizes, are necessary in order to establish recommenda-tions for this population. Furthermore, it should be empha-sized that the study was conducted in a referral hospital, in which patient care is performed by a multidisciplinary team.
The fact that most of the study population had normal weight, regardless of the evaluation method, demonstrates that a multidisciplinary follow-up can optimize the growth and development of these children, despite all the limita-tions associated with encephalopathy. Therefore, it is rec-ommended that multidisciplinary care of these patients is implemented as early as possible, in order to prevent defi-ciencies and disorders that may directly interfere with their development, as well as with family routine and social life.
Conlicts of interest
The authors declare no conflicts of interest.
References
2. Souza KE, Sankako AN, Carvalho SM, Braccialli LM. Classiication of gross motor function injury and body mass índex in children with cerebral palsy. Rev Bras Crescimento Desenvolvimento Hum 2011;21:11-20.
3. Stevenson RD, Conaway M, Chumlea C, Rosenbaum P, Fung EB, Henderson RC et al. Growth and health in children with moderate-to-severe cerebral palsy. Pediatrics 2006;118:1010-8.
4. Kuperminc MN, Gurka MJ, Bennis JA, Busby MG, Grossberg RI, Henderson RC, Stevenson RD. Anthropometric measures: poor predictors of body fat in children with moderate to severe cerebral palsy. Dev Med Child Neurol 2010;52:824–30.
5. Krick J, Murphy-Miller P, Zeger S, Wright E. Pattern of growth in children with cerebral palsy. J Am Diet Assoc 1996;96:680-5. 6. Tomoum HY, Badawy NB, Hassan NE, Alian KM. Anthropometry
and body composition analysis in children with cerebral palsy. Clin Nutr 2010;29:477-81.
7. Brasil – Ministério da Saúde. Vigilância Alimentar e Nutricional – SISVAN. Orientações básicas para a coleta, o processamento e a análise de dados e informações em serviços de saúde [Série A Normas e Manuais Técnicos]. Brasília: Ministério da Saúde; 2004.
8. World Health Organization. WHO child growth standards: length/height-for-age, weight-for-age, weight-for-length, weight-for-height and body mass index-for-age - methods and development. Geneva: WHO; 2006.
9. Ferreira HS, França AO. Evolution of nutritional status in hospitalized children. J Pediatr (Rio J) 2002;78:491-6. 10. Jellife DB. The assessment of the nutritional status of the
community. Geneva: WHO; 1996.
11. Frisancho AR. New norms of upper limb fat and muscle areas for assessment of nutricional status. Am J Clin Nutr 1981;34:2540-5.
12. Stevenson RD. Use of segmental measures to estimate stature in children with cerebral palsy. Arch Pediatr Adolesc Med 1995;149:658-62.
13. Caram AL. Anthropometric status in children with cerebral palsy [tese de mestrado]. Campinas (SP): Unicamp; 2006. 14. Karagiozoglou-Lampoudi T, Daskalou E, Vargiami E, Zafeiriou D.
Identiication of feeding risk factors for impaired nutrition status in paediatric patients with cerebral palsy. Acta Paediatr 2012;101:649-54.
15. Shapiro B, Green P, Krick J, Allen D, Capute AJ. Growth of severely impaired children: neurological versus nutritional factors. Dev Med Child Neurol 1986;28:729-33.
16. Stallings VA, Charney EB, Davies JC, Cronk CE. Nutrition-related growth failure of children with quadriplegic cerebral palsy. Dev Med Child Neurol 1993;35:126-38.
17. Piovesana AM, Val Filho JA, Lima CL, Fonseca MS, Murer AP. Encefalopatia crônica – paralisia cerebral. In: Fonseca LF, Xavier CC, Pianetti G, editors. Compêndio de neurologia infantil. Rio de Janeiro: Medsi; 2002. p. 826-37.
18. Bobath B, Bobath K. Desenvolvimento motor nos diferentes tipos de paralisia cerebral. São Paulo: Manole; 1989.
19. Vitolo MR. Avaliação nutricional da criança. In: Vitolo MR, editor. Nutrição, da gestação à adolescência. Rio de Janeiro: Reichmann & Affonso; 2003. p. 97-113.
20. Salles DB, Novello D. Avaliação nutricional em crianças portadoras de paralisia cerebral. Rev Eletron Lato Sensu [serial on the Internet]. 2007;2(1) [cited 2012 Aug 15]. Available from: http://www.unicentro.br
21. Gray GE, Gray LK. Anthropometric measurements and their interpretations: principles, pratices, and problems. J Am Diet Assoc 1980;77:534-9.
22. Sullivan PB, Lambert B, Rose M, Ford-Adams M, Johnson A, Grifiths P. Prevalence and severity of feeding and nutritional problems in children with neurological impairment: oxford feeding study. Dev Med Child Neurol 2000;42:674–80.
23. Arrowsmith FE, Allen JR, Gaskin KJ, Gruca MA, Clarke SL, Briody JN et al. Reduced body protein in children with spastic quadriplegic cerebral palsy. Am J Clin Nutr 2006;83:613-8. 24. Sert C, Altindağ O, Sirmatel F. Determination of basal metabolic
rate and body composition with bioelectrical impedance method in children with cerebral palsy. J Child Neurol 2009;24:237-40.
25. Samson-Fang LJ, Stevenson RD. Identiication of malnutrition in children with cerebral palsy: poor performance of weight-for-height centiles. Dev Med Child Neurol 2000;42:162–8.
26. Rieken R, Calis EA, Tibboel D, Evenhuis HM, Penning C. Validation of skinfold measurements and bioelectrical impedance analysis in children with severe cerebral palsy. Clin Nutr 2010;29:217-21.