What happens to the luid balance during and
after recovering from septic shock?
INTRODUCTION
Fluid replacement is the cornerstone of the treatment for septic shock, which is followed by vasopressors and inotropes. Venodilation, transudation of luids from the vascular space into tissues, and reduced oral intake result in hypovolemia in the irst hours of sepsis.(1)
In septic patients, the microcirculation is markedly deranged with a lower
low velocity and more heterogeneous perfusion.(2-5) Hypovolemia further
exacerbates the altered perfusion of the microcirculation, resulting in inadequate oxygen availability for mitochondrial oxidative phosphorylation. herefore, the main goal of early management is to treat hypovolemia and restore tissue perfusion.(1)
Andrea Regina Lopes Cunha1, Suzana Margareth Ajeje Lobo1
1. Intensive Care Division, Hospital de Base, Faculdade de Medicina de São José do
Rio Preto - São José do Rio Preto (SP), Brazil. Objective: We aimed to evaluate the cumulative luid balance during the period of shock and determine what happens to luid balance in the 7 days following recovery from shock.
Methods: A prospective and
observational study in septic shock patients. Patients with a mean arterial pressure ≥ 65mmHg and lactate < 2.0mEq/L were included < 12 hours after weaning from vasopressor, and this day was considered day 1. he daily luid balance was registered during and for seven days after recovery from shock. Patients were divided into two groups according to the full cohort’s median cumulative luid balance during the period of shock: Group 1 ≤ 4.4L (n = 20) and Group 2 > 4.4L (n = 20).
Results: We enrolled 40 patients in the study. On study day 1, the cumulative luid balance was 1.1 [0.6 - 3.4] L in
Conflicts of interest: None.
Submitted on April 25, 2014 Accepted on September 1, 2014
Corresponding author:
Suzana Margareth Ajeje Lobo
Divisão de Tratamento Intensivo do Hospital de Base da Faculdade de Medicina de São José do Rio Preto
Avenida Brigadeiro Faria Lima, 5.416 Zip code: 15090-000 - São José do Rio Preto (SP), Brazil
E-mail: [email protected]
Responsible editor: Luciano César Pontes de Azevedo
O que ocorre com o balanço hídrico durante e após a reversão do
choque séptico?
ABSTRACT
Keywords: Sepsis; Shock, septic;
Fluid therapy; Water-electrolyte balance Group 1 and 9.0 [6.7 - 13.8] L in Group 2. On study day 7, the cumulative luid balance was 8.0 [4.5 - 12.4] L in Group 1 and 14.7 [12.7 - 20.6] L in Group 2 (p < 0.001 for both). Afterwards, recovery of shock luid balance continued to increase in both groups. Group 2 had a more prolonged length of stay in the intensive care unit and hospital compared to Group 1.
Conclusion: In conclusion, positive luid balances are frequently seen in patients with septic shock and may be related to worse outcomes. During the shock period, even though the luid balance was previously positive, it becomes more positive. After recovery from shock, the luid balance continues to increase. he group with a more positive luid balance group spent more time in the intensive care unit and hospital.
In the early phase of sepsis, therapeutic goals have been proposed to guide luid resuscitation, and they are widely
accepted.(1,6) he current guidelines recommend liberal
luid resuscitation in this phase. However, after initial monitoring, management and stabilization of the mean arterial pressure (MAP) with vasopressors, further luids are often administered according to subjective data from the clinical examination, urine output, and measurements of the ventricular illing pressures.(1)
Excess luids may be harmful in critically ill patients and have been correlated with the mortality and various complications, such as heart failure, pulmonary edema, pneumonia, dilutional coagulopathy, decreased gastrointestinal motility, abdominal compartment syndrome, and more.(1,7-9)
We hypothesized that patients in septic shock receive excess luids even after they are weaned from vasopressors. herefore, we evaluated the luid balance during the period of shock and for 7 days after patients were weaned from vasoactive drugs.
METHODS
his was a prospective, observational, cohort study that was performed between May 2009 and October 2010 in a 10-bed intensive care unit at a university hospital. he study was approved by the Institutional Ethics Committee of Hospital de Base, Faculdade de Medicina de São José do Rio Preto, document nº 426/2008. Informed consent was obtained from the next of kin.
Septic shock was deined according to previously
described criteria.(10) Patients older than 18 years of
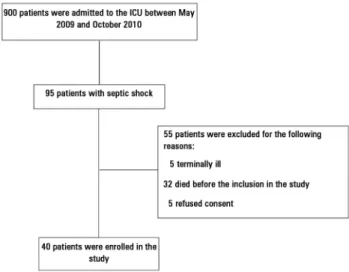
agewho had septic shock were evaluated if they had been weaned from all vasopressors for ≤ 12 hours, had a MAP ≥ 65mmHg and had a serum lactate < 2.0mEq/L (Figure 1). he exclusion criteria were pregnancy and lack of consent from the family or assistant physician or if the patient was considered unlikely to survive hospitalization.
he data recorded prospectively on admission included the following: age, sex, patient classiication (medical or surgical), smoking history (active in the last year), alcohol consumption and comorbidities (based on the International Classiication of Disease-10, anamnesis and electronic patient charts). Daily measurements of all luid intake and output; use of vasopressors, dobutamine and furosemide; vital signs; MAP; central venous pressure (CVP) and urinary output were recorded for seven days after enrollment. Day 1 was considered the day that the
Figure 1 - Study flowchart. ICU - intensive care unit.
patients had been weaned from all vasopressors for ≤ 12 hours, had a mean arterial pressure (MAP) ≥ 65mmHg and had a serum lactate concentration < 2.0mEq/L.
he cumulative luid balance was calculated during the period of shock, after which the luid balance was reinitiated from zero and registered during 7 days. Patients were divided into 2 groups according to the total cohort’s median cumulative luid balance that was administered during the period of shock with vasopressors, which was calculated on study day 1. he luid balance was calculated by the diference between the infused luids (crystalloids, colloids, drug dilution luids, blood products, and water by nasogastric drain) and eliminated liquids (diuresis, dialysis, and drains). It was attributed to the value of 400mL for endogenous water and 800mL for imperceptive losses, adding 100mL/h/for each degree above 37.8°C
he Acute Physiology and Chronic Health Evaluation (APACHE II) was used to assess the severity of disease at admission in the intensive care unit (ICU), and the Sequential Organ Failure Assessment (SOFA) score was used to assess the severity of the disease at inclusion in
the study.(11,12) Comorbid diabetes mellitus was recorded
for patients with current use of oral hypoglycemic agents or insulin. Acute respiratory failure and acute respiratory distress syndrome (ARDS) were deined according to the 1994 American-European Consensus Conference deinitions. Nosocomial infection was deined as an
infection acquired after 48 hours of hospitalization.(13)
and/or a urine output < 0.5mL/kg/h for more than 6
hours.(14) A major complication was considered as any
life-threatening event or unexpected medical event that prolonged the length of hospital stay.
Statistical analysis
he categorical variables were treated as proportions and analyzed using the chi-square test. he continuous variables with a normal distribution are presented as the means and standard deviations and evaluated using the t-test, while the variables that did have a normal distribution were evaluated using the Kruskal-Wallis test and are presented as the medians and conidence intervals. p < 0.05 was considered statistically signiicant. ANOVA was used to test for repeated measures, which was followed by Bonferroni pair-wise comparisons.
RESULTS
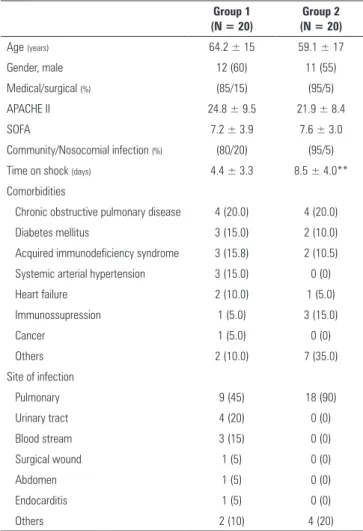
We enrolled 40 patients in the study (Figure 1). he mean age of the patients was 61.6 ± 16 years, and their SOFA score was 7.4 ± 3.5 and APACHE II score was 23.4 ± 8.9. he median time to recovery from shock (duration on vasopressor drugs) before inclusion in the study was ive days. Table 1 shows the clinical characteristics and epidemiological data of the two study groups. he most frequent site of infection was the respiratory tract (67%). he duration of shock prior to study inclusion was signiicantly higher in Group 2 than in Group 1 (8.5 ± 4.0 days versus 4.4 ± 3.3 days, respectively, p < 0.001).
he physiological variables and laboratory tests are shown in table 2. On study day 5, Group 2 had a signiicantly higher CVP (12 ± 5mmHg versus 9 ± 4mmHg, p = 0.04) and mean arterial pressure (86 ± 15mmHg versus 76 ± 14mmHg, p = 0.03) than Group 1. Compared to Group 1, Group 2 had signiicantly lower urea levels on day 7 (81 ± 40mg/dL versus 138 ± 78mg/dL, p = 0.006) and larger urine volumes on days 6 and 7. Group 2 had lower hemoglobin levels than Group 1 on day 1 and from day 4 to day 7 (p < 0.05 for all). he PO2/FiO2 ratio was lower in Group 2 than in Group 1 on days 1 and 6.
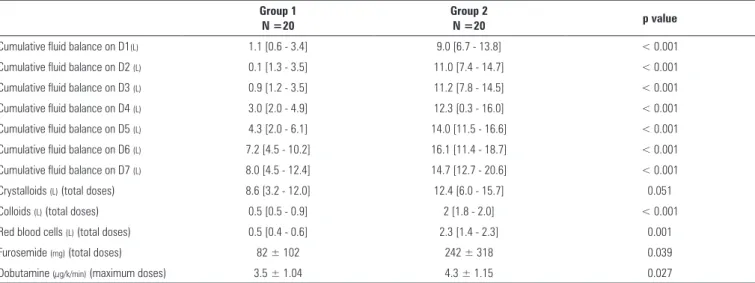
On day 1, the cumulative luid balance was 1.1 [0.6 - 3.4] L in Group 1 and 9.0 [6.7 - 13.8] L in Group 2 (p < 0.001). On day 7, the cumulative luid balance was 8.0 [4.5 - 12.4] L in Group 1 and 14.7 [12.7 - 20.6] L in Group 2 (p < 0.001), considering not only the luid balance after shock but also the cumulative luid balance during shock.
Table 1 - Characteristics of the two groups
Group 1 (N = 20)
Group 2 (N = 20)
Age (years) 64.2 ± 15 59.1 ± 17
Gender, male 12 (60) 11 (55)
Medical/surgical (%) (85/15) (95/5)
APACHE II 24.8 ± 9.5 21.9 ± 8.4
SOFA 7.2 ± 3.9 7.6 ± 3.0
Community/Nosocomial infection (%) (80/20) (95/5)
Time on shock (days) 4.4 ± 3.3 8.5 ± 4.0**
Comorbidities
Chronic obstructive pulmonary disease 4 (20.0) 4 (20.0)
Diabetes mellitus 3 (15.0) 2 (10.0)
Acquired immunodeficiency syndrome 3 (15.8) 2 (10.5)
Systemic arterial hypertension 3 (15.0) 0 (0)
Heart failure 2 (10.0) 1 (5.0)
Immunossupression 1 (5.0) 3 (15.0)
Cancer 1 (5.0) 0 (0)
Others 2 (10.0) 7 (35.0)
Site of infection
Pulmonary 9 (45) 18 (90)
Urinary tract 4 (20) 0 (0)
Blood stream 3 (15) 0 (0)
Surgical wound 1 (5) 0 (0)
Abdomen 1 (5) 0 (0)
Endocarditis 1 (5) 0 (0)
Others 2 (10) 4 (20)
Group 1: fluid balance at day 1 ≤ 4.4L; Group 2: fluid balance at day 1 > 4.4L. Some patients have more than one site of infection. APACHE II - Acute Physiology and Chronic Health Evaluation; SOFA - Sequential Organ Failure Assessment score. The results are expressed in numbers (%) or the mean ± standard deviation. ** p < 0.001 versus Group 1.
Group 2 received more crystalloids (12.4 [6.0 - 15.7] L versus 8.6 [3.2 - 12.0] L, p = 0.051), colloids (2 [1.8 - 2.0] L versus 0.5 [0.5 - 0.9] L, p < 0.001) and packed red blood cells (2.3 [1.4 - 2.3] L versus 0.5 [0.4 - 0.6] L, p < 0.001) than Group 1 (Table 3). Diuretics and dobutamine were given more frequently in Group 2 (Table 3). Group 2 had longer lengths of stay in the ICU (21 versus11 days, p = 0.02) and in hospital stays (29 versus 16.5 days; p = 0.028) than the patients in Group 1 (Table 4).
Table 2 - Physiological variables in the two groups
Day
Group 1 2 3 4 5 6 7
CVP (mmHg) 1 12 ± 7 12 ± 7 11 ± 4 11 ± 3 9 ± 4 9 ± 4 9 ± 3
2 14 ± 6 13 ± 5 12 ± 4 12 ± 4 12 ± 5* 11 ± 5 11 ± 4
MAP (mmHg)
1 82 ± 11 80 ± 16 83 ± 19 87 ± 12 76±14 80 ± 12 80 ± 11
2 84 ± 13 80 ± 10 86 ± 14 81 ± 14 86 ± 15* 80 ± 15 84 ± 15
Hemoglobin 1 12.0 ± 3.3 11.0 ± 2.7 10.1 ± 2.5 12.5 ± 2.9 11.7 ± 2.7 11.5 ± 2.2 11.9 ± 1.9
2 9.9 ± 2.2* 9.9 ± 1.9 10.4 ± 1.7 10.0 ± 2.1** 9.5 ± 1.9** 9.8 ± 1.9* 10.4 ± 1.7*
Urea (mg/dL) 1 101 ± 46 117 ± 56 134 ± 61 108 ± 68 102 ± 70 135 ± 87 138 ± 78
2 132 ± 87 153 ± 64§ 155 ± 82§ 120 ± 53 113 ± 53 112 ± 50 81 ± 40**
Creatinine (mg/dl) 1 2.4 ± 1.9 2.2 ± 1.6 2.4 ± 2.1 2.0 ± 1.9 2.1 ± 1.8 2.5 ± 1.9 2.4 ± 1.8
2 1.8 ± 1.4 1.7 ± 1.5 1.8 ± 1.4 1.7 ± 1.3 1.9 ± 1.5 1.7 ± 1.7 1.6 ± 1.6
Diuresis (L/day)
1 1.6 ± 1.5 1.8 ± 1.3 1.8 ± 1.7 1.7 ± 1.3 1.4 ± 1.3 1.4 ± 1.4 1.1 ± 0.9
2 1.9 ± 1.4 2.2 ± 1.8 2.1 ± 1.8 2.6 ± 2.1 2.2 ± 1.3 2.5 ± 1.3* 2.4 ± 1.7**
PaO2/FiO2
1 347 ± 135 342 ± 131 335 ± 117 335 ± 101 297 ± 131 295 ± 99 263 ± 109
2 258 ± 85* 276 ± 106 303 ± 129 307 ± 116 269 ± 109 216 ± 98* 273 ± 117
Group 1: fluid balance at day 1 ≤ 4.4L; Group 2: fluid balance at day 1 > 4.4L. CVP - central venous pressure; MAP - mean arterial pressure; PaO2/FiO2 - partial arterial oxygen pressure/fraction of inspired oxygen ratio. The results are expressed as the mean ± standard deviation. * p < 0.05 versus Group 1; ** p < 0.001 versus Group 1; § p < 0.05 versus day 7.
Table 3 - Type of fluids, fluid balance and use of furosemide and dobutamine in Groups 1 and 2
Group 1 N =20
Group 2
N =20 p value
Cumulative fluid balance on D1(L) 1.1 [0.6 - 3.4] 9.0 [6.7 - 13.8] < 0.001
Cumulative fluid balance on D2 (L) 0.1 [1.3 - 3.5] 11.0 [7.4 - 14.7] < 0.001
Cumulative fluid balance on D3 (L) 0.9 [1.2 - 3.5] 11.2 [7.8 - 14.5] < 0.001
Cumulative fluid balance on D4 (L) 3.0 [2.0 - 4.9] 12.3 [0.3 - 16.0] < 0.001
Cumulative fluid balance on D5 (L) 4.3 [2.0 - 6.1] 14.0 [11.5 - 16.6] < 0.001
Cumulative fluid balance on D6 (L) 7.2 [4.5 - 10.2] 16.1 [11.4 - 18.7] < 0.001
Cumulative fluid balance on D7 (L) 8.0 [4.5 - 12.4] 14.7 [12.7 - 20.6] < 0.001
Crystalloids (L) (total doses) 8.6 [3.2 - 12.0] 12.4 [6.0 - 15.7] 0.051
Colloids (L) (total doses) 0.5 [0.5 - 0.9] 2 [1.8 - 2.0] < 0.001
Red blood cells (L) (total doses) 0.5 [0.4 - 0.6] 2.3 [1.4 - 2.3] 0.001
Furosemide (mg) (total doses) 82 ± 102 242 ± 318 0.039
Dobutamine (µg/k/min) (maximum doses) 3.5 ± 1.04 4.3 ± 1.15 0.027
Group 1: fluid balance at day 1 ≤ 4.4L; Group 2: fluid balance at day 1 > 4.4L. The values are presented as the median [25% - 75%] or mean (SD).
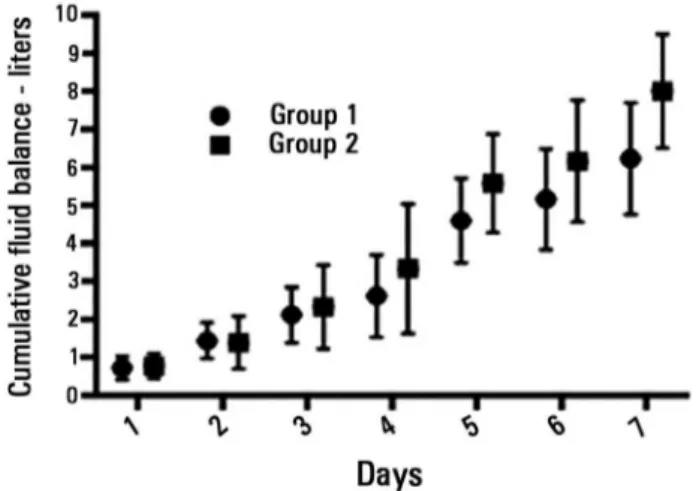
day 5 (n = 31): 4.4L (-0.12 - 6.2L), day 6 (n = 28): 5.4L (2.0 - 8.6L), and day 7 (n = 26): 5.1L (2.8 - 9.2L). he median daily increase in the luid balance after recovery from shock was 0.64 L/day.
DISCUSSION
Our main inding on luid administration in patients with septic shock after a median of ive days on vasopressors, considering the cumulative luid balance during shock, was that they had a large accumulated luid
balance. In addition, after weaning from vasopressors, the luid balance continued to accumulate by a median of 0.64L per day. he presence of a higher positive luid balance during the shock period and at the end of seven days was associated with a more prolonged length of stay in the ICU and hospital.
Many studies have associated more positive luid balances with worse outcomes.(15-21) Boyd et al. conducted
Other authors reported correlations between higher luid
balance and death in patients with ARDS.(18-20) Patients
who had an increment of less than 1L of luid by 36 hours had a better rate of survival, spent less time on the ventilator and had fewer days of hospitalization than other patients.(20) Alsous et al.(21) demonstrated, in a retrospective
study of septic shock patients, that a negative luid balance achieved in any of the irst three days after admission is associated with better survival rates.
During the ICU stay, the degree of intravascular volume deicit in septic patients varies because of venodilation and continuous capillary leakage. In addition to initial hemodynamic resuscitation with luids, targeting a CVP of 8 - 12cmH2O, additional luids are given on a daily basis for various reasons, including hypotension, luid challenges, and dilutional and maintenance luids, despite the presence of a positive luid balance or even anasarca.(22) he duration of
shock is important to determining the degree of accumulated luid balance; never the less, even after weaning from vasopressors, a positive daily luid balance is common.
We found that ive days was the median time to recover from septic shock. Recovery from septic shock depends on various factors, such as the number of organ systems afected, time to efective treatment, age and comorbidities. Studies in septic shock patients do not often publish the length of time in shock. Roman-Marchant et al.(23) reported a duration of shock of nearly 42 hours in
patients diagnosed with septic shock in the irst 24 hours of ICU admission, and there was an estimated duration of shock of 93 hours for ICU patients who developed shock later in the ICU; the outcome was better in the former patients. Studies suggest that in patients without refractory hypotension, the cumulative vasopressor load is independently associated with mortality.(24)
Initially, considering the analysis of the luid balance during shock period, we observed higher CVP and MAP values in Group 2. his group also received more diuretics and dobutamine. he urea level decreased signiicantly from days 2 and 3 to day 7 in Group 2, but not in Group 1, which may be a sign of hemodilution. Although we cannot conirm this, it is possible that there may have been more patients with signs of pulmonary congestion or myocardial dysfunction in this group. Boyd et al. demonstrated that CVP is only correlated with luid balance in the irst 12 hours.(15) After this period, it is not
a reliable marker of volemia.(15,25)
Table 4 - Outcomes in Groups 1 and 2
Group 1 N = 20
Group 2 N = 20
Number of complications 45 47
Major complications
Septic shock/new episode of sepsis 9 (45) 10 (50)
Nosocomial infection 11 (55) 15 (75)
Arrhythmia 1 (5) 0 (0)
Acute kidney injury 18 (90) 12 (60)
Dialysis patients 6 (30) 6 (30)
ARDS 2 (10) 4 (20)
Others 4 (20) 9 (45)
Patients with major complications 14 (70) 17 (85)
Complications per patient 3.2 2.7
Length of ICU stay (days) 11 [7.7 - 20.3] 21 [13 - 30.5]* Length of hospital stay (days) 16.5 [11 - 22.5] 29 [17 - 36.5]*
Ventilator-free (days) 3 [0 - 8] 2 [0 - 10]
Mortality rate 7 (35.0) 9 (45.0)
Group 1: fluid balance at day 1 ≤ 4.4L; Group 2: fluid balance at day 1 > 4.4L. ARDS - acute respiratory distress syndrome; ICU - intensive care unit. The values are expressed as absolute value, and percentage, or median (range) [25% - 75%]. * p < 0.05.
Figure 2 - Seven-day cumulative fluid balance after recovery from shock (in liters). The values are presented as the mean (standard error). ANOVA: p < 0.0001.
the randomized controlled Vasopressin in Septic Shock
Trial.(15) hey found that a more positive luid balance
Compared with patients in Group 1, patients in Group 2 had signiicantly lower urea levels and higher diuresis volumes on the 7th day. he creatinine levels were
higher in Group 1, but this diference was not statistically signiicant. Fluids given in excess may increase diuresis, but there is no evidence suggesting that this increase improves the renal recovery or prognosis. In fact, a positive luid
balance may be observed because of renal failure.(26) he
Fluid and Catheter Treatment Trial (FACTT)(27) showed
that luid restriction after recovery from shock was not associated with the increased development of acute renal failure. Van Biesen et al.(28) demonstrated that the liberal
use of luids in the irst 3 days of treatment for acute renal failure, leading to a positive luid balance, fails to improve renal function, while worsening lung function.
In the adult ICU, weight is often neglected with respect to an accurate calculation of maintenance luid
requirements.(29) Patients with very diferent weights are
given similar luid volumes. Despite growing evidence that a positive accumulated luid balance correlates with worse outcomes, there is no standardization for luid administration beyond the initial resuscitation phase, which is when myocardial performance and renal function may be most impaired. It would be advantageous for patients to be managed with supportive luid therapy that restores the physiological status.(30) Although this is intuitively obvious,
it is very diicult to achieve in clinical practice.(29) Our
therapeutic approach tends to result in the administration of larger quantities of liquid to patients with a low body weight than to those with a greater weight.(28)
In the early phase of sepsis, recommendations for therapeutic luid management have been proposed to guide luid resuscitation and are widely accepted. Frequently, luids are liberally infused during this phase. However, after initial monitoring, management and stabilization of MAP with vasopressors, further luids are often given based on the subjective data from clinical examination, urine output, and measurements of ventricular illing pressures.(1) It is necessary to change the behavior to more
individualized prescriptions of luids. In the presence of a new episode of hypotension or signs of hypovolemia, use of dynamic predictors of luid responsiveness may be safer and help guide luid administration with a lower risk of luid overload.(31) When the risks associated with the extra
luid volume of a standard luid challenge are high, such as in patients with oliguria, ventricular dysfunction or acute lung injury/ARDS, the use of echo-guided resuscitation, passive leg raising, mini-luid challenges, and/or dynamic predictors of luid responsiveness may be more efective and safe methods of guiding luid resuscitation.
he most important limitation of the present study is the small sample size. In addition, it is possible that luid balance recordings are inaccurate. Staf shortages or lack of training may lead to inadequate recordings. For these reasons, the use of luid balance charts with cumulative input and output is being debated, and their
use is questioned.(32) Another limitation of the study is
the consideration of the cumulative luid balance without considering the time to recovery from shock, which will change the mean daily luid balance. An additional limitation is the absence of regression logistic to determine the predictive variables for receiving higher luid levels that correlate with a more prolonged length of stay in the ICU or in the hospital and complications. We only included those patients who survived until day 7, which might have biased our results.
On the other hand, a very important aspect of our study is establishing that the luid balance in the period after recovery from septic shock continued to accumulate by a median of 0.64L per day. To the best of our knowledge, there are no reports on the luid balance in this phase. In addition, this is very important clinical information for preventing adverse events related to excess luids and guiding future studies. In addition, sepsis syndrome is very prevalent and better management could help many patients in our ICUs.
CONCLUSION
Objetivo: Avaliar o balanço hídrico acumulado durante o período do choque e determinar o que ocorre com ele nos 7 dias que se seguem à reversão do choque.
Métodos: Estudo prospectivo e observacional, realizado em pacientes com choque séptico. Foram incluídos pacientes com pressão arterial média ≥ 65mmHg e lactato < 2,0mEq/L desmamados há menos de 12 horas do uso de vasopressores, sendo esse dia considerado o Dia 1. O balanço hídrico diário foi registrado por 7 dias após recuperação do choque. Os pacientes foram divididos em dois grupos, segundo a mediana da coorte para o balanço hídrico acumulado durante o período do choque: Grupo 1 ≤ 4,4L (n = 20) e Grupo 2 > 4,4L (n = 20).
Resultados: Inscrevemos, neste estudo, um total de 40
pacientes. No Dia 1 do estudo, o balanço hídrico acumulado era de 1,1 [0,6 - 3,4] L no Grupo 1 e 9,0 [6,7 - 13,8] L no Grupo
2. No Dia 7 do estudo, o balanço hídrico acumulado era de 8,0 [4,5 - 12,4] L no Grupo 1 e 14,7 [12,7 - 20,6] L no Grupo 2 (p < 0,001 para ambos). A seguir, após a recuperação do choque, o balanço hídrico continuou a aumentar em ambos os grupos. Em comparação ao Grupo 1, o Grupo 2 teve um tempo mais longo de permanência na unidade de terapia intensiva e no hospital.
Conclusão: São frequentemente observados balanços hídricos positivos em pacientes com choque séptico, o que pode estar relacionado a desfechos piores. Durante o período do choque, mesmo que o balanço hídrico fosse previamente positivo, este se torna ainda mais positivo. Após a recuperação do choque, o balanço hídrico continua a aumentar. Esse grupo com um balanço hídrico mais positivo permaneceu por mais tempo na unidade de terapia intensiva e no hospital.
RESUMO
Descritores: Sepse; Choque séptico; Hidratação; Equilíbrio hidroeletrolítico
REFERENCES
1. Durairaj L, Schmidt GA. Fluid therapy in resuscitated sepsis: less is more. Chest. 2008;133(1):252-63. Review.
2. De Backer D, Creteur J, Preiser JC, Dubois MJ, Vincent JL. Microvascular blood flow is altered in patients with sepsis. Am J Respir Crit Care Med. 2002;166(1):98-104.
3. Réa-Neto A, Rezende E, Mendes CL, David CM, Dias FS, Schettino G, et al. Consenso brasileiro de monitorização e suporte hemodinâmico - Parte IV: mo-nitorização da perfusão tecidual. Rev Bras Ter Intensiva. 2006;18(2):154-60. 4. Trzeciak S, Dellinger RP, Parrillo JE, Gugliemi M, Bajaj J Abate NL, Arnold
RC, Colilla S, Zanotti S, Hollenberg SM; Microcirculatory Alterations in Resuscitation and Shock Investigators. Early microcirculatory perfusion derangements in patients with severe sepsis and septic shock: relationship to hemodynamics, oxygen transport, and survival. Ann Emerg Med. 2007;49(1):88-98, 98. e1-2.
5. Rivers E, Nguyen B, Havstad S, Ressler J, Muzzin A, Knoblich B, Peterson E, Tomlanovich M; Early Goal-Directed Therapy Collaborative Group. Early goal-directed therapy in the treatment of severe sepsis and septic shock. N Engl J Med. 2001;345(19):1368-77.
6. Smith SH, Perner A. Higher vs. lower fluid volume for septic shock: clinical characteristics and outcome in unselected patients in a prospective, multicenter cohort. Crit Care. 2012;16(3):R76.
7. Holte K, Sharrock NE, Kehlet H. Pathophysiology and clinical implications of perioperative fluid excess. Br J Anaesth. 2002;89(4):622-32. Review. 8. Garrido Adel P, Cruz RJ Jr, Poli de Figueiredo LF, Rocha e Silva M. Small
volume of hypertonic saline as the initial fluid replacement in experimental hypodynamic sepsis. Crit Care. 2006;10(2):R62.
9. Singer M. The key advance in the treatment of sepsis in the last 10 years... doing less. Crit Care. 2006;10(1):122.
10. Levy MM, Fink MP, Marshall JC, Abraham E, Angus D, Cook D, Cohen J, Opal SM, Vincent JL, Ramsay G; SCCM/ESICM/ACCP/ATS/SIS. 2001 SCCM/ESICM/ACCP/ATS/SIS International Sepsis Definitions Conference. Crit Care Med. 2003;31(4):1250-6. Review.
11. Knaus WA, Draper EA, Wagner DP, Zimmerman JE. APACHE II: a severity of disease classification system. Crit Care Med. 1985;13(10):818-29. 12. Vincent JL, Moreno R, Takala J, Willatts S, De Mendonça A, Bruining
H, et al. The SOFA (Sepsis-related Organ Failure Assessment) score to describe organ dysfunction/failure. On behalf of the Working Group on Sepsis-Related Problems of the European Society of Intensive Care Medicine. Intensive Care Med. 1996;22(7):707-10.
13. Levy CE. Manual de microbiologia clínica para o controle de infecção em serviços de saúde. Brasília: Editora Agência Nacional de Vigilância Sanitária; 2004.
14. Mehta RL, Kellum JA, Shah SV, Molitoris BA, Ronco C, Warnock DG, Levin A; Acute Kidney Injury Network. Acute Kidney Injury Network: report of an initiative to improve outcomes in acute kidney injury. Crit Care. 2007;11(2):R31.
15. Boyd JH, Forbes J, Nakada TA, Walley KR, Russel JA. Fluid resuscitation in septic shock: a positive fluid balance and elevated central venous pressure are associated with increased mortality. Crit Care Med. 2011;39(2):259-65. 16. Russell JA, Walley KR, Singer J, Gordon AC, Hébert PC, Cooper DJ,
Holmes CL, Mehta S, Granton JT, Storms MM, Cook DJ, Presneill JJ, Ayers D; VASST Investigators. Vasopressin versus norepinephrine infusion in patients with septic shock. N Engl J Med. 2008;358(9):877-87. 17. Vincent JL, Sakr Y, Sprung CL, Ranieri VM, Reinhart K, Gerlach H, Moreno
R, Carlet J, Le Gall JR, Payen D; Sepsis Occurrence in Acutely Ill Patients Investigators. Sepsis in European intensive care units: results of the SOAP study. Crit Care Med. 2006;34(2):344-53.
18. Simmons RS, Berdine GG, Seidenfeld JJ, Prihoda TJ, Harris GD, Smith JD, et al. Fluid balance and the adult respiratory distress syndrome. Am Rev Respir Dis. 1987;135(4):924-9.
19. Sakka SG, Klein M, Reinhart K, Meier-Hellmann A. Prognostic value of extravascular lung water in critically ill patients. Chest. 2002;122(6):2080-6. 20. Shuller D, Mitchell JP, Calandrino FS, Shuster DP. Fluid balance during
pulmonary edema. Is fluid gain a marker or a cause of poor outcome? Chest. 1991;100(4):1068-75.
21. Alsous F, Khamiees M, De Girolamo A, Amoateng-Adjepong Y, Manthous CA. Negative fluid balance predicts survival in patients with septic shock: a retrospective pilot study. Chest. 2000;117(6):1749-54.
22. Dellinger RP, Levy MM, Carlet JM, Bion J, Parker MM, Jaeschke R, et al. Surviving Sepsis Campaign: international guidelines for management of severe sepsis and septic shock: 2008. Intensive Care Med. 2008;34(1):17-60. Erratum in Intensive Care Med. 2008;34(4):783-5. 23. Roman-Marchant O, Orellana-Jimenez CE, De Backer D, Melot C,
Vincent JL. Septic shock of early or late onset: does it matter? Chest. 2004;126(1):173-8.
24. Takala J. Should we target blood pressure in sepsis? Crit Care Med. 2010;38(10 Suppl):S613-9.
26. Dirkes S. Acute Kidney Injury: not just acute renal failure anymore? Crit Care Nurse. 2011;31(1):37-49; quiz 50.
27. National Heart, Lung, and Blood Institute Acute Respiratory Distress Syndrome (ARDS) Clinical Trials Network, Wiedemann HP, Wheeler AP, Bernard GR, Thompson BT, Hayden D, de Boisblanc B, et al. Comparison of two fluid-management strategies in acute lung injury. N Engl J Med.2006;354(24):2564-75.
28. Van Biesen W, Yegenaga I, Vanholder R, Verbeke F, Hoste E, Colardyn F, et al. Relationship between fluid status and its management on acuterenal failure (ARF) in intensive care unit (ICU) patients with sepsis: a prospective analysis. J Nephrol. 2005;18(1):54-60.
29. Vazquez AR, Masevicius FD, Giannoni R, Dubin A. Fluids in the postoperative period: effects of lack of adjustment to body weight. Rev Bras Ter Intensiva. 2011;23(2):170-5.
30. Varon J, Fromm RE Jr. Fluid balance in sepsis: are we ready for a negative balance? Chest. 2000;117(6):1535-6.
31. Lobo SM, de Oliveira NE. Clinical review: What are the best hemodynamic targets for noncardiac surgical patients? Crit Care. 2013;17(2):210. 32. Perren A, Markmann M, Merlani G, Marone C, Merlani P. Fluid balance