*Correspondence: Swati Changdeo Jagdale. Department of Pharmaceutics, MAEER’s Maharashtra Institute of Pharmacy, S.No 124, MIT Campus, Kothrud, Pune- 411 038, Maharashtra, India. E-mail: [email protected]
A
vol. 48, n. 1, jan./mar., 2012
Solubility enhancement, physicochemical characterization and
formulation of fast-dissolving tablet of nifedipine-betacyclodextrin
complexes
Swati Changdeo Jagdale
1,*, Vinayak Narhari Jadhav
1, Aniruddha Rajaram Chabukswar
2,
Bhanudas Shankar Kuchekar
21Department of Pharmaceutics, MAEER’s Maharashtra Institute of Pharmacy, Maharashtra, India, 2Department of Pharmaceutical Chemistry, MAEER’s Maharashtra Institute of Pharmacy, Maharashtra, India
The main objective of the study was to enhance the dissolution of nifedipine, a poorly water soluble drug by betacyclodextrin complexation and to study the effect of the preparation method on the in vitro dissolution proile. The stoichiometric ratio determined by phase solubility analysis for inclusion complexation of nifedipine with β-cyclodextrin was 1:1. Binary complex was prepared by different methods and was further characterized using XRD, DSC and FT-IR. A saturation solubility study was carried out to evaluate the increase in solubility of nifedipine. The optimized complex was formulated into fast-dissolving tablets by using the superdisintegrants Doshion P544, pregelatinized starch, crospovidone, sodium starch glycolate and croscarmellose sodium by direct compression. Tablets were evaluated for friability, hardness, weight variation, disintegration and in vitro dissolution. Tablets showed an enhanced dissolution rate compared to pure nifedipine.
Uniterms: Fast-dissolving tablets. Nifedipine/dissolution. β-ciclodextrin/complexation. Superdisintegrants.
Este estudo teve por objetivo principal incrementar a dissolução do nifedipino, fármaco pouco solúvel em água, por meio de sua complexação com β-ciclodextrina e estudar o efeito do método de preparação sobre o peril de dissolução in vitro. A razão estequiométrica, determinada por ensaio de solubilidade de fase, para a complexação de nifedipino por inclusão em β-ciclodextrina foi 1:1. O complexo binário foi preparado por diferentes métodos, sendo caracterizado utilizando-se difratometria de raios X (XRD), calorimetria diferencial de varredura (DSC) e espectroscopia no infravermelho com transformada de Fourier (FT-IR). Realizou-se estudo de solubilidade de saturação para avaliar o incremento da solubilidade do nifedipino. O complexo otimizado foi formulado em comprimidos de dissolução rápida preparados por compressão direta, nos quais se utilizaram os superdesintegrantes Doshion P544, amido pré-gelatinizado, crospovidona, amidoglicolato de sódio e croscarmelose sódica. Os comprimidos, que foram avaliados quanto à friabilidade, dureza, variação de peso, desintegração e dissolução in vitro, apresentaram taxa de dissolução superior à do nifedipino pura.
Unitermos: Comprimidos/de dissolução rápida. Nifedipino/dissolução. β-ciclodextrina/complexação. Superdesintegrantes.
INTRODUCTION
Nifedipine is an oral calcium-channel blocking agent, widely used in the treatment of angina pectoris and hypertension. Nifedipine is a poorly water-soluble
drug and its oral bioavailability is very low. Diseases like angina, asthma, epilepsy etc. require immediate drug re-sponse to manage the disease condition. Improvement of the aqueous solubility of poorly water-soluble drugs is one of the important factors for the enhancement of absorption and obtaining adequate oral bioavailability (Hiroyuki et al., 2009).
organic compounds, by the formation of an inclusion complex between the host cyclodextrin molecules and guest molecules. The resulting noncovalent inclusions or
host-guest complexes are of current scientiic and techno -logical interest for their peculiar physical, chemical and biological properties. Such noncovalent associations can actually improve the guest’s water solubility, bioavail-ability and stbioavail-ability, as well as regulate the release of the guest molecules (Chao et al., 2008).
The dissolution of a drug can also be influenced by disintegration time of tablets. Faster disintegration of
tablets delivers a ine suspension of drug particles result -ing in a higher surface area and faster dissolution. Most commonly used methods to prepare fast dissolving tablets are; freeze-drying, tablet moulding and direct compres-sion methods. Lyophilized tablets possess a very porous structure, which causes quick penetration of saliva into the pores when placed in the oral cavity. Moulded tablets dissolve completely and rapidly. However lack of strength and taste masking are of great concern. Main advantages of direct compression are low manufacturing cost and high mechanical integrity of tablets. Therefore, direct compression appears to be better option for manufacturing of tablets. Fast disintegrating tablets prepared by the direct compression method, in general, are based on the action established by various superdisintegrants. The effect of functionality differences in superdisintegrants on tablet disintegration has been previously studied (Setty, 2008).
MATERIAL AND METHODS
Material
Nifedipine was a generous gift from Alkem Lab (Mumbai). The drug was stored in an amber glass con-tainer wrapped with aluminium foil and kept in a refrig-erator at 5–7 °C. The complexing agent betacyclodextrin
(BCD) was purchased from Gangwal chemicals, Mumbai.
Microcrystalline cellulose (MCC), mannitol, aspartame,
magnesium stearate, orange lavor, pregelatinized starch,
sodium starch glycolate, crospovidone, Doshion P 544
and croscarmellose sodium were procured from SD ine
chemicals, Mumbai. All other chemicals and solvents used were of pharmaceutical and analytical grade. Double distilled water was used throughout the study for all the experimental procedures.
Phase solubility study
Phase solubility studies were carried out at room temperature, in triplicate and according to the method
reported by Higuchi and Connors (Higuchi, 1965). An excess amount of nifedipine was added to double distilled
water containing various concentrations of β-CD (0.02-0.1 M) in a series of stoppered conical lasks and shaken for 48 h on a rotary lask shaker. The suspensions were
filtered through Whatman filter paper and assayed for nifedipine using a UV spectrophotometer (Varian Cary 100, Australia) at 238 nm against a blank prepared using
the same concentration of β-CD in double distilled water.
Preparation of nifedipine: β-CD complexes [1:1 Molar ratio]
The solid complexes of nifedipine and β-CD (1:1
molar ratio) were prepared by the following
method-Kneading method (Kn)
Drug and β-CD was triturated in a mortar with a
small volume of water-methanol solution. The thick slurry was kneaded for 45 min and then dried at 40 0C. Dried
mass was pulverized and sieved through a (#100) mesh (Nalluri et al., 2005).
Coevaporation method (COE)
The aq. solution of β-CD was added to an alcoholic
solution of drug. The resulting mixture was stirred for 1 hr and evaporated at a temp of 450C until dry. The dried
mass was pulverized and sieved through a (#100) mesh (Nalluri et al., 2005).
Co-grounding (COG)
Drug was triturated with a minimal quantity of
methanol in a glass mortar until dissolved. β-CD was then
added and the suspension triturated rapidly at room tem-perature until solvent had evaporated (Friedrich, 2005).
Freeze –Drying Method (FD)
Physical mixtures of drug and β-CD at a molar
ratio of 1:1 were added to 500 ml double distilled water and stirred for 5 days. The suspension was freeze-dried (ilshin® freeze Dryer), and the freeze-dried complex thus produced was pulverized and sieved through a (<38µm) mesh (Tsinontides et al., 2004).
Melting method (MELT)
drug- β-CD complex. The drug- β-CD ratio (1:1 Molar)
was accurately weighed, mixed in s crucible, and the mix-ture kept for melting in a water bath with constant stirring. The mixture was cooled slowly at room temperature. The
product was placed in desiccators. The solidiied product
was transferred to a clean mortar, triturated and passed through sieves no.16 and 20 (Van et al., 1998).
Physical mixture (PM)
The physical mixtures of nifedipine and β-CD [1:1
molar ratio] were obtained by mixing pulverized powder (#100) together in pestle and mortar (Nalluri et al., 2005).
Spray Drying method (SPD)
A mixture of drug and β-CD was dissolved in 250
ml of water. The resultant solution was spray dried using a spray dryer. The spray drying was done under the
fol-lowing sets of conditions; air low rate at 400 Nl/h, spray
nozzle with a diameter 0.7 mm under an atomization pres-sure of 2 kg/cm2 with a feed rate of 4 mL/min. The inlet
temperature was kept at 120 °C and out let temperature at 90 °C ± 2 °C. The vacuum in the system was 60 mmWc
and the aspiration rate was 40 m Bar. The product thus
obtained was collected, packed, doubly wrapped in alumi-num foil and stored in a desiccator until further use (Patil et al., 2010).
Evaluation of solid complexes
Determination of drug content
Drug: β-CD complex equivalent to 10 mg of drug was stirred with 100ml of methanol for 60 minutes.
Sub-sequently, the solution was iltered and treated as stock solution containing 100 μg/mL drug. From this stock solution a concentration of 10 μg/mL was prepared and
the drug content determined using the calibration curve of pure drug in methanol, analyzed spectrophotometrically at 238 nm using methanol as the blank (Shirsand, 2010).
Saturation solubility studies
A saturation solubility study was carried out to deter-mine increase in the solubility of pure nifedipine compared with the PM and inclusion complexes. Excess amount of the drug, PM and inclusion complexes were added to the 250 mL conical flasks containing 25 mL of double
distilled water. The sealed lasks were shaken for 24 h at
room temperature followed by equilibrium for three days.
Aliquots were then withdrawn through Whatman ilter
paper. The concentration of nifedipine was determined by
UV spectrophotometer at 238 nm (Vanshiv, 2008).
Characterization of nifedipine:β-CD (1:1) complexes
UV spectroscopic study
Complex formation between nifedipine and CD was studied by the UV spectroscopic method. 10mg amounts of nifedipine were weighed accurately and dissolved in 100ml of methanol, diluted suitably and spectra of drug recorded at 238 nm. The same method was used only nifedipine - CD complex equivalent to 10 mg of nifedip-ine were weighed accurately and dissolved in 100 mL of methanol, diluted suitably and spectra of complexes recorded at 238 nm. The change in the absorbance of drug in the complexes was recorded.
Fourier Transform Infrared spectrophotometry [FT-IR]
FT-IR has been employed as a useful tool to identify drug excipient interaction. Samples were analyzed by the potassium bromide pellet method in an IR spectropho-tometer (Varian, Australia) in the region from 4000 to 400 cm-1. Complex formation was evaluated by comparing
the IR spectra of the solid complex and that of the drug.
Powder X-ray Diffractometry [PXRD]
The powder X-ray diffraction technique has been extensively utilized along with DSC to study the
interac-tion between drug and β-CD . The diffracinterac-tion studies were carried out on a powder X-ray diffractometer
(STOE-STADI-P). The samples were rotated during data collec-tion to reduce orientacollec-tion effects. PXRD patterns of solid
complex, pure drug, and β-CD were recorded between 2θ = 5 to 50° at 40 kV and 30 mA.
Differential Scanning Calorimetry [DSC]
Differential scanning calorimetry (DSC) has been one of the most widely used calorimetric techniques to
study the solid state interaction of drug with β-CD (Ra -mana et al.,2008). Samples of the solid complexes, pure
drug, and β-CD were taken in lat-bottomed aluminium
pans and heated over a temperature range of 25 to 300 °C at a constant rate of 10°/min with purging of nitrogen (50 ml/min) using alumina as a reference standard in a differential scanning calorimeter (DSC-7, Perkin Elmer).
In-vitro dissolution studies
Drug release studies were performed in triplicate at 37 ± 0.5 0C employing USP apparatus II at 75 rpm. The
Dissolution studies were performed on pure drug (10 mg) and the complexes containing an equivalent amount of the drug. Aliquots of the periodically withdrawn samples (5 mL) were analyzed spectrophotometrically at 238 nm, and replaced with an equal volume of plain dissolution medium (Naveen, 2007).
Formulation of tablets
Freeze-dried complex was selected for the formula-tion of tablets. Tablets containing 42.8 mg of drug:β-CD freeze dried complex equivalent to 10 mg of drug were prepared by the direct compression method and the vari-ous formulae used in the study are shown in Table I. The drug, diluents, superdisintegrant and sweetener were
passed through sieve ≠ 40. All the above ingredients were
properly mixed together (in a polybag). Magnesium
stea-rate was passed through sieve ≠ 80, mixed, and blended
with the initial mixture in a polybag. The powder blend was compressed into tablets on an 8-station Rotary Tablet Machine Minipress-II (Rimek Ltd.). The weight of tablets in each batch was kept constant (Setty, 2008).
Evaluation of fast-dissolving tablets
Evaluation of powder blend
The powder blend was evaluated for low proper
-ties. Different tests carried out included bulk density, tapped density, compressibility index, and Hausner ratio (Lachman, 1991).
(1)
(2)
(3)
(4)
Evaluation of tablets
Hardness of the tablets was evaluated using a Mon-santo hardness tester. The friability of tablets for each batch was determined using an automated USP Roche friabilator. The Tablets were subjected to tests for uni-formity of drug content, and uniuni-formity of mass of single dose preparation as per US Pharmacopeia (USP, 2009).
In vitro disintegration, wetting time and water
absorption ratio studies
For determination of in vitro disintegration time (D.T.), one tablet was placed in a beaker containing 10ml of phosphate buffer at pH 6.8 and the time required for complete dissolution (with mild shaking) was measured
(Kimura, 1992). On the other hand, the wetting time was
measured as follows: a sample of the final tablet was placed in a petri dish (10 cm in diameter) containing 10 mL
TABLE I - Formulae used in the preparation of tablets
Ingredients (mg) Control DO I DO II DO III PGS I PGS II PGS III CRP I CRP II CRP III SSG I SSG II SSG III CCS I CCS II CCS III Drug : CD
Complex
42.8 42.8 42.8 42.8 42.8 42.8 42.8 42.8 42.8 42.8 42.8 42.8 42.8 42.8 42.8 42.8 MCC PH 102 83.2 83.2 83.2 83.2 83.2 83.2 83.2 83.2 83.2 83.2 83.2 83.2 83.2 83.2 83.2 83.2 Mannitol 120 104.4 99.2 94 104.4 99.2 94 104.4 99.2 94 104.4 99.2 94 104.4 99.2 94
Doshion P544 - 15.6 20.8 26.0 - - -
-Crospovidone - - - - 15.6 20.8 26.0 - - -
-Croscarmellose Sodium
- - - - 15.6 20.8 26.0
Pregelatinized starch
- - - - 15.6 20.8 26.0 - - -
-Sodium starch glycolate
- - - - 15.6 20.8 26.0 - -
-Aspartame 5 5 5 5 5 5 5 5 5 5 5 5 5 5 5 5
Magnesium stearate
4 4 4 4 4 4 4 4 4 4 4 4 4 4 4 4
Orange Flavor 5 5 5 5 5 5 5 5 5 5 5 5 5 5 5 5
Total ( mg) 260 260 260 260 260 260 260 260 260 260 260 260 260 260 260 260
of water at room temperature. The wetting time is the period necessary for complete wetting of the tablet. The wetted tablet was then weighed. Water absorption ratio, R, was determined according to the following equation:
(5)
where Wa and Wb are the weights before and after water
absorption, respectively (Shirsand et al., 2008).
In vitro dissolution
In vitro dissolution studies of fast-dissolving tablets were performed by using an USP type II apparatus as
speciied in the USP at 75 rpm, using dissolution media
(distilled water/ phosphate buffer of pH 6.8) maintained at 37±0.5 0C. Aliquots of dissolution medium were with-drawn at speciic time intervals and iltered. Absorption of iltered solution was checked by UV spectroscopy, and
drug content was determined from standard calibration curves. The dissolution rate was studied for all formula-tions designed (Kuchekar, 2001).
Assay method
Twenty tablets were weighed accurately and pow-dered. Tablet powder equivalent to 10 mg of drug was stirred with 100 mL of methanol for 60 minutes, then the
solution was iltered and treated as stock solution con
-taining 100 μg/mL drug. From this stock solution, further
dilutions were done for each formulation. Absorbances were measured and the concentration of drug in the tablet determined using the calibration curve of pure drug in methanol, analyzed spectrophotometrically at 238 nm using methanol as the blank.
(6)
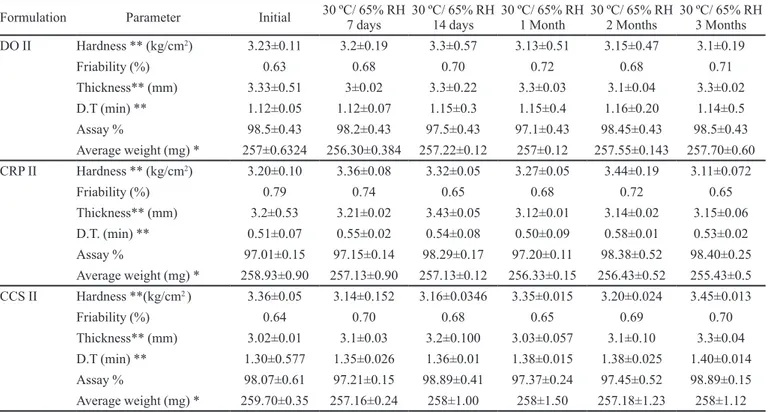
Stability testing
Temperature dependent stability studies were
car-ried out on the optimized batches including DO II, CRP II and CCS II. Batches were packed in Alu–Alu pouches
and stored under the following conditions for a period as prescribed by ICH guidelines for accelerated studies in stability chambers (Thermolab).
(i) 30 ± 2 o C and RH 65 % ± 5%
(ii) 40 ± 2 o C and RH 75 % ± 5%
The tablets were withdrawn after a period of 7, 14 days, 1, 2 and 3 months and analyzed for visual defects, hardness, friability, disintegration time, thickness, average weight and percentage assay (Marais, 2003).
Infrared spectroscopy study of tablets
IR studies were carried out using potassium bromide discs. The reference standard was compared with that of the formulation.
Data analysis
Phase-solubility studies
The values of apparent stability constant, Ks, be-tween each drug–carrier combination were computed from
the phase-solubility proiles, as described below:
(7)
The values of Gibbs free energy of transfer, ΔGotr,
of Nifedipine from aqueous solution of the carriers were calculated according to the following relationship:
(8)
Where, So and Ss are the molar solubilities of
nifedip-ine in 1% w/v aqueous solution of the carrier, respectively
(Naveen, 2007).
Dissolution kinetic modelling
The in vitro drug release data was fitted to four models of data treatment for the complexes as follows:
Zero order: (9)
First order: (10)
Higuchi’s model: (11)
Korsmeyer-Peppas model : (12)
Where F is the fraction of drug release, k is the release constant, t is time and n is diffusional coeficient. The value of n is related to the geometrical shape of the delivery system and determines the release mechanism from various polymeric drug deliveries (Jagdale et al., 2010). Kinetic modeling was done using PCP Disso soft-ware (version 3.0).
Dissolution efficiency (DE) studies
The drug release profiles was characterized by
calculating the DE, which is deined as the area under the
dissolution curve up to a certain time t, expressed as a
dissolution at the same time. DE can be calculated by the following equation:
(13)
where y is the percent drug dissolved at time t. A conve-nient quantification of the effect of the carrier on drug dissolution may be obtained by considering log DE/DENIF,
where DE and DENIF are the dissolution eficiencies of the complex and the pure drug, respectively (Cutrignelli et al., 2008). DE was calculated using PCP Disso software (version 3.0).
Similarity factor (f2)
The in vitro release profile of the pure drug was tested under similar conditions to those used for in vitro release testing of the test product. The similarity factor between the two samples (nifedipine and complexes) was determined using the data obtained from the drug release studies. The data were analyzed by the following formula.
(14)
where, n is the number of withdrawal points, Rt is the
percentage reference dissolved at time point t, and Tt is the percentage test product dissolved at time point t. A value
of 100% for f2 suggests that the test and reference proiles
were identical. Values between 50 and 100 indicate that the
dissolution proiles are similar while smaller values imply an increase in dissimilarity between the release proiles
(Jagdale et al., 2009). Similarity factor was calculated using PCP Disso software (version 3.0).
RESULTS AND DISCUSSIONS
Phase solubility analysis
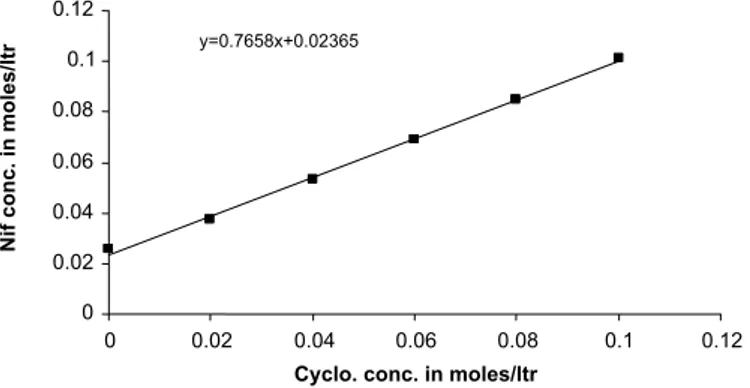
The phase solubility curve of nifedipine in the
pres-ence of β-CD is shown in Figure 1. From this curve, it can
be seen that the solubility of nifedipine increases due to the formation of an inclusion complex between nifedipine and
β-CD. A linear increase in solubility of nifedipine was ob
-served with an increase in concentration of β-CD in water.
The initial linear ascending part of the solubility diagram is generally ascribed to the formation of a 1:1 complex. The phase solubility plot showed an ALtype solubility curve, which indicates that only 1:1 drug-β-CD inclusion complex
was formed in solution. The apparent stability constant (K1:1) for the nifedipine: β-CD complex was calculated from the solubility data and found to be 139.23 M-1.
An indication of the process of transfer of nifedipine
from pure water to aqueous solution of β-CD was obtained from the values of Gibbs free energy change. The values of Gibbs free energy obtained are shown in Table II. ΔGtr°
values were all negative for β-CD at various concentra
-tions, indicating the spontaneous nature of nifedipine solubilization, and decreased with an increase in its con-centration, demonstrating that the reaction became more
favorable as the concentration of β-CD increased.
The negative nature of the Gibbs free energy changes (ΔGtr°) (-5.099, -13.31, -21.30, -27.19, -31.84
and -35.69) for 0.02, 0.04 and 0.06, 0.08, 0.1 moles/ml of water respectively) are indicative of the spontaneity of the process. The endothermic heats of solution further explain the increase in solubility with temperature.
Evaluation complexes
Drug content in drug: β-CD(1:1) complex
Percentage drug content of the complexes are shown
in Table III and found within the range 73 to 91%. The maximum percent drug content was found to be 91.30 %
in the freeze-dried complex.
Saturation solubility study
The saturation solubility data for drug and
com-TABLE II - Gibbs free energy of transfer (ΔGtr°) for solubilization process of nifedipine in aqueous solutions of β-CD at 37 °C.
Moles of β-CD in water ΔGtr° (KJ/mol)
0 -5.099
0.02 -13.31
0.04 -21.30
0.06 -27.19
0.08 31.84
0.1 -35.69
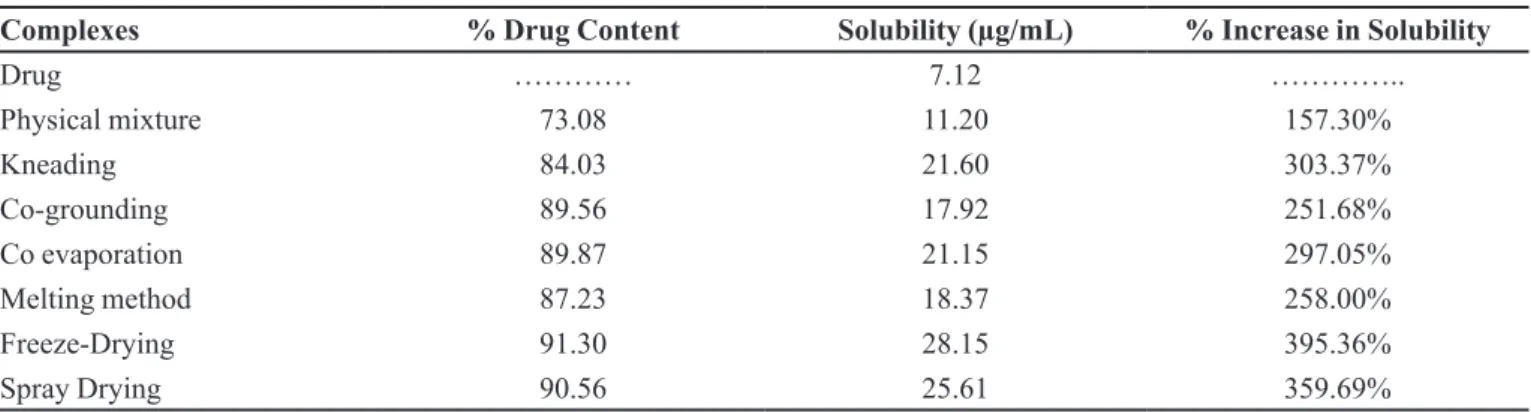
TABLE III - Percentage drug content and saturation solubility of drug: β-CD(1:1) complex
Complexes % Drug Content Solubility (µg/mL) % Increase in Solubility
Drug ………… 7.12 …………..
Physical mixture 73.08 11.20 157.30%
Kneading 84.03 21.60 303.37%
Co-grounding 89.56 17.92 251.68%
Co evaporation 89.87 21.15 297.05%
Melting method 87.23 18.37 258.00%
Freeze-Drying 91.30 28.15 395.36%
Spray Drying 90.56 25.61 359.69%
plexes are given in Table III. The freeze-dried complex shows maximum saturation solubility (28.15 µg/mL).
Characterization of nifedipine: β-CD (1:1) complex
UV spectroscopic study
The UV spectra of Nifedipine solution in the
pres-ence of β-CD is shown in Figure 2 and Figure 3. There was no shift in the λmax of Nifedipine in the presence of β-CD. The spectra of complexes showed a diminution in
FIGURE 2 - Effect of β -CD concentration on UV absorption of nifedipine.
FIGURE 3 - Effect of β -CD concentration on UV absorption of nifedipine.
absorbance at 238 nm. The induced change in absorbance is attributed, primarily, to the formation of an inclusion complex. The changes in peak intensity are assumed to result from changes in the solvent microenvironment upon inclusion of the solute. The observed reduction in peak intensity may result from the transfer of the guest molecule from water to the CD cavity.
FTIR
FTIR spectroscopy has been used to assess the interaction between drug and cyclodextrin molecules in the solid state. Figure 4 illustrates the FT-IR spectra of the samples under study. The chemical interaction between the drug and cyclodextrin often leads to identifiable
changes in the infrared proile of dispersion. The drug
spectrum shows prominent peaks at 3331cm -1, 3101 cm-1,
2931 cm-1, 1689 cm-1, 1624 cm-1, 1528 cm-1, 1380 cm-1,
1121 cm-1 corresponding to aromatic N-H stretching, C-H aromatic stretching, C-H aliphatic stretching, C=O stretching in ester, C=C aromatic, -NO2 , -C-CH3 and
-C-O-ester. The prominent peaks of β-CD are at 3326 cm-1,
2950 cm-1, 1200 cm-1 and 1000 cm-1 corresponding to C-H stretching, C-H stretching, C-C-O asymmetric stretching and OH bending, respectively. It was noted that the ester
carbonyl stretching bend of nifedipine shifted from 1689 down to a lower 1675 cm-1 where this might be attributed
to intermolecular hydrogen bonding between nifedipine
and β-CD. Moreover, the absorption band at 3331 cm-1
ascribed to stretching vibration of the N-H bond in the dihydropyridine ring was broadened, slightly shifted or nearly disappeared in inclusion complex spectra. Thus, IR spectra indicate that the nifedipine molecule is
includ-ed in the β-CD cavity through the dihydropyridine ring. The physical mixture of drug with β-CD (1:1) and drug: β-CD complexes show the prominent peaks of drug, but
X-ray diffractometry [XRD]
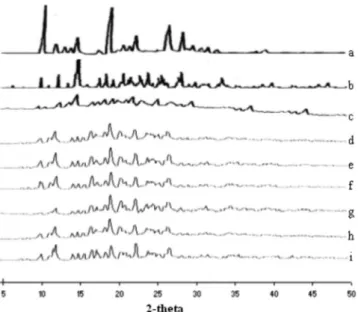
Powder X-ray diffraction spectroscopy has been used to assess the degree of crystallinity of the given
sample. When complexation of drug and β-CD are formed,
the overall number of crystalline structures is reduced and the number of amorphous structures is increased. Thus,
the inal product sample shows fewer, less intense peaks.
This shows that overall crystallinity of complexes is de-creased and due to a more amorphous nature, solubility is increased. XRD patterns are shown in Figure 5. The powder X-ray diffractogram of pure nifedipine showed
numerous distinctive peaks that indicated a high
crystal-linity. β-CD exhibited characteristic peaks at 10.62, 12.46,
15.42, 16.98, 20.94, 22.80 due to its crystalline nature. The diffractograms of complexes were found to be more diffuse compared to drug, while there is no characteristic peak i.e. formation of amorphous solid state (inclusion complex formation).
DSC
DSC enables the quantitative detection of all pro-cesses in which energy is required or produced (i.e., endothermic or exothermic phase transformations). Thermograms for drug and complexes are shown in Fi-gure 6. DSC studies showed that endothermic peaks for
pure nifedipine and β-CD were obtained at 175.1°C and 85.11°C, respectively. The thermogram of drug: β-CD
(1:1) complex showed complete disappearance of the peak of nifedipine and a shift in the endothermic peak of
β-CD. These indings indicate successful complexation with β-CD. Thus, DSC studies conirmed the inclusion complexation of drug with β-CD.
FIGURE 4 - IR spectral analysis of drug (a), β-CD (b), physical mixture (c) kneading method (d), coevaporation method (e), co-grounding (f), spray drying( g), melting method (h), freeze drying (i).
FIGURE 5 - X-Ray Diffraction of pure nifedipine (a); pure β-CD (b); physical mixture (c); coevaporation complex (d); kneading complex (e); cogrounding complex (f); freeze drying complex (g); spray drying complex (h); melting complex (i).
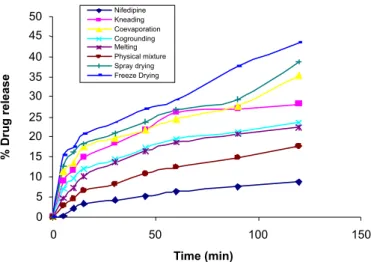
In vitro release profile of complexes
Dissolution proiles of pure nifedipine and complexes
are shown in Figure 7 and Figure 8. It is evident that the complexation technique has improved the dissolution rate of nifedipine to a great extent. From in vitro release study (Fi-gure 7 and Fi(Fi-gure 8), it was found that the complex prepared as 1:1 by the freeze-drying method showed an improve-ment in dissolution behavior compared to drug and other complexes. This might be due to the inclusion complex formation, indicating the improved solubility phenomenon.
Dissolution kinetic modeling
To interpret the release kinetics and mechanism of
drug release from complexes, the coeficient of determina
-FIGURE 7 - % Drug release of drug and its complexes in Distilled Water.
FIGURE 8 - % Drug release of drug and its complexes in Phosphate buffer at pH 6.8.
tion was considered as the main parameter for interpreting the results. The n values of all formulations are as reported in Table IV and Table V. None of the formulations of
com-plexes it a speciic model.
The value of ‘n’ gives an indication of the release mechanism; when n = 1, the release rate is independent of time (zero-order) (case II transport), n = 0.5 for Fickian diffusion and when 0.5 < n <1.0, diffusion and non-Fickian transport are implicated. Lastly, when n > 1.0 super case II transport is apparent (Korsemeyer et al., 1983).
DP60 indicates % drug dissolved in 60 minutes, DP120 % drug dissolved in 120 minutes and DE60 indicates disso-lution eficiency at 60 minutes for nifedipine and its binary
systems with carriers in distilled water/phosphate buffer. T50% indicates the time required for 50% release of drug.
The release kinetic analyses of all formulations in distilled water are as shown in Table IV. The n value for all the formulation was found to be below 0.5 (0.2965 to 0.4814) thus the release was predominantly by diffusion and a non-Fickian transport mechanism. The freeze-dried complex showed an n value of 0.3050 indicating diffusion as the predominant mechanism of drug release. Freeze-dried complex (DE60 = 24.17%) produced the maximum enhance
-ment in dissolution rate. The f2 value of similarity factor indicate that the co-grinding method and melting method proved similar to the release mechanism of the pure drug, with a value greater than 50. For all other formulations, the value of the similarity factor was less than 50, thus dissimi-lar in the release mechanism of drug whereas the dissolution
proile of the drug was better than that of pure nifedipine.
Regression analysis was performed and regression values ‘R2’ were 0.9815 to 0.9977 for different formulations.
The release kinetic analyses of all formulations in phosphate buffer are as shown in Table IV. The n value for all the formulations was found to be below 0.5 (0.2591 to 0.4233) thus the release was predominantly by diffu-sion and a non-Fickian transport mechanism. The freeze-dried complex showed an n value of 0.2793 indicating diffusion as the predominant mechanism of drug release. Freeze-dried complex (DE60 = 33.76%) showed the maxi -mum enhancement in dissolution rate. The f2 value of all
formulations was less than 50, thus dissimilar in release
mechanism of drug whereas the dissolution proile of the
drug was better than that of pure Nifedipine. Regression analysis was performed and regression values ‘R2’ were
0.9716 to 0.9939 for different formulations.
Evaluation of fast-dissolving tablets
TABLE V - Dissolution parameter of complexes in phosphate buffer
Complexes DP T50% %DE Best Fit
mode n R
2 f
2
DP60 DP120 DE60 DE120
Nif 7.7549 10.828 387.09 6.48 9.04 Matrix 0.4233 0.9898
-Kn 34.86166 39.02372 86.05 27.01 33.31 Peppas 0.2591 0.9827 33.01
COE 37.63636 45.78261 79.72 27.01 33.32 Peppas 0.2591 0.9827 29.94
COG 33.083 39.77075 90.68 25.85 32.49 Peppas 0.2869 0.9920 33.83
MELT 29.49012 35.14625 101.72 23.68 29.19 Peppas 0.2668 0.9951 36.95
PM 24.51344 28.63636 122.39 19.57 23.88 Peppas 0.2811 0.9939 43.40
FD 42.68775 55.38735 70.29 33.76 42.08 Peppas 0.2793 0.9842 26.18
SPD 50.40711 37.63636 59.52 29.45 37.71 Peppas 0.2626 0.9716 29.17
TABLE IV - Dissolution parameter of complexes in distilled water
Complexes DP T50%
%DE Best Fit
mode N R
2 f
2
DP60 DP120 DE60 DE120
Nifedipine 6.27 8.6940 478.46 5.55 7.46 Matrix 0.4814 0.9897
---Kn 25.95059 28.0956 115.60 19.12 24.11 Peppas 0.3460 0.9924 41.60
COE 24.52767 35.25296 122.34 20.07 25.49 Peppas 0.3104 0.9855 39.12
COG 19.56166 23.41779 153.37 15.42 19.39 Peppas 0.3387 0.9960 48.54
Melt 18.53715 22.283 161.89 10.84 14.62 Matrix 0.4177 0.9944 50.91
PM 12.48972 17.58024 240.38 9.65 13.23 Matrix 0.4590 0.9977 63.90
FD 29.09881 43.36364 103.12 24.17 31.64 Peppas 0.3050 0.9815 32.98
SPD 26.67273 38.81028 112.48 21.74 27.49 Peppas 0.2965 0.9830 36.67
its saturation solubility and in-vitro dissolution
perfor-mance. Three different superdisintegrants, dosion (DO),
crospovidone(CRP), and croscarmellose sodium (CCS)
with different concentrations (6%, 8%, 10%) were tried
in order to achieve fast dispersion of tablets.
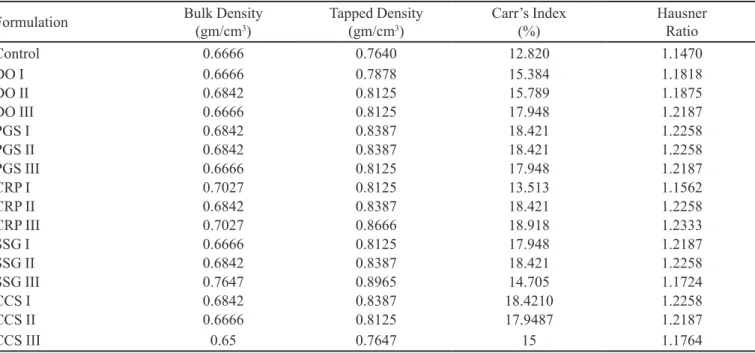
Micromeritic properties of tablet powder were
cal-culated and tabulated in Table VI. Bulk Density, tapped
density, Carr’s index and Hausner Ratio were found to be 0.6774 gm/cm3±0.0170, 0.8111 gm/cm3±0.0324, 16.41
%±2.20, and 1.1971±0.0313, respectively. Hausner Ra
-tio was found to be less than 1.25, evidencing good low.
Carr’s index was in the 12.82-18.91 range; hence was fair to passable.
All the formulations exhibited a yellow color, were
odorless, lat circular in shape and had a smooth surface.
The prepared tablets were evaluated for hardness, friabil-ity, weight variation, thickness, in vitro disintegration time,
water absorption ratio and % assay, with data shown in
Table VII. Hardness and friability of all formulations were within acceptable limits. Hardness of tablets prepared by direct compression was 3.19-3.63 kg/cm2. The friability
of all formulations was found to be less than 1.0 % and
hence the tablets with lower friability do not break dur-ing handldur-ing on machines and or shippdur-ing. The average weight of the fast-dissolving tablets prepared by the direct compression method was 257-259 mg. Thickness of tablet was found to lie within the range 3.16±0.40 mm.
The % drug content of the prepared tablets was in the range 97.01 to 98.55 % per tablet. Low values of stan
-dard (0.15% - 0.61%) deviation in terms of drug content
indicate uniform drug distribution and application of all methods for the preparation of complexes with high con-tent uniformity.
Disintegration time is very important for fast-dissolv-ing tablet with a desired value of less than 3 min (Korse-meyer et al., 1983). Disintegration time of the prepared fast-dissolving tablet was in the range 0.51 to 3.5 min.
Figure 9 and Figure10 show that the formulations
DO II, CRP II and CCS II exhibited maximum release in
TABLE VI - Physical characterization of nifedipine blend
Formulation Bulk Density
(gm/cm3)
Tapped Density
(gm/cm3)
Carr’s Index
(%) Hausner Ratio
Control 0.6666 0.7640 12.820 1.1470
DO I 0.6666 0.7878 15.384 1.1818
DO II 0.6842 0.8125 15.789 1.1875
DO III 0.6666 0.8125 17.948 1.2187
PGS I 0.6842 0.8387 18.421 1.2258
PGS II 0.6842 0.8387 18.421 1.2258
PGS III 0.6666 0.8125 17.948 1.2187
CRP I 0.7027 0.8125 13.513 1.1562
CRP II 0.6842 0.8387 18.421 1.2258
CRP III 0.7027 0.8666 18.918 1.2333
SSG I 0.6666 0.8125 17.948 1.2187
SSG II 0.6842 0.8387 18.421 1.2258
SSG III 0.7647 0.8965 14.705 1.1724
CCS I 0.6842 0.8387 18.4210 1.2258
CCS II 0.6666 0.8125 17.9487 1.2187
CCS III 0.65 0.7647 15 1.1764
TABLE VII - Evaluation of fast-dissolving tablets
Formulation Hardness**
(kg/cm2)
Friability
(%) Thickness** (mm)
D.T (min)**
Average weight (mg) *
Water
absorption ratio % Assay
Control 3.19±0.07 0.70 3.16±0.40 3.5±0.127 257±0.63 168.4±0.1 97.3±0.23
DO I 3.22±0.14 0.76 3.02±0.01 1.55±0.04 257.83±0.98 135.4±0.9 98.28±0.25
DO II 3.23±0.11 0.63 3.33±0.51 1.12±0.02 257±0.6324 124.1±0.2 98.5±0.43 DO III 3.19±0.07 0.72 3.5±0.54 1.25±0.03 257.66±0.81 138.0±1.6 97.2±0.55 PGS I 2.9±1.31 0.76 3.3±0.02 3.2±0.012 255.6±0.529 135.4±0.9 98.28±0.25 PGS II 3.2±1.06 0.63 3.4±0.04 3.10±0.04 255.2±1.058 95.0±1.21 98.07±0.61 PGS III 3.4±0.89 0.72 3.1±0.02 2.15±0.05 256.83±0.59 148.6±0.4 97.45±0.17
CRP I 3.3±0.032 0.78 3.3±0.05 1.60±0.57 258.06±0.70 152.0±0.6 98.59±0.29
CRP II 3.20±0.10 0.79 3.2±0.53 0.51±0.07 258.93±0.90 90.4±0.84 97.01±0.15
CRP III 3.63±0.15 0.62 3.2±0.22 0.72±0.57 259.33±0.57 98.2±0.12 97.12±0.43
SSG I 3.62±0.15 0.75 3.1±0.02 3.34±0.03 257.16±1.04 90.4±0.84 97.01±0.15 SSG II 3.53±0.15 0.82 3.02±0.01 2.4±0.026 256.83±0.76 98.2±0.12 97.12±0.43 SSG III 3.2±0.100 0.85 3.02±0.02 2±0.05 255.5±0.500 122.4±0.2 98.15±0.21
CCS I 3.23±0.15 0.78 3.1±0.02 2.15±0.01 257.66±0.57 122.4±0.2 98.15±0.21
CCS II 3.36±0.05 0.64 3.02±0.01 1.30±0.57 259.70±0.35 95.0±1.21 98.07±0.61
CCS III 3.46±0.01 0.68 3.02±0.02 1.45±0.02 258.43±0.52 148.6±0.4 97.45±0.17
* average ± sd, n = 20, ** average ± sd, n = 6.
Figure 11 shows the effect of superdisintegrant on D.T. Doshion is ion exchange resins. Doshion shows a
decrease in D.T. as concentration increases. Hence 8%
Doshion was selected. Crospovidone shows a decrease in D.T. as concentration increases. This was because CRP exhibits a capillary mechanism of disintegration. When in contact with water it replaces the air absorbed by
par-ticles. This weakens the intermolecular bond and breaks the tablet into smaller particles. As the concentration of CRP increased, the number of capillaries also increased thus increasing the channeling of water. Therefore, the rate of liberation to primary particles increases. Hence,
Stability testing
From the stability data in Table VIII and Table IX
for batches DO II, CRP II and CCS III, it can be concluded that there were no signiicant changes in any parameters, and optimized batches i.e. DO II, CRP II and CCS II are
therefore deemed stable. Hence, this product can be kept for a period of one year or more.
TABLE VIII - Stability testing - i) 30 ± 1 OC and RH 65 % ± 5%
Formulation Parameter Initial 30 ºC/ 65% RH 7 days
30 ºC/ 65% RH 14 days
30 ºC/ 65% RH 1 Month
30 ºC/ 65% RH 2 Months
30 ºC/ 65% RH 3 Months DO II Hardness ** (kg/cm2) 3.23±0.11 3.2±0.19 3.3±0.57 3.13±0.51 3.15±0.47 3.1±0.19
Friability (%) 0.63 0.68 0.70 0.72 0.68 0.71
Thickness** (mm) 3.33±0.51 3±0.02 3.3±0.22 3.3±0.03 3.1±0.04 3.3±0.02
D.T (min) ** 1.12±0.05 1.12±0.07 1.15±0.3 1.15±0.4 1.16±0.20 1.14±0.5 Assay % 98.5±0.43 98.2±0.43 97.5±0.43 97.1±0.43 98.45±0.43 98.5±0.43 Average weight (mg) * 257±0.6324 256.30±0.384 257.22±0.12 257±0.12 257.55±0.143 257.70±0.60
CRP II Hardness ** (kg/cm2) 3.20±0.10 3.36±0.08 3.32±0.05 3.27±0.05 3.44±0.19 3.11±0.072
Friability (%) 0.79 0.74 0.65 0.68 0.72 0.65
Thickness** (mm) 3.2±0.53 3.21±0.02 3.43±0.05 3.12±0.01 3.14±0.02 3.15±0.06
D.T. (min) ** 0.51±0.07 0.55±0.02 0.54±0.08 0.50±0.09 0.58±0.01 0.53±0.02 Assay % 97.01±0.15 97.15±0.14 98.29±0.17 97.20±0.11 98.38±0.52 98.40±0.25 Average weight (mg) * 258.93±0.90 257.13±0.90 257.13±0.12 256.33±0.15 256.43±0.52 255.43±0.5
CCS II Hardness **(kg/cm2 ) 3.36±0.05 3.14±0.152 3.16±0.0346 3.35±0.015 3.20±0.024 3.45±0.013
Friability (%) 0.64 0.70 0.68 0.65 0.69 0.70
Thickness** (mm) 3.02±0.01 3.1±0.03 3.2±0.100 3.03±0.057 3.1±0.10 3.3±0.04
D.T (min) ** 1.30±0.577 1.35±0.026 1.36±0.01 1.38±0.015 1.38±0.025 1.40±0.014 Assay % 98.07±0.61 97.21±0.15 98.89±0.41 97.37±0.24 97.45±0.52 98.89±0.15 Average weight (mg) * 259.70±0.35 257.16±0.24 258±1.00 258±1.50 257.18±1.23 258±1.12 * average ± sd, n = 10, ** average ± sd, n = 6.
FIGURE 9 - % Drug release from tablet in Phosphate buffer at pH 6.8.
FIGURE 10 - % Drug release from tablet in Distilled water.
TABLE IX - Stability testing - ii) 40 ± 2 O C and RH 75 % ± 5%
Formulation Parameter 40 ºC/ 75% RH 7 days
40 ºC/ 75% RH 14 days
40 ºC/ 75% RH 1 Month
40 ºC/ 75% RH 2 Months
40 ºC/ 75% RH 3 Months DO II Hardness ** (kg/cm2 ) 3.23±0.11 3.1±0.19 3.14±0.57 3.24±0.51 3.24±0.47
Friability (%) 0.63 0.65 0.75 0.71 0.70
Thickness** (mm) 3.33±0.51 3.01±0.02 3.2±0.22 3.1±0.03 3.2±0.04
D.T.(min) ** 1.12±0.05 1.12±0.17 1.14±0.2 1.20±0.14 1.24±0.20
Assay % 98.5±0.43 97.2±0.13 98.5±0.13 97.1±0.52 98.15±0.43
Average weight (mg) * 257±0.6324 257.24±0.384 257.34±0.12 258.04±0.12 256.55±0.143
CRP II Hardness ** (kg/cm2 ) 3.20±0.10 3.27±0.08 3.14±0.42 3.27±0.14 3.14±0.19
Friability (%) 0.79 0.84 0.80 0.70 0.75
Thickness** (mm) 3.2±0.53 3.24±0.02 3.13±0.14 3.22±0.07 3.14±0.05
D.T. (min) ** 0.51±0.07 0.58±0.02 0.58±0.08 0.55±0.02 0.57±0.01 Assay % 97.01±0.15 98.15±0.14 97.12±0.15 97.20±0.24 98.38±0.52 Average weight (mg) * 258.93±0.9018 257.87±0.90 256.23±0.64 258.25±0.127 257.12±0.52
CCS II Hardness ** (kg/cm2 ) 3.36±0.05 3.24±0.152 3.17±0.0457 3.27±0.0247 3.25±0.014
Friability (%) 0.64 0.70 0.80 0.75 0.72
Thickness** (mm) 3.02±0.01 3.1±0.03 3.2±0.100 3.13±0.127 3.3±0.26
D.T.(min) ** 1.30±0.577 1.35±0.026 1.34±0.01 1.40±0.015 1.38±0.025 Assay % 98.07±0.61 97.21±0.15 97.27±0.41 98.37±0.25 98.15±0.18 Average weight (mg) * 259.70±0.356 258.16±0.24 257±1.24 256.04±0.4 258.20±0.54 * average ± sd, n = 10, ** average ± sd, n = 6.
FIGURE 12 - I.R of Nifedipine (a), DO II (b), CRP II (c) and CCS II (d).
Infrared Spectroscopy Study of Tablet
From the above spectrum (Figure 12), it can be seen that the major peaks of the drug were unchanged, i.e. there
was no interaction between drug and excipients for DO II,
CRP II or CCS II.
CONCLUSION
dissolution rate helped toward providing rapid onset of ac-tion of the drug. Fast-dissolving tablet also helped toward the enhancement of dissolution rate.
Based on the indings of various tests it can be con -cluded that,
1. Inclusion complexes signiicantly improved disso
-lution proiles.
2. Inclusion complexes of nifedipine produced by different methods exhibited the following order of enhanced solubility: freeze-drying > spray drying > kneading > coevaporation > melting > co-grounding > physical mixture.
3. X- Ray diffraction, differential scanning calorimetric data and IR and UV spectral analysis results
indica-ted no probable interaction between drug and β-CD.
4. The inclusion complexes with cyclodextrin prepared by the freeze-drying method showed highest
solubi-lity (28.15 µg/ ml) and a fast dissolution proile.
5. These investigations demonstrated that it is possible to prepare fast-dissolving tablets by a direct com-pression method.
6. Disintegration time decreased with increased con-centration of superdisintegrants. Formulations of
doshion (8 %), crospovidone (8 %) and croscar
-mellose sodium (8 %) showed faster disintegration
and maximum percent of drug release.
ACKNOWLEDGEMENT
The authors are grateful to the University of Pune, Maharashtra, India for providing financial assistance
(BCUD Project Grant) for the present research work. The
authors are also thankful to the Management of MAEER’s Maharashtra Institute of Pharmacy, Pune.
REFERENCES
CHAO, Y.; ZHENGYU, J.; XUEMING, X.; HAINING, Z.; WANGYANG, S. Preparation and stability of the inclusion complex of astaxanthin with hydroxypropyl-betacyclodextrin. Food Chem., v.109, p.264-268, 2008.
CUTRIGNELLI, A.; LOPEDOTA, A.; TRAPANI, A.; BOGHETICH, G.; FRANCO, M.; DENORA, N.; LAQUINTANA, V.; TRAPANI, G. Relationship between dissolution efficiency of Oxazepam/carrier blends and drug and carrier molecular descriptors using multivariate regression analysis. Int. J. Pharm., v.358, p.60-68, 2008.
FRIEDRICH, H.; NADA, A.; BODMIER, R. Solid state and dissolution rate characterization of co-ground mixtures of nifedipine and hydrophillic carriers. Drug Dev. Ind. Pharm., v.31, p.719-728, 2005.
HIGUCHI, T.; CONNORS, K. Phase solubility techniques. Adv. Anal. Chem. Instr., v.4, p.117-212, 1965.
HIROYUKI, O.; ATSUO, M.; TAKUROU, K.; YUJI, M.; YASUNORI, I.; TAKASHI, S.; SHIGERU, I. Freeze-dried nifedipine-lipid nanoparticles with long-term nano-dispersion stability after reconstitution. Int. J. Pharm., v.377, p.180-184, 2009.
JAGDALE, S.; AGAVEKAR, A.; PANDYA, S.; KUCHEKAR, B.; CHABUKSWAR, A. Formulation and evaluation of gastroretentive drug delivery system of propranolol
hydrochloride. AAPS Pharm. Sci. Tech., v.10, p.1071-1079,
2009.
JAGDALE, S.; KUCHEKAR, B.; CHABUKSWAR, A; MUSALE, V.; JADHAO, M. Preparation and in vitro evaluation of Allopurinol-Gelucire 50/13 solid dispersions. Int. J. Adv. Pharm. Sci., v.1, p.60-67, 2010.
KIMURA, S.; IMAI, T.; OTAGIRI, M. Pharmaceutical evaluation of Ibuprofen syrup containing low molecular weight gelatin. J. Pharm. Sci., v.81, p.141-144, 1992.
KORSEMEYER, R.; GURNY, R.; DOELKER, E.; BURI, P.; PEPPAS, N. Mechanism of Solute release from porous hydrophilic polymers. Int. J. Pharm., v.15, p.25-35, 1983.
KUCHEKAR, B.; ARUMUGAM, V. Fast dissolving tablets. Ind. J. Pharm. Edu., v.35, p.150-154, 2001.
LACHMAN, L.; LIEBERMAN, H.A.; KAING, J.L. The theory and practice of industrial pharmacy. 4.ed. New Delhi: CBS Publication, 1991. p.66-99.
N A L L U R I , B . ; C H O W D A RY, K . ; M U RT H Y, K . ; SATYANARAYANA, V.; HAYMAN, A.; BECKET, G. Inclusion complexation and dissolution properties of nimesulide and meloxicam–hydroxypropyl-b-cyclodextrin binary systems. J. Incl. Phen. Macrocyclic Chem., v.53, p.103-110, 2005.
NAVEEN, A.; KATARE, O.; SINGH, B. Studies on dissolution enhancement and mathematical modeling of drug release of a poorly water-soluble drug using water-soluble carriers. Eur. J. Pharm. Biopharm., v.65, p.26-38, 2007.
PATIL, J.; PANDYA, N.; MARAPUR, S.; SHIRALASHETTI, S. Inluence of method of preparation on physicochemical properties and in vitro drug release proile of nimodipine cyclodextrin inclusion complexes: a comparative study. Int. J. Pharm. Sci., v.2, p.71-81, 2010.
PITHA, J.; MILECKI, J.; FALES, H.; PANNELL, L.; UEKAMA, K. Hydroxypropyl-β-cyclodextrin: preparation and characterization; effects on solubility of drugs. Int. J. Pharm., v.29, p.73-82, 1986.
RAMANA, M.V.; HIMAJA, M.; DUA, K. A new approach: enhancement of solubility of rofecoxib. Asian J. Pharm., v.2, p.96-101, 2008.
SETTY, M.C.; PRASAD, D.; GUPTA, V. Development of fast dispersible aceclofenac tablets: effect of functionality of superdisintegrants. Ind. J. Pharm. Sci., v.70, p.180-185, 2008.
SHIRSAND, S.; SARASIJA, S.; SWAMY, P. Formulation design and optimization of fast dissolving clonazeapm tablet. Ind. J. Pharm. Sci., v.71, p.567-572, 2009.
SHIRSAND, S.; SARASIJA, S.; SWAMY, P.; KUMAR, D.; RAMPURE, M. Design and evaluation of fast dissolving tablets of clonazepam. Ind. J. Pharm. Sci., v.70, p.791-795, 2008.
TSINONTIDES, S.; RAJNAIK, P.; PHAM, D.; HUNKE, W.; PLACEK, J.; REYNOLDS, S. Freeze drying-principles and practice for successful scale up to manufacturing. Int. J. Pharm., v.280, p.1-16, 2004.
UNITED STATES PHARMACOPOEIA. Asian Edition. Rockville: United States Pharmacopeial Convention, 2009. v.1, p.725-726.
VAN, G.; AUGUSTIJNS, P.; BLATON, N.; KINGET, R. Physico-chemical characterization of solid dispersions of temazepam with polyethylene glycol 6000 and PVP K30. Int. J. Pharm., v.164, p.67-80, 1998.
VANSHIV, S.; RAO, R. Physicochemical characterization and in vitro dissolution of Oxcarbazepine and β-cyclodextrin inclusion complexes. Ind. Drug, v.45, p.816-820, 2008.
Received for publication on 4th July 2011