*Correspondence: K.A. Figueiredo. Department of Health. Campus Teresina Central. Federal Institute of Education, Science and Technology of Piauí. Praça da Liberdade S/N, Rua Álvaro Mendes - Centro - 64000-040 - Teresina - PI, Brazil. E-mail: [email protected]
A
vol. 52, n. 2, apr./jun., 2016 http://dx.doi.org/10.1590/S1984-82502016000200003
Phenobarbital loaded microemulsion: development, kinetic release
and quality control
Kayo Alves Figueiredo
1,*, Jamilly Kelly Oliveira Neves
2, José Alexsandro da Silva
2, Rivelilson
Mendes de Freitas
3,4, André Luis Menezes Carvalho
31Department of Health, Campus Teresina Central, Federal Institute of Education, Science and Technology of Piauí, Teresina, PI, Brazil, 2Department of Pharmacy, State University of Paraíba, Campina Grande, PB, Brazil, 3College of Pharmacy, Campus Minister Petronio Portela, Federal University of Piauí, Teresina, PI, Brazil, 4Laboratory of Experimental
Neurochemistry Research, Federal University of Piauí, Teresina, PI, Brazil
This study aimed to obtain and characterize a microemulsion (ME) containing phenobarbital (PB). The PB was incorporated in the proportion of 5% and 10% in a microemulsion system containing Labrasol®,ethanol, isopropyl myristate and puriied water. The physicochemical characterization was performed and the primary stability of the ME was evaluated. An analytical method was developed using spectrophotometry in UV λ = 242 nm. The kinetics of the in vitro release (Franz model) of the ME and the emulsion (EM) containing PB was evaluated. The incorporation of PB into ME at concentrations of 5 and 10% did not change pH and resistance to centrifugation. There was an increase in particle size, a decrease of conductivity and a change in the refractive index in relation to placebo ME. The ME remained stable in preliminary stability tests. The analytical method proved to be speciic, linear, precise, accurate and robust. Regarding the kinetics of the in vitro release, ME obtained an in vitro release proile greater than the EM containing PB. Thus, the obtained ME has a potential for future transdermal application, being able to compose a drug delivery system for the treatment of epilepsy.
Uniterms: Microemulsion/physicochemical characterization. Microemulsion/In vitro release. Phenobarbital/microemulsion system/evaluation. Nanotechnology.
O objetivo deste trabalho foi obter e caracterizar uma microemulsão (ME) contendo fenobarbital (FEN). O FEN foi incorporado na proporção de 5% e 10% em um sistema microemulsionado composto por labrasol®,etanol, miristato de isopropila e água puriicada. Foi realizada a caracterização físico-química e avaliada a estabilidade preliminar da ME. Desenvolveu-se um método analítico por espectrofotometria em UV λ = 242 nm. Foi avaliada a cinética de liberação in vitro (em modelo de Franz) da ME e da emulsão (EM) contendo FEN. A incorporação do FEN em ME nas concentrações de 5 e 10% não alterou o pH e a resistência à centrifugação. Houve aumento do tamanho da partícula, redução da condutividade e alteração do índice de refração em relação à ME placebo. A ME manteve-se estável nos ensaios de estabilidade preliminar. O método analítico demonstrou ser especíico, linear, preciso, exato e robusto. Na cinética de liberação in vitro, a ME obteve um peril de liberação in vitro superior a EM contendo FEN. Desta forma, a ME obtida tem potencial para uma futura aplicação transdérmica, podendo compor um sistema de liberação de fármacos para tratamento da epilepsia.
INTRODUCTION
Approximately 50 million people worldwide are
living with epilepsy (Gomes et al., 2002). It affects
between 7 and 14 of each 1,000 people (WHO, 2015). It is one of the most common serious neurological disorders worldwide, which can be successfully controlled with one single antiepileptic. Uncontrolled seizures may result in injuries, embarrassment, anxiety, unpredictability, and
occasionally may induce death (Dalmora et al., 2010).
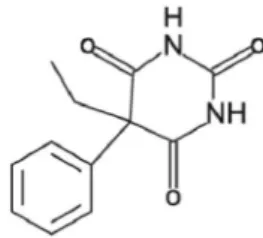
Phenobarbital (PB – Figure 1) is a barbiturate that acts as a non-selective Central Nervous System depressant. It is widely used as an antiepileptic drug for it is complete
and very efective drug and has advantages such as low
cost, broad spectrum of action and ease of use (Dalmora et al., 2010). It is a centenarian drug and is still the best
cost-beneit pharmacological treatment for epilepsy, especially
in developing countries (Brodie, Kwan, 2012).
Studies have shown that the pharmacokinetics of PB in children and young adults is age-dependent, and may have an absolute bioavailability of 48.9% among the pediatric population (Yukawa, Higuchi, Aoyama,
1992; Marsot et al., 2013). In addition, comparing oral
administration with the intramuscular route, there is a difference of about 60% in terms of bioavailability in
newborns (Yukawa et al., 2011). Newborns present a late
and incomplete oral absorption of PB when compared with intramuscular administration (Jalling, 1975). Furthermore, the narrow therapeutic margin of this anticonvulsant is one of the aggravating factors for the treatment of epileptic seizures, since the usual doses may lead plasma concentrations to toxic levels.
Recently, a great attention has been paid to the development of drug delivery systems using lipid microemulsions (ME) as carrier agents of drugs with a
low aqueous solubility, such as PB (Üstündağ Okur et al., 2011). The drug penetration rate into the skin can be increased by the use of permeation enhancers (Williams, Barry, 2004), and MEs are known for increasing the availability of certain drugs into the deeper layers of the skin.
MEs are systems in which the internal phase is a dimensionally restricted microenvironment, with particular properties. It may bond or associate molecules
with diferent polarities (Oliveira et al., 2004). They are generally characterized as spherical aggregates, and have diameters smaller than 1,400 Å, typically 100 Å (Yacubian,
2002). They can be deined as thermodynamically stable,
isotropic and as transparent systems with two immiscible
liquids (usually water and oil) stabilized by a film of
surfactant compounds (with or without co-surfactants) located in the oil/water interface (Lawrence, 1994;
Üstündağ Okur et al., 2011).
In the literature, several PB quantiication methods
are described, such as titration (ANVISA, 2010), spectrophotometry (Boeris, Luco, Olsina, 2000), high
performance liquid chromatography (HPLC) (Dalmora et
al., 2010; ANVISA, 2010), and immunoassays (Spiehler
et al., 1976; Pastore, Ofuchi, Nishiyama, 2007). Several pharmaceutical formulations were described, such as oral solution (Yska et al., 2000) and tablets (Goicoechea, Olivieri, 1998). It is necessary, therefore, to develop an analytical method for determining PB in ME.
Most publications on PB quantification
use biological samples. They generally consist of
simultaneous quantifications with structurally similar
drugs (Boeris, Luco, Olsina, 2000) and/or metabolites (Romer, Donaruma, Zuman, 1977) in blood. The Brazilian Pharmacopoeia describes an analytical method using spectrophotometric to determine drugs in solutions, which
preconizes the solubilization of the drug in a borate bufer
with a pH = 9.6 (ANVISA, 2010).
Djabri, Guy and Delgado-Charro (2012) showed that determining PB by iontophoresis was capable of penetrating skin layers. PB administered by organogel and oil formulation was capable of permeating the skin of healthy cats (Gasper et al., 2015). In a recent study conducted by our research group, Figueiredo et al. (2015) demonstrated that PB in nanocarriers reduced seizures and the death rate in the rats submitted to seizures using a model induced by pilocarpine. Further, the transdermal application of the formulation was capable of reducing oxidative stress and neuronal damage to the hippocampus of animals. In the market, an oral formulation containing
cyclosporine in microemulsion (Sandimmun Neoral®)
is used in immunosuppressive therapy. In addition, drugs are being marketed in adhesives for transdermal administration such as estradiol (Dermestriol®), fentanyl
(Durogesic®), scopolamine (Scopoderm®), among others.
Formulations containing microemulsions for transdermal administration are patent-protected worldwide (Figueiredo
Knowing that MEs are known for increasing the availability of certain drugs into the deeper layers of the skin and that the PB is a candidate drug for transdermal permeation, this study aimed to use MEs containing PB for transdermal use as a strategy for the treatment of epilepsy. In addition, its preliminary stability and physicochemical characterization were analyzed, an analytical method for the determination of PB in ME was developed and
the kinetics of the in vitro release of PB into ME was
performed.
MATERIAL AND METHODS
Chemicals
PB raw material was used as standard (PharmaNostra, lot no. 10083132B, content 100.18%, Brazil). The
Labrasol® (caprylocaproyl macrogol-8 glycerides) was
purchased from Gattefosse (France). Ethanol (EtOH) 99.8% was purchased from Dinâmica (Brazil) and
Vetec (Brazil). NaOH was acquired from Vetec (Brazil).
The isopropyl myristate was purchased from Synth (Brazil). Purified water was obtained through reverse osmosis system (Milipore, Germany). Non-ionic self-emulsifying wax (PharmaNostra, Brazil), methylparaben, propylparaben and propylene glycol (Vetec, Brazil), were
used. The dialysis membrane was acquired from
Sigma-Aldrich (Brazil).
Preparation of the ME and incorporation of the PB The ME was prepared as a cold mixture, under mild agitation, of Labrasol®, ethanol, isopropyl myristate
and puriied water. To design the pseudo-ternary phase
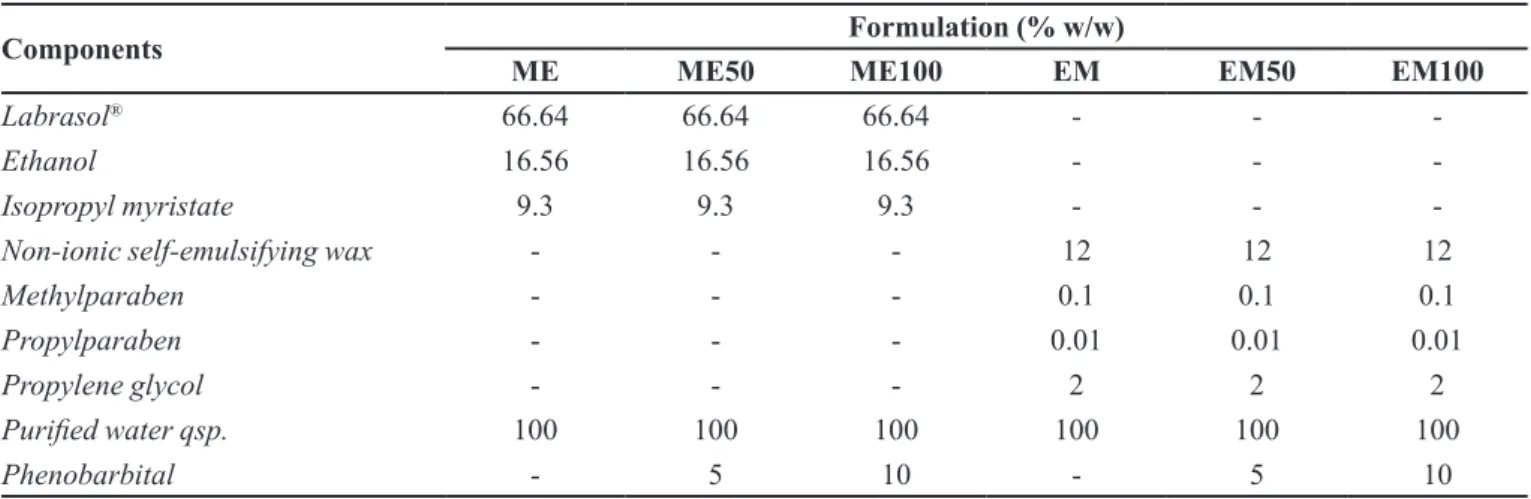
diagram, proportions of surfactants and oil phase were fixed, followed by a drop-by-drop addition of purified water until the mixture became clear (microemulsion region). The PB was incorporated cold at concentrations of 50 mg/g (ME50) and 100 mg/g (ME100). In the preparation EM 50 mg/g (EM50) and 100 mg/g (EM100), non-ionic self-emulsifying wax, methylparaben, propylparaben,
propylene glycol and puriied water were used (Table I).
Physicochemical characterization
In all characterization tests performed, the mean±standard deviation of triplicate samples was used (also in the ME placebo, and with 5-10% of the incorporated drug).
Solubilization Capacity
In order to assess the maximum solubilization
capacity of PB in ME, a solubility test was performed
according to the adapted methodology of Üstündağ Okur
et al. (2011). An excess of PB in a test tube containing 3 mL of ME (n=3) was added, then proceeding to the following conditions: stirring at 100 rpm for 72 hours at 37±2 °C.
Subsequently, it was centrifuged for 30 min at 3,000 rpm. The sample was iltered; then, the iltered aliquots were transferred to a volumetric lask, supplementing it
with a EtOH:NaOH mixture (pH 13, 0.1M) (50:50, v/v) (Boeris, Luco, Olsina, 2000). Readings were taken at UV
λ = 242 nm.
Resistance to centrifugation
Samples of each formulation were subjected to centrifugation for 30 min at 3,000 rpm (HT, Brazil). Then, the occurrence or not of phase separation or any evidence of instability was observed.
pH, conductivity and refractive index
The pH of the ME was evaluated using a digital potentiometer (Bel Engineering, Italy) with a glass electrode and a temperature sensor previously calibrated
with pH 4.0 and 7.0 bufer solutions. The glass electrode
was inserted directly inside the formulation. The conductivity was determined in an electrical conductivity meter (Marte, Brazil). The refractive index was determined using a refractometer (Quimis, Brazil) calibrated with
puriied water. Readings were taken at 25±2 ºC.
Viscosity
The viscosity of the formulations was assessed in a digital rotary viscometer (Quimis, Brazil) through variations in the rotational speed between 6 and 60 rpm using nº 4 (ME) and nº 1 spindles (EM).
Particle size and polydispersity index (PDI)
The nanometric droplet size analysis was made
using dynamic light scattering technique. It provides the
hydrodynamic radius of colloidal particles (Malvern, England). The system temperature was kept at 25 °C and the droplet diameter (nm) and PDI (polydispersity index) (n = 3) were calculated.
Preliminary stability
(ANVISA, 2005). The parameters were analyzed at the beginning of the study and immediately after thermal stress tests, freeze-thaw cycle and 30 days at room temperature (25±2 °C). The drug content at 60 and 90 days after sample preparation was also evaluated.
The samples to the thermal stress were subjected to the temperatures in the range of 40-80 °C, with elevation progression of 10 °C/30minutes in thermostated water-bath (Nova ética, Brazil). The formulations were evaluated at the end of 80 °C, after returning to room temperature (25±2 °C) (Baby et al., 2008). For the freeze-thaw cycle, the samples were subjected at -5°C ± 2 °C in a refrigerator (Electrolux, Brazil) for 24 h and 50 °C ± 2 °C for 24 h in an oven (Icamo, Brazil), completing a cycle. At the end of 12 days (6 cycles) the formulations were analyzed after returning to room temperature (25 °C) (ANVISA, 2004). ME formulations with and without PB at 5 and 10% were evaluated, besides the comparative study with EM.
Validation of the analytical method to determine PB in ME
Sample preparation and analysis conditions
EtOH:NaOH (pH 13, 0.1 M) (50:50, v/v) was a
solvent used to design ithe calibration curve PB. Aliquots
of a 1 mg/mL solution were transferred to 10 mL volumetric
lasks. In the preparation of the samples, an amount of ME
containing 5 mg of PB was weighed in a 10 mL volumetric
lask (Bioprecisa, Brazil). The sample was diluted with an
EtOH:NaOH solution by stirring it manually for about 60
seconds. Then, an aliquot of this solution was transferred to another 10 mL volumetric lask containing the same
solvent. All readings were made using spectrophotometry in the UV region at 242 nm using EtOH:NaOH as a blank solution (spectrophotometers Bioscience, England, and Shimadzu, Japan). The following analytical parameters were evaluated: specificity and selectivity, linearity and interval of the method, precision and accuracy, and robustness (ANVISA, 2003).
Specificity and selectivity
The following solutions were prepared: PB standard solution, solution of PB in ME, solution of ME without PB (placebo), and EtOH:NaOH solvent. A scan in the range of 200-400 nm was carried out and the absorption spectra shown by the curves were compared.
Linearity and interval of the method
A series of 7 dilutions in triplicate was conducted in the concentration range 1-24 µg/mL. The correlation
coeicient was obtained by linear regression by the least
squares method. Limits of detection (LOD) and limit of quantiication (LOQ) were calculated according to RE
no. 899/2003.
Precision and accuracy
The repeatability was evaluated by the mean of six sample determinations at a concentration of 12 µg/mL. In the intermediate precision assay, the between-run precision of sample determinations (n = 6) of a same concentration was evaluated within an interval of 48 hours
of repeatability and performed by diferent analysts. The
inter-laboratory precision (reproducibility) was performed on the same day under the same conditions of analysis in a laboratory B. Accuracy was assessed by adding PB in ME and its recovery percentage in three distinct concentration levels (n=3): 9.6, 12 and 14.4 µg/mL (80, 100 and 120% contents).
Robustness
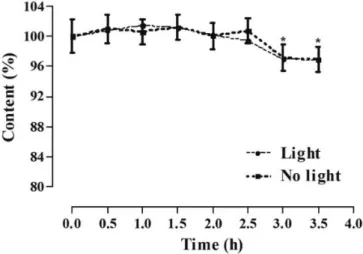
The robustness was evaluated by the change in sample preparation conditions by the method of stirring during its preparation. Magnetic manual stirring and different manufacturers of the ethanol solvent were compared. In order to evaluate the stability of the analyte, ME samples were prepared for spectrophotometric determination according to the previous procedure and were subjected to the presence and absence of light. The reading was performed at 242 nm in intervals of 0 h to 3.5 h.
Kinetics of the in vitro release of PB in ME
The kinetics of the in vitro release of ME50 was
evaluated and compared with EM50. The study was
conducted using dialysis membranes in Franz type difusion
cells with a diffusional area of 1.15 cm2 and a volume
of ±14 mL. The receiver compartment was filled with borate buffer at a pH 9.6 associated with 10% of EtOH
(previously deined) in a system composed of individual
cells (37 ± 0.5 oC, 100 rpm). An amount of EM50 or ME50
(containing 20 mg of PB) was applied into the receptor compartment directly on the membrane. Samples of the receiving solution were collected at 2, 4, 6, 8, 12 and 24 h.
Readings of the collected aliquots were performed at UV
λ=242 nm. The total volume of the receptor phase was
replaced at each sampling time for replacement of the medium maintaining sink conditions (Carvalho et al., 2012).
Statistical analysis
Student’s t test to evaluate possible statistical diferences with a statistical signiicance of p<0.05. For data analysis,
the software Microsoft Office Excel®, OriginLab® and
Graphpad Prism® were used. The linearity of the method
was subjected to analysis of variance (ANOVA).
RESULTS AND DISCUSSION
Obtaining ME and physicochemical characterization
Figure 2 shows a pseudo-ternary phase diagram, which may show the ME region. The adopted criterion for considering ME was the observation of clear, single phase, isotropic and low viscous systems.
The formulations used in all tests of this work are described with their respective components on Table I.
In the investigation of the maximum solubility of PB in ME, the value 137.8±13.7 mg/mL was obtained, being 2.3 times higher than recently published results considering
an oral PB loaded microemulsion(Monteagudo et al.,
2013). The solubility of the drug in water is approximately
1.0 to 1.2 mg/mL. The ME was as efective in solubilizing PB as aqueous solutions, with a high amount of
co-solvents such as propylene glycol at 50% (Shayanfar, Acree Jr, Jouyban, 2009) and ethanol at 80% (Attwood, Florence, Rothschild, 2003). Thus, it was possible to easily incorporate PB using mild stirring at concentrations of 5% and 10%, obtaining the formulations ME50 and ME100 that were evaluated in this work.
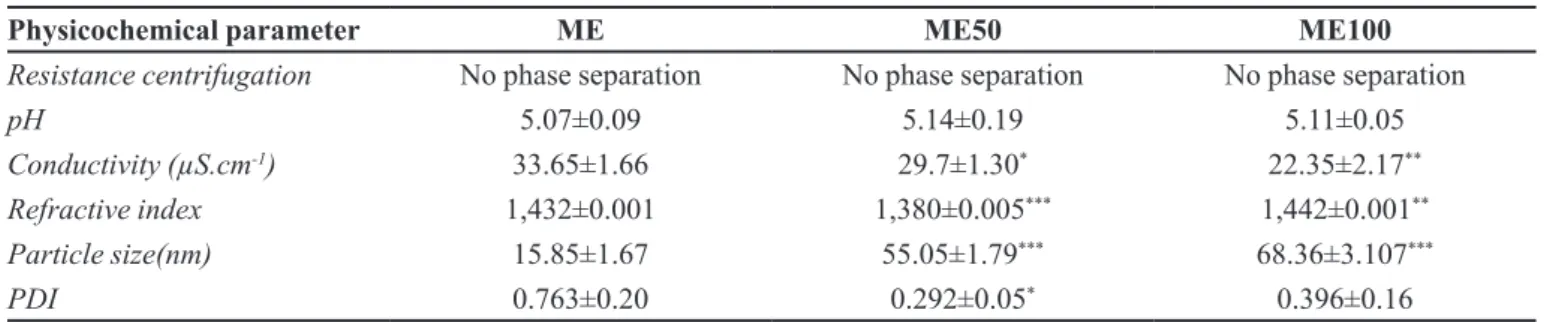
For the physicochemical characterization of ME placebo (ME) and formulations containing PB (ME50 and ME100) the results shown on Table II were obtained. It was observed that the tested formulations showed no phase separation. The approval in this test is a sign of the stability of evaluated preparations. The formation of precipitates or phase separation indicates the need of recasting them (ANVISA, 2004). Thus, by the spin-resistance test, a preliminary analysis of the presence of a possible physical instability was performed when PB was incorporated into ME.
The obtained formulations showed a pH compatible
with the skin and without signiicant changes upon adding
the drug (Table II). It is recommended that products with a prolonged permanence on the skin have a pH between 4.0 and 7.0 (Rebello, 2005). That is, the pH should be near the skin’s pH range, i.e., from 4.6 to 5.8 (Leonardi, Gaspar, Campos, 2002; Campos, Frasson, 2011).
The measurement of conductivity is an attempt to classify the type of formulation based on the distribution of the phases, allowing the determination of the conductivity of polar or apolar domains (Urban, 2004). The used
TABLE I - Description of the formulations used in the accelerated stability study
Components Formulation (% w/w)
ME ME50 ME100 EM EM50 EM100
Labrasol® 66.64 66.64 66.64 - -
-Ethanol 16.56 16.56 16.56 - -
-Isopropyl myristate 9.3 9.3 9.3 - -
-Non-ionic self-emulsifying wax - - - 12 12 12
Methylparaben - - - 0.1 0.1 0.1
Propylparaben - - - 0.01 0.01 0.01
Propylene glycol - - - 2 2 2
Puriied water qsp. 100 100 100 100 100 100
Phenobarbital - 5 10 - 5 10
surfactant, Labrasol®, tends to form ME type O/A because
its HLB value is 12 (Lawrence, Ress, 2000; Ash, Ash, 2004; Gatefossé, 2016), favoring the formation of micelles with an oily internal phase.
A small decrease in conductivity of ME was observed when the drug was incorporated into the system. This may characterize structural changes in ME by the incorporation of a hydrophobic molecule, since its conductivity is very sensitive to changes in the phase arrangement of a microemulsion system (Mo, Zhong, Zhong, 2000; Mehta, Kaur, 2011). Halle (1990) shows that the increase in the size of droplets in a ME O/A may
inluence the luctuations of their charges, and thus reduce
conductivity. A relation between the increase of droplets’ size and the reduction of the system conductivity (Table II) was observed.
The refractive index can be used to determine the purity of solutions or the proportions with which certain
liquids are mixed. It is the ratio of the light propagation
speed in air and its speed in the substance (Longo, 2006). The refractive index of the ME50 formulation achieved a
signiicant reduction, being closer to the value of puriied
water (1,333) and more distant from the value of Labrasol®
(1,450-1,470) (Ash, Ash, 2004). The formulation ME100
obtained a small but signiicant increase in its value, which may indicate the irst signs of instability when increasing
the drug content in the formulation.
The nanosize of ME droplets was afected with the
incorporation of the drug. However, it remained within
the ME range, i.e., 10-150 nm (Silva et al., 2009), or,
according to Damasceno et al. (2011), 10-300 nm (Table
II). The increase in droplet diameter might suggest the location of the drug in the interfacial layer of surfactants, which may decrease the curvature of the micelle and thus change the size of the droplets (Gomes, 2010). The PDI value lower than 0.5 indicates homogeneity of the droplet size (Üstündağ Okur et al., 2011), which did not occur with the ME placebo. The incorporation of the drug may have helped to standardize the size of formed droplets and may thus stabilize the formulation.
In the evaluation of the viscosity with a rotation speed between 6 and 60 rpm, the viscosity curve was obtained for ME, ME50, ME100, EM, EM50 and EM100 (Figure 3).
The incorporation of PB did not interfere signiicantly
with viscosity values for any tested concentrations. The tested formulations showed a viscosity with a profile
characteristic of non-Newtonian luids, with a reduction
in apparent viscosity with the increase in rotation speed TABLE II - Physicochemical characterization of ME and ME placebo containing PB 5% or 10%
Physicochemical parameter ME ME50 ME100
Resistance centrifugation No phase separation No phase separation No phase separation
pH 5.07±0.09 5.14±0.19 5.11±0.05
Conductivity (µS.cm-1) 33.65±1.66 29.7±1.30* 22.35±2.17**
Refractive index 1,432±0.001 1,380±0.005*** 1,442±0.001**
Particle size(nm) 15.85±1.67 55.05±1.79*** 68.36±3.107***
PDI 0.763±0.20 0.292±0.05* 0.396±0.16
PDI – polydispersity index. *p<0,05; **p<0,01; ***p<0,001 in relation to ME. Student’s t test.
(Corrêa et al., 2005). The viscosity of the ME proved to be approximately 200 times less than the viscosity of
conventional EMs. This parameter may directly inluence the drug release proile according to their formulations,
because formulations with a higher viscosity may have a reduced in vitro release drug proile (Chorilli et al., 2007).
Preliminary stability
In the preliminary evaluation of stability, the results were obtained according to Tables III and IV. In a stability study, important information can be obtained.
Emulsiied systems, when stored and submitted to several
external factors, are subjected to the appearance of signs of destabilization, such as creaming, sedimentation,
locculation, coalescence, phase separation and loss of
the content of active substances of the formulation (Baby
et al., 2008).
When stored at room temperature for 30 days, the
formulations with ME did not show signiicant changes
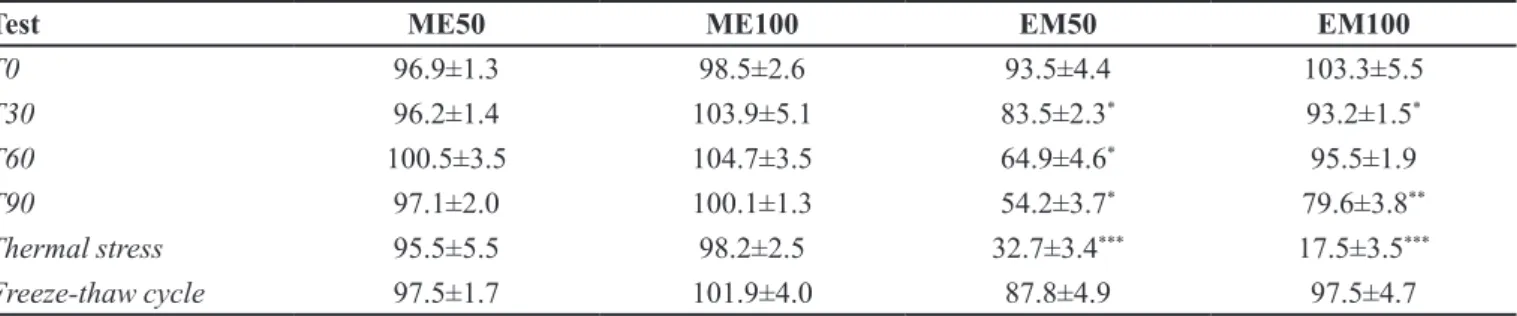
in the evaluated parameters. However, conventional EMs showed a significant loss of chemical stability, with a reduction in drug content after 30, 60 and 90 days. The ME50 and ME100 content was kept for 90 days after preparation (Table IV).
In thermal stress and freeze-thaw cycle tests, some discreet changes in pH and conductivity values were observed for ME, which may be acceptable considering the extreme temperature conditions used, ranging from -5 to 80 °C (Baby et al., 2007). The increased conductivity can be related with coalescence, while its decrease can be related with aggregation (ANVISA, 2004). Furthermore, the ME showed a chemical stability before these tests, which was not the case of EM containing PB, with a decrease of the drug content up to 80% for thermal stress and up to 40% at 90 days of preparation (Table IV). When subjected to the freeze-thaw cycle test, the EM maintained the drug content, changing only pH and conductivity values in EM and EM100 compared to T0. Moreover, changes in the conductivity, pH and production of typical signs of instability, such as phase separation and creaming, were observed for such formulations in the thermal stress test (Table III).
Validation of the analytical method to determine PB in ME
In order to verify the speciicity and selectivity of
the method, spectrophotometric scans were performed at the UV regions 200-400 nm. These analyzed parameters
TABLE III - Preliminary stability of the formulations tested after 30 days at room temperature, thermal stress and freeze-thaw cycle for organoleptic characterization, pH and conductivity
Test ME ME50 ME100 EM EM50 EM100
T0
Organoleptic characterization Normal Normal Normal Normal Normal Normal
pH 5.1±0.1 5.1±0.2 5.1±0.1 5.6±0.3 5.1±0.0 4.9±0.2
Conductivity (μS.cm-1) 33.7±1.7 29.7±1.3 22.4±2.2 35.2±3.7 43.9±1.6 47.5±2.4
T30
Organoleptic characterization Normal Normal Normal Normal Normal Normal
pH 5.1±0.1 5.0±0.0 4.9±0.1 5.3±0.2 4.9±0.1 4.6±0.0
Conductivity (μS.cm-1) 35.5±0.4 32.1±1.6 26.8±2.8 33.9±2.5 42.5±3.8 43.1±1.7
Thermal stress
Organoleptic characterization Normal Normal Normal Phase separ., creaming
Phase separ., creaming
Phase separ., creaming
pH 5.3±0.1* 5.0±0.0 4.9±0.0* 5.1±0.1* 5.1±0.1 5.2±0.1***
Conductivity (μS.cm-1) 30.4±1.0* 27.8±0.7 24.5±1.3 43.6±3.1* 101.1±6.0*** 140.6±6.7***
Freeze-thaw cycle
Organoleptic characterization Normal Normal Normal Normal Normal Normal
pH 5.1±0.1 5.1±0.0 5.1±0.0 5.0±0.0* 4.9±0.1 4.6±0.1*
Conductivity (μS.cm-1) 38.5±2.2* 34.2±0.2** 28.2±0.8* 40.2±2.2 45.6±3.5 54.6±2.9*
are important in the validation of analytical methods to discard interference from impurities, excipients and degradation products by determining the amount of a drug in the formulation under study (Streck et al., 2011). The method was able to perform the determination of the drug
without a signiicant interference from ME constituents in
the region UV λ = 242 nm, where there was no signiicant
absorbance of the placebo sample compared to the used solvent (data not shown).
On Table V, the results of the study of linearity, precision, accuracy and robustness of the developed analytical method are observed. Linearity data were subjected to analysis of variance (ANOVA) with
statistically signiicant linear regression and without lack of adjustments (p <0.05). The values of limit of detection (LOD) and limit of quantiication (LOQ) are shown on
Table V, demonstrating the good sensitivity of the method. Precision is the assessment of the results proximity obtained in a series of measurements of a multiple sampling of the same sample (ANVISA, 2003). Table 5 shows the result of six determinations at a 100% concentration of the within-run (repeatability) and between-run (intermediate precision) precision tests. There were no statistically significant differences between the means of these
determinations. Moreover, the coeicients of variation
(CV) were lower than 5% (ICH, 1996). Regarding the TABLE IV - Preliminary stability of the formulations tested at 30, 60 and 90 days at room temperature, thermal stress and freeze-thaw cycle to PB content (%)
Test ME50 ME100 EM50 EM100
T0 96.9±1.3 98.5±2.6 93.5±4.4 103.3±5.5
T30 96.2±1.4 103.9±5.1 83.5±2.3* 93.2±1.5*
T60 100.5±3.5 104.7±3.5 64.9±4.6* 95.5±1.9
T90 97.1±2.0 100.1±1.3 54.2±3.7* 79.6±3.8**
Thermal stress 95.5±5.5 98.2±2.5 32.7±3.4*** 17.5±3.5***
Freeze-thaw cycle 97.5±1.7 101.9±4.0 87.8±4.9 97.5±4.7
T0 – time: 0 days; T30 – time: 30 days; T60 – time: 60 days; T90 – time: 90 days. *p<0,05; **p<0,01; ***p<0,001 in relation to T0. Student’s t test. Results were expressed as mean ± standard deviation.
TABLE V - Parameters obtained in validation of the analytical method for determining PB-loaded microemulsion
Parameters Experimental results CV (%) Value p*
Linearity 1 – 24 µg/mL
Straight-line equation y=0.037x – 0.007
Linear correlation coeicient r = 0.9996
LOD 0.409 µg/mL
LOQ 0.619 µg/mL
Precision
Repeatability 12.10±0,48 µg/mL 3.94 0.88261
Intermediate precision 12.05±0,54 µg/mL 4.47
Reproducibility Laborat. A: 11.96±0.16 µg/mL Laborat. B: 12.11±0.16 µg/mL
1.32 1.30
0.13525
Accuracy (%recuperation) 9,6 µg/mL
12,0 µg/mL 14,4 µg/mL
100.87±2.12% 100.29±0.9% 101.18±0.83%
2.10 0.9 0.82 Robustness
Stirring method Manual: 11.85±0.23 µg/mL Magnetic: 11.84±0.17 µg/mL
1.97 1.45
0.9601
Manufacturer solvent Manufact. A: 11.89±0.19 Manufact. B: 12.07±0.16
1.58 1.34
0.28184
assessment of inter-laboratory precision (reproducibility), the method also demonstrated a concordance between the
results obtained in diferent laboratories when compared to measurements with diferent equipment and the same
analyst, with p>0.05 (Table V).
The accuracy of the method was evaluated by the mean of three determinations at 80% (9.6 µg/ mL), 100% (12 µg/mL) and 120% (14.4 µg/mL) of the PB concentration (Table V). Recovery measures the efficiency of the extraction procedure of an analytical method within a limited variation. Desirable percentages are close to 100% (ANVISA, 2003). In all three tested concentrations (low, medium and high), the developed method demonstrated a percentage of recovery very close to 100, with CV lesser than 5%.
For the validation of an analytical method to determine a drug in a pharmaceutical formulation, the ability of this method to resist small and deliberate variations of an analytical parameters should be evaluated. Different values of pH, temperature and different manufacturers of the solvent used can be evaluated, as well as changes in sample preparation (ANVISA, 2003). The developed method was considered to be robust regarding the variation of the evaluated parameters, comparing manual stirring
with magnetic stirring and the use of ethanol from diferent manufacturers. No signiicant diferences were observed
during the preparation of the samples, with p values of 0.9601 and 0.28184, respectively (Table V). In addition, as a parameter for evaluating the robustness of the method, the stability of a PB sample in ME was demonstrated at 100% test concentration (12 µg/mL) in up to 2.5 hours
(Figure 4). There was a signiicant loss of approximately
3.11% of drug content in the presence (p=0.0286) and 3.08% in the absence of light (p = 0.0260) when comparing
0 and 3.5 h times. There was no inluence of light on sample
stability loss (p = 0.9189), comparing the 3.5 h time in both groups. Therefore, the use of samples prepared within 2 h is recommended considering that, although it does not exceed 10%, the loss is significant. Furthermore, the solution EtOH:NaOH used tends to interfere with the method 2 hours after preparation (data not shown).
The literature reports several spectrophotometric methods to determine drugs in MEs, such as benznidazole
(Streck et al., 2011), nortriptyline (Moreno et al.,
2000), diazepam (Dastidar, Sa, 2009) and nifedipine
(Castro, Moreno, Alastres, 2001), as being as efective in
determining drugs in MEs as HPLC methods (Moreno et
al., 2000, Silva et al., 2014). From the results obtained, it can be shown that the reported analytical method was rightfully determined and validated. It proved easy to be performed, inexpensive, using few toxic solvents and
applicable as a quality control method to laboratories
lacking chromatographic methods.
Kinetics of the in vitro release of PB in ME
In order to determine the solubility condition for
the establishment of sink conditions (Klose, Delplace,
Siepmann, 2011) for the kinetic of the in vitro release of PB in ME, a prior study of drug solubility was performed
using diferent bufer media and diferent pH values. The borate bufer solution at a pH 9.6 with 10% of EtOH was
used, for it has a better solubility and does not interfere with the wavelength 242 nm (data not shown). A basic pH facilitates the solubility of PB (pKa = 7.3) due to its conversion into an ionized tautomeric form, in addition to increasing its molar absorptivity compared to more acidic pHs (Romer, Donaruma, Zuman, 1977; Jelveghari, Nokhodchi, 2008).
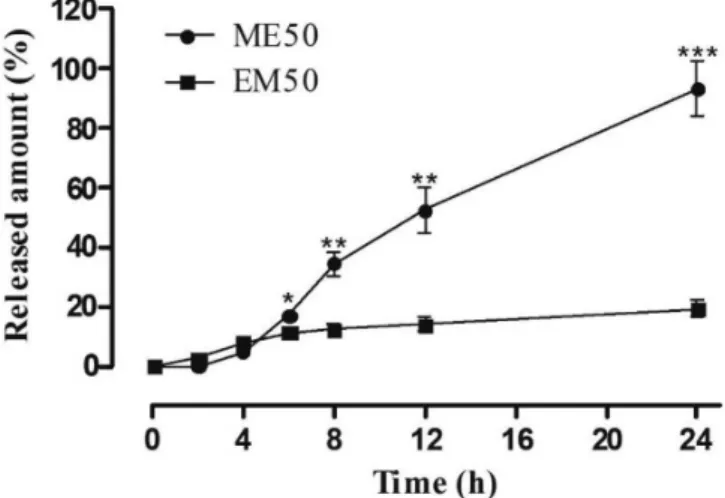
Factors such as surfactants/co-surfactants, microemulsion type, viscosity, drug solubility, particle size, among others, directly influence the behavior of drug release (Mortazavi, Pishrochi, Azar, 2013). In assessing the kinetics of the in vitro release of PB, ME50 obtained an amount of PB 4.8 times greater in 24 h (17.39 ± 3.13 mg.cm-1) than EM50 (3.84 ± 1.12 mg.cm-1),
with p=0.0003 for the point 24 h (Figure 5). This result was in accordance with the literature, considering that the ME is capable of increasing the drug release system (Hashem
et al., 2011; Kreilgaard, 2002). Thus, the ME provides
beneits, including increased solubility and absorption of
drugs, and the possibility of modifying pharmacokinetic parameters, decreasing toxicity and increasing its clinical
eicacy (Formariz et al., 2005; Klein, 2007).
Besides the inluence of droplet size, the presence
of the co-surfactant used (ethanol) may have contributed
to the diferences observed in the release of PB of the two
systems. In the obtained ME, ethanol may further reduce the surface tension of the surfactant, making the surface
of droplets more lexible and dynamic. The energy of this system facilitates the low of drugs through the interface
between the inner and outer layers. This facilitates their
release and difusion across membranes (Yi-Hung et al., 2011). Thus, the study on kinetics of the in vitro release showed promising results for MEs, which may provide, in the future, a product with transdermal application for the treatment of epilepsy.
CONCLUSION
The PB loaded microemulsion developed in this work has a great potential for a transdermal delivery of the drug. The incorporation of the drug was easily accomplished through mild stirring, besides providing a great solubilization capacity and little change in its physicochemical characteristics with the incorporation of the drug. Thus, it demonstrated a physicochemical stability greater than EM. The analytical method of determining
PB in ME can be used as a quality control method, and
proved easy to be performed and inexpensive. It uses few toxic solvents and is applicable to laboratories lacking chromatographic methods. Moreover, the ME obtained an in vitro release proile signiicantly greater than EM
containing PB. Thus, the obtained ME has a potential for future transdermal applications, being able to compose a drug delivery system for the treatment of epilepsy.
REFERENCES
AGÊNCIA NACIONAL DE VIGILÂNCIA SANITÁRIA. ANVISA. Guia de estabilidade de produtos cosméticos. Brasília: ANVISA, 2004.
AGÊNCIA NACIONAL DE VIGILÂNCIA SANITÁRIA. ANVISA.Farmacopeia Brasileira. Brasília: Anvisa, 2010. v.2.
AGÊNCIA NACIONAL DE VIGILÂNCIA SANITÁRIA. ANVISA. Resolução - RE nº 1, de 29 de julho de 2005 – Guia para a Realização de Estudos de Estabilidade. Brasília: Anvisa, 2005.
AGÊNCIA NACIONAL DE VIGILÂNCIA SANITÁRIA. ANVISA. Resolução - RE nº 899, de 29 de maio de 2003 – Guia para validação de métodos analíticos e bioanalíticos. Brasília: Anvisa, 2003.
ASH, M.; ASH, I. Handbook of green chemicals. 2. ed. New York: Synapse Information Resource Inc., 2004.
ATTWOOD, D.; FLORENCE, A.T.; ROTHSCHILD, Z. Princípios físico-químicos em farmácia. São Paulo: EDUSP, 2003. v.4, p.249.
BABY, A.R.; HAROUTIOUNIAN-FILHO, C.A.; SARRUF, F.D.; TAVANTE-JÚNIOR, C.R.; PINTO, C.A.S.O.; ZAGUE, V.; ARÊAS, E.P.G.; KANEKO, T.M.; VELASCO, M.V.R. Estabilidade e estudo de penetração cutânea in vitro da rutina veiculada em uma emulsão cosmética através de um modelo de biomembrana alternativo. Rev. Bras. Ciên. Farm., v.44, n.2, p.233-248, 2008.
BABY, A.R.; LACERDA, A.C.L.; KAWANO, Y.; VELASCO, M.V.R.; KANEKO, T.M. PAS-FTIR and FT-Raman qualitative characterization of sodium dodecyl sulfate interaction with an alternative stratum corneum model membrane. Pharmazie, v.62, n.10, p.727-731, 2007.
BOERIS, M.S., LUCO, J.M.; OLSINA, R.A. Simultaneous spectrophotometric determination of phenobarbital, phenytoin and methylphenobarbital in pharmaceutical preparations by using partial least-squares and principal component regression multivariate calibration. J. Pharm. Biomed. Anal., v.24, n.2, p.259-271, 2000.
BRODIE, M.J.; KWAN, P. Current position of phenobarbital in epilepsy and its future. Epilepsia, v.53, n.8, p.40-46, 2012.
CAMPOS, J.S.; FRASSON, A.P.Z. Avaliação da atividade antioxidante do extrato aquoso de Lafoensia pacari A. ST-HIL. em emulsão não-iônica. Rev. Ciên. Farm. Básica Apl., v.32, n.3, p.363-368, 2011.
CARVALHO, A.L.M.; CUNHA, C.P.; CRUZ, E.T.L.; SILVA, J.A.; LIRA, A.A.M.; SANTANA, D.P. Spectrophotometric determination of zidovudine-loaded microemulsion and application in assay of in vitro release kinetics. Lat. Am. J. Pharm., v.31, n.7, p.1052-1056, 2012.
CASTRO, D.; MORENO, M.A.; LASTRES, J.L. First-derivative spectrophotometric and LC determination of nifedipine in Brij® 96 based oil/water/oil multiple
microemulsions on stability studies. J. Pharm. Biomed. Anal., v.26, n.4, p.563-572, 2001.
CHORILLI, M.; ZAGUE, V.; SCARPA, M.V.; LEONARDI, G.R. Inluência da viscosidade do veículo na liberação in vitro da cafeína. Rev. Eletr. Farm., v.4, n.1, p.52-60, 2007.
CORRÊA, N.M.; CAMARGO JÚNIOR, F.B.; IGNÁCIO, R.F.; LEONARDI, G.R. Avaliação do comportamento reológico de diferentes géis hidrofílicos. Rev. Bras. Ciên. Farm., v.41, n.1, p.73-78, 2005.
DALMORA, S.L.; MAXIMILIANO, S.S.; DANIELE, R.N.; FELIPE, B.D.; RONÍLSON, A.M.; CARLOS EDUARDO, S.; ROGÉRIO ANTONIO, O.; NEY, C.B. Determination of phenobarbital in human plasma by a specific liquid chromatography method: application to a bioequivalence study. Quím. Nova, v.33, n.1, p.124-129, 2010.
DAMASCENO, B.P.G.L.; SILVA, J.A.; OLIVEIRA, E.E.; SILVEIRA, W.L.L.; ARAÚJO, I.B.; OLIVEIRA, A.G.; EGITO, E.S.T. Microemulsão: um promissor carreador para moléculas insolúveis. Rev. Ciên. Farm. Básica Apl.,v.32, n.1, p.9-18, 2011.
DASTIDAR, D.G.; SA, B. A Comparative Study of Spectrophotometry and First-Order Derivative UV-Spectrophotometry Methods for the Estimation of Diazepam in Presence of Tween-20 and Propylene Glycol. AAPS PharmSciTech, v.10, n.4, p.1396-1400, 2009.
DJABRI, A.; GUY, R.H.; DELGADO-CHARRO, M.B. Passive and iontophoretic transdermal delivery of phenobarbital: Implications in paediatric therapy. Int. J. Pharm., v.435, p.76-82, 2012.
FIGUEIREDO, K.A.; MENDES, R.M.B.; CARVALHO, A.L.; FREITAS, R.M. Microemulsions for transdermal drugs delivery systems: an exploration technology. Rev. GEINTEC, v.3, n.4, p. 36-46, 2013.
FIGUEIREDO, K.A.; MEDEIROS, S.C.; NEVES, J.K.; SILVA, J.A.; ROCHA TOMÉ, A.; CARVALHO, A.L.; DE FREITAS, R.M. In vivo evaluation of anticonvulsant and antioxidant effects of phenobarbital microemulsion for transdermal administration in pilocarpine seizure rat model. Pharmacol. Biochem. Behav., v.131, p.6-12, 2015.
FORMARIZ, T.P.; URBAN, M.C.C.; SILVA JUNIOR, A.A.; GREMIÃO, M.P.D.; OLIVEIRA, A.G. Microemulsões e fases líquidas cristalinas como sistemas de liberação de fármacos. Rev. Bras. Ciên. Farm., v.41, n.3, p.301-313, 2005.
GASPER, J.A.D.; HELLER, H.L.B.; ROBERTSON, M.; TREPANIER, L.A. Therapeutic serum phenobarbital concentrations obtained using chronic transdermal administration of phenobarbital in healthy cats. J. Feline Med. Surg., v.17, n.4, p.359-363, 2015.
GATEFOSSÉ. Labrasol®. Avaiable at: < http://www.gattefosse.
com/en/applications/labrasol.html>. Accessed on: 21 mar 2016.
GOICOECHEA, H.C.; OLIVIERI, A.C. Simultaneous determination of phenobarbital and phenytoin in tablet preparations by multivariate spectrophotometric calibration. Talanta, v.47, n.1, p.103-108, 1998.
GOMES, F.E.S. Obtenção de sistemas microemulsionados e estudo de simulação por dinâmica molecular de sistemas micelares objetivando a veiculação de produtos naturais bioativos. 174 f. 2010. Tese (Programa de Pós-Graduação em Química). Universidade Federal do Rio Grande do Norte, Natal – RN, 2010.
GOMES, M.D.M.; ZEITOUNE, R.G.; KROPF, L.A.L.; VAN BEECK, E.S. A house-to-house survey of epileptic seizures in an urban community of Rio de Janeiro, Brazil. Arq. Neuro-Psiquiatr., v.60, p.708-711, 2002.
HASHEM, F.M.; SHAKER, D.S.; GHORAB, M.K.G.; NASR, M.; ISMAIL, A. Formulation, characterization, and clinical evaluation of microemulsion containing clotrimazole for topical delivery. AAPS PharmSciTech., v.12, n.3, p.879-886, 2011.
INTERNATIONAL CONFERENCE ON HARMONISATION. ICH. International Conference on Harmonization of Technical Requirements for Registration of Pharmaceuticals for Human Use, Validation of Analytical Procedures: Methodology, 1996.
JALLING, B. Plasma concentrations of phenobarbital in the treatment of seizures in newborns. Acta Paediatr. Scand., v.64, n.3, p.514-524, 1975.
JELVEGHARI, M.; NOKHODCHI, A. Development and chemical stability studies of alcohol-free phenobarbital solution for use in pediatrics: a technical note. AAPS PharmSciTech, v.9, n.3, p.939-943, 2008.
KLEIN, T. Desenvolvimento de sistemas nanoestruturados estabilizados com álcool cetilico etoxilado e propoxilado contendo fluconazol potencialmente ativo contra esporotricose. 114. f. 2007. Dissertação (Programa de Pós-Graduação em Ciências Farmacêuticas). Universidade Estadual Paulista, Araraquara – SP, 2007.
KLOSE, D.; DELPLACE, C.; SIEPMANN, J. Unintended potential impact of perfect sink conditions on PLGA degradation in microparticles. Int. J. Pharm., v.404, n.1-2, p.75-82, 2011.
KREILGAARD, M. Inluence of microemulsions on cutaneous drug delivery. Adv. Drug Deliv. Rev., v.54, n.1, p.S77-S98, 2002.
LAWRENCE, M.J. Surfactant systems: microemulsions and vesicles as vehicles for drug delivery. Eur. J. Drug Metab. Pharmacokinet., v.19, n.3, p.257-269, 1994.
LAWRENCE, M.J.; REES, G.D. Microemulsion-based media as novel drug delivery systems. Adv. Drug. Deliv. Rev., v.45, n.1, p.89-121, 2000.
LEONARDI, G.R.; GASPAR, L.R.; CAMPOS, P.M.B.G.M. Estudo da variação do pH da pele humana exposta à formulação cosmética acrescida ou não das vitaminas A, E ou de ceramida, por metodologia não invasiva. An. Bras. Dermatol., v.77, n.5, p.563-569, 2002.
LONGO, D.P. Obtenção, caracterização e estudos de liberação in vitro e permeação in vivo de sistemas microestruturados contendo cafeína. 2006. Dissertação (Programa de Pós-Graduação em Ciências Farmacêuticas) - Faculdade de Ciências Farmacêuticas, Universidade Estadual Paulista “Júlio de Mesquita Filho”, Araraquara, 2006.
MARSOT, A; BREVAUT-MALATY, V.; VIALET, R.; BOULAMERY, A.; BRUGUEROLLE, B.; SIMON, N. Pharmacokinetics and absolute bioavailability of phenobarbital in neonates and young infants, a population pharmacokinetic modelling approach. Fundam. Clin. Pharmacol., 2013. doi: 10.1111/fcp.12042.
MEHTA, S.K.; KAUR, G. Microemulsions: thermodynamic and dynamic properties. In: TADASHI, M. (Ed.). Thermodynamics. Croatia: In Tech., 2011.
MO, C.; ZHONG, M.; ZHONG, Q. Investigation of struture and structural transition in microemulsion systems of sodium dodecyl sulfonate + n-heptane + n-butanol + water by cyclic voltammetric and electrical conductivity measurements. J. Electroanal. Chem., v.493, n.1-2, p.100-107, 2000.
MONTEAGUDO, E.; LANGENHEIM, M.; SALERNO, C.; BUONTEMPO, F.; BREGNI, C; CARLUCCI, A. Pharmaceutical optimization of lipid-based dosage forms for the improvement of taste-masking, chemical stability and solubilizing capacity of phenobarbital. Drug Dev. Ind. Pharm., 2013. doi:10.3109/03639045.2013.787536.
MORENO, M.A.; BALLESTEROS, M.P.; FRUTOS, P.; LASTRES, J.L.; CASTRO, D. Comparison of UV spectrophotometric and LC methods for the determination of nortriptyline hydrochloride in polysorbate 80 based oil/ water (o/w) microemulsions. J. Pharm. Biomed. Anal., v.22, n.2, p.287-294, 2000.
MORTAZAVI, S.A.; PISHROCHI, S.; AZAR, Z.J. Formulation and in-vitro evaluation of tretinoin microemulsion as a potential carrier for dermal drug delivery. Iran. J. Pharm. Res., v.12, n.4, p.599-609, 2013.
OLIVEIRA, A.G.; SCARPA, M.V.; CORREA, M.A.; CERA, L.F.R.; FORMARIZ, T.P. Microemulsões: estrutura e aplicações como sistema de liberação de fármacos. Quím. Nova, v.27, n.1, p.131-138, 2004.
REBELLO, T. Guia de produtos cosméticos. 6. ed. São Paulo: Editora Senac São Paulo, 2005.
R O M E R , M . ; D O N A R U M A , L . G . ; Z U M A N , P. Spectrophotometric and polarographic analysis f o r p h e n o b a r b i t a l , N- m e t h y l p h e n o b a r b i t a l a n d N-methoxymethylphenobarbytal in a mixture. Anal. Chim. Acta , v.88, p.261-273, 1977.
SHAYANFAR, A.; ACREE JR, W.E.; JOUYBAN, A. Solubility of lamotrigine, diazepam, clonazepam, and phenobarbital in propylene glycol+ water mixtures at 298.15 K. J. Chem. Eng. Data, v.54, n.3, p.1153-1157, 2009.
SILVA, H.R.; SANTOS, F.K.; LUZ, G.M.; CHORILLI, M.; GREMIÃO, M.P.D. Validation of high-performance liquid chromatographic method for analysis of fluconazole in microemulsions and liquid crystals. Braz. J. Pharm. Sci., v.50, n.2, p.381-389, 2014.
SILVA, J.A.; SANTANA, D.P.; BEDOR, D.G.C.; BORBA, V.F.C.; LIRA, A.M.M.; EGITO, E. S.T. Estudo de liberação e permeação in vitro do diclofenaco de dietilamônio em microemulsão gel-like. Quím. Nova, v.32, n.6, p.1389-1393, 2009.
SPIEHLER, V.; SUN, L.; MIYADA, D.S.; SARANDIS, S.G.; WALWICK, E.R.; KLEIN, M. W.; JORDAN, D.B.; JESSEN, B. Radioimmunoassay, enzyme immunoassay, spectrophotometry, and gas-liquid chromatography compared for determination of phenobarbital and diphenylhydantoin. Clin. Chem., v.22, n.6, p.749-753, 1976.
STRECK, L.; SANTOS, K.S.C.R.; FERNANDES-PEDROSA, M.F.; SILVA-JÚNIOR, A.A.; OLIVEIRA, A.G. Validação de método analítico por espectrofotometria UV para sistema emulsionado lipídico contendo benznidazol. Quím. Nova, v.34, n.8, p.1459-463, 2011.
URBAN, M.C.C. Desenvolvimento de sistemas de liberação micro e nano estruturados para administração cutânea do acetato de dexametasona. 2004. 136 f. Dissertação (Pós-Graduação em Ciências Farmacêuticas) - Faculdade de Ciências Farmacêuticas, Universidade Estadual Paulista “Júlio de Mesquita Filho”, Araraquara, 2004.
ÜSTÜNDAĞ OKUR, N.; APAYDIN, S.; YAVAŞOĞLU, N.U.K.; YAVAŞOĞLU, A.; KARASULU, H.Y. Evaluation of skin permeation and anti-inlammatory and analgesic efects of new naproxen microemulsion formulations. Int. J. Pharm.,v.416, n.1, p.136-144, 2011.
WILLIAMS, A.C.; BARRY, B.W. Penetration enhancers. Adv. Drug Deliv. Rev., v. 56, n. 5, 603–618, 2004.
WORLD HEALTH ORGANIZATION. WHO. Epilepsy. Fact sheet N°999. May 2015. Avaiable at: <http://www.who. int/mediacentre/factsheets/fs999/en/>. Accessed in: 02 nov 2015.
YACUBIAN, E.M.T. Tratamento da epilepsia na infância. J. Pediatr., v.78, n.1, p.19-27, 2002.
YI-HUNG, T.; JUNG, T.C.; JUI-SHENG, C.; CHI-TE, H.; YAW-BIN, H.; PAO-CHU, W. The Efect of Component of Microemulsions on Transdermal Delivery of Buspirone Hydrochloride. J. Pharm. Sci., v.100, n.6, p.2358-2365, 2011.
YSKA, J.P.; ESSINK, G.W.G.; BOSCH, F.H.; LANKHAAR, G.; VAN SORGE, A.A. Oral bioavailability of phenobarbital: a comparison of a solution in myvacet 9-08,a suspension, and a tablet. Pharm. World Sci., v.22, n.2, p.67-71, 2000.
YUKAWA, E.; HIGUCHI, S.; AOYAMA, T. Phenobarbitone population pharmacokinetics from routine clinical data: role of patient characteristics for estimating dosing regimens. J. Pharm. Pharmacol., v.44, n.9, p.755-760, 1992.
YUKAWA, M.; YUKAWA, E.; SUEMATSU, F.; TAKIGUCHI, T.; IKEDA, H.; AKI, H.; MIMEMOTO, M. Population pharmacokinetics of phenobarbital by mixed effect modelling using routine clinical pharmacokinetic data in Japanese neonates and infants: an update. J. Clin. Pharm. Ther., v.36, n.6, p.704-710, 2011.
Received for publication on 15th January 2015