1M e s t re, Neuro c i ru rgião, Hospital Universitário Lauro Wanderley (HULW), Universidade Federal da Paraíba (UFPB), João Pessoa PB, Brasil;2P rofessora Doutora, Endocrinologista, HULW/UFPB;3P rofessora Doutora, Nutricionista, Departamento de Nutrição, UFPB; 4Graduando em Medicina, UFPB; 5Professor de Neurocirurgia, Neurocirurgião, Hospital Santa Isabel, João Pessoa PB, Brasil. Received 9 May 2005, received in final form 15 September 2005. Accepted 22 October 2005.
Dr. Maurus M.A. Holanda - Rua Santos Coelho Neto 200/802 - 58038-450 João Pessoa PB - Brasil. E-mail: [email protected]
ANTHROPOMETRIC EVALUATION IN DIABETIC
PATIENTS WITH ISCHEMIC STROKE
Maurus Marques de Almeida Holanda
1, Rosália Gouveia Filizola
2,
Maria José de Carvalho Costa
3, Emerson Magno Fernandes de Andrade
4,
José Alberto Gonçalves da Silva
5ABSTRACT - Strokes are one of the most common causes of mortality and long term severe disability. Risk factors for stroke include: age, gender, diabetes mellitus (DM), hypertension, and many others. O b j e c t i v e :
To evaluate obesity and hypertension in patients affected by acute ischemic stro k e . Method:We com-p a red the anthrocom-pometric variables between tycom-pe II diabetic com-patients and non-diabetic com-patients. We eval-uated a total of 60 patients, divided into two groups: 34 non-diabetic patients and a group of 26 type II diabetic subjects. Results:The predominance of obesity, as well as hypertension, was very high among the studied groups, presenting no diff e rences among the waist-hip ratio (WHR) values of the study gro u p c o m p a red to the ones of the control gro u p . Conclusion:The predominance of obesity was very high among the studied groups and there was prevalence the android type obesity. There was no significative difference in the anthropometric evaluation by the measurement of WHR and the waist in the groups.
KEY WORDS: s t roke, diabetes mellitus, anthro p o m e t ry, cerebral thromboses, arterial hypertension, risk factors.
Avaliação antropométrica em pacientes diabéticos com acidente vascular cerebral isquêmico
RESUMO - O acidente vascular cerebral (AVC) é uma das causas mais freqüentes de mortalidade e de inca-pacidade. Os fatores de risco para o AVC incluem idade, gênero, diabetes mellitus (DM), hipertensão art e-rial e muitos outro s . Objetivo:Avaliar obesidade e hipertensão arterial em pacientes diabéticos acometi-dos por AVC isquêmico (AVC-I) agudo. Método:Comparar as variáveis antropométricas entre pacientes diabéticos (grupo estudo) e não diabéticos (grupo controle). Avaliamos um total de 60 pacientes divididos em dois grupos: 34 pacientes não diabéticos e 26 pacientes com DM tipo 2. Resultados:A prevalência de obesidade foi muito elevada entre os grupos estudados, assim como a hipertensão, não havendo difere n ç a e n t re os valores da relação abdome-quadril (RAQ) do grupo estudo comparando com a do grupo contro l e .
Conclusão:A prevalência de obesidade foi muito elevada entre os grupos estudados e houve predomínio de obesidade do tipo andróide. Não houve diferença significativa na avaliação antropométrica pela medi-da medi-da RAQ e medi-da cintura entre os grupos.
PA L AV R A S - C H AVE: acidente vascular cerebral, diabetes mellitus, antropometria, trombose cerebral, hipert e n-são arterial, fatores de risco.
S t roke is the third leading cause of death in the United States and the main cause of neuro l o g i c a l i m p a i rment in adults. Each year, about 500000 Ameri-cans suffer from new strokes or from re c u rrences of this disease. According to the American Heart Associa-tion Supplement (1997) and Brazilian studies, near-ly 25% of these people die1 - 3. Strokes are one of the
most common causes of mortality and long term seve-re disability. Theseve-re is an association between higher incidence of stroke and aging. In addition, stro k e death rates are typically higher for men than for wo-men and rates for black population are commonly
twice as high as those for white. Risk factors for stro-ke include age, gender, diabetes mellitus (DM), hyper-tension, impaired glucose tolerance, hyperu c e m i a , smoking, family history of ischemic heart disease (IHD), history of hyperlipidemia, lipoprotein (Lp, total c h o l e s t e rol, high density lipoprotein cholestero l (HDL), low density lipoprotein cholesterol (LDL), very low density lipoprotein cholesterol (VLDL), triglyc-erides, apolipoprotein A (apo A) and B100 (apo B100), and many others.
been decreasing rapidly in developed countries dur-ing the last decades. This is due to the enhancement in control and monitoring of modifiable risk factors2 , 3.
This study aims at evaluating anthropometric mea-surements as a tool to the diagnosis of obesity, and the association with hypertension, in patients aff e c t-ed by acute ischemic stroke, comparing diabetics with non-diabetics.
METHOD
This study evaluated patients with ischemic stroke and was undertaken at the Neurological Clinic of Lauro Wa n d e r-ley University Hospital (HULW), Samaritano and Santa Paula Hospital, located at João Pessoa city, Paraíba State, fro m November 2000 to January 2002.
We excluded patients with nephro p a t h y, cholestases, t h y roid dysfunction, who take drugs that can increase LDL c h o l e s t e rol and decrease HDL cholesterol as corticoids, ana-bolic steroids and pro g e s t e rone, and smokers, which could modify the factors studied and divert us from the purpos-es of our invpurpos-estigation.
A total of 60 patients suffering from acute ischemic stro-ke took part in a case-control study: 26 DM subjects (study g roup) and 34 non-diabetics (control group). This study intended to evaluate the statistical diff e rences between the two groups.
Both groups were submitted to a nutritional evalua-tion through anthropometric parameters.
This re s e a rch was approved by the Ethical Committee of Federal University of Paraiba. Informed consent was ob-tained from each subject or subject’s parents.
A n t h ropometric measurement – The anthro p o m e t r i c m e a s u rements investigated were: waist-hip rati o (WHR), waist circ u m f e rence (WC) and 4 skin folds (triceps, mid-biceps, subscapular and supra-iliac).
WHR was calculated as waist circ u m f e rence (measure d midway between the lower rib margin and the superior anterior iliac spine) divided by hip circ u m f e rence (taken at widest point of the greater trochanters). WHR values ex-ceeding 0.80 in women and 0.95 in m en are indicative of increased risk of cardiovascular complications4.
The waist circ u m f e rence is correlated with the abdom-inal visceral adipose tissue accumulation and values >102 cm in men and >88 cm in women, are critical levels, accord-ing to NCEP- Adult Treatment Panel III5.
The obesity was classified into two types. The android type shows a dominant visceral and upper thoracic distri-bution of adipose tissue, whereas in the gynecoid type adi-pose tissue is found predominantly in the lower part of the body (hips and thighs). Both types of fat distr ibution are associated with metabolic disturbance and a higher inciden-ce of cardiovascular morbidity and mortality4.
High blood pre s s u reis defined as a systolic pre s s u reof >140 mmHg and a diastolic pressure of >90 mmHg5.
Skinfold thickness was measured at the right side of the body at the biceps, triceps, subscapular, and suprailiac sites
using standard calipers (Lange, Cambridge MD, USA) and following standard procedures6.
The sites and norms used for skinfolds measurements are : 1. Triceps skinfold: hold the skin and the subcutaneous tissue 1 cm above the medium point between the edge of the acromial process of the scapula and the olecranon pro-cess of ulna. The fold must stand parallel to the biggest axis of the arm. We must be careful and make sure that the m e a s u rement is done in the average line of the posterior face and that the arm is relaxed and in the vertical position. 2. Biceps skinfold: lift the cutaneous fold of the arm anterior face, directly above the centre of the cubital fos-sa, in the same level of the triceps fold and the a rm cen-tral circ u m f e rence. The arm must hang relaxed, parallel to the patient body, and the fold ridge must be parallel to the arm axis.
3. Subscapular skinfold: the skin is lifted 1 cm above the inferior angle of the scapula, the patient arm and should e r being relaxed. The fold must be parallel to the natural lines of the skin; usually these lines are at 45º from the horizon-tal lines that extends themselves medially and cranially.
4. Supra-iliac skinfold: the skin is lifted 2 cm above the iliac crista in the axillar medium line. The ridge of this fold must stand horizontally.
The measurements of the skinfolds were done in the right half of the body, the limbs standing in an orthostat-ic position and relaxed. Measurements were done i n the left half, when the patient presented w ith a right motor deficit.
In evaluating the patients, we found that these rates w e re better than the relation w eight-height or the body mass index (BMI), once most of the patients can not stand in orthostatic position due to the focal motor deficit.
The calculation of the equivalent content of fat, with the percentage of body weight for an age group, was ob-tained by summing up the four folds previously mentioned, and it was applied to a table according to Durnin and Wo-n e r s l e y7, for men and women in diff e rent ages. These re s u l t s w e re applied to another table of fat percentage for men and women, according to Pollock and Wi l m o re8, who sub-divided them into the following levels: too bad, bad, below the average, average, above the average, good, excellent according to the age.
Katch and McAardle observed than men with more than 20% of fat body weight and women with more than 30% a re considered obeses9, what contributes to the metabol-ic syndrome and atherogenesis10.
RESULTS
Epidemiological data of the groups –This
case-c o n t rol study analyzed 60 patients with iscase-chemicase-c stro-ke. The sample consisted of 26 diabetics (15 men and 11 women, whose mean age was 66.35±9.92 years old) corresponding to the study group and 34 non-diabetics (22 men and 12 women, whose mean age was 66.71±10.83 years old) corresponding to the c o n t rol group. Then, statistical diff e rences were eval-uated.
The average age of the patients, considering the study group and the control group, was 66.55±1 0 . 3 6 (X±SD). The lowest age was 40 years old and the highest was 91. Half of the patients were below 67 years old; 65 years being the most common age among them.
The levels of arterial pre s s u re were high in 78.3%
of the patients, considering both groups (38.3% in control group and 40% in the study group).
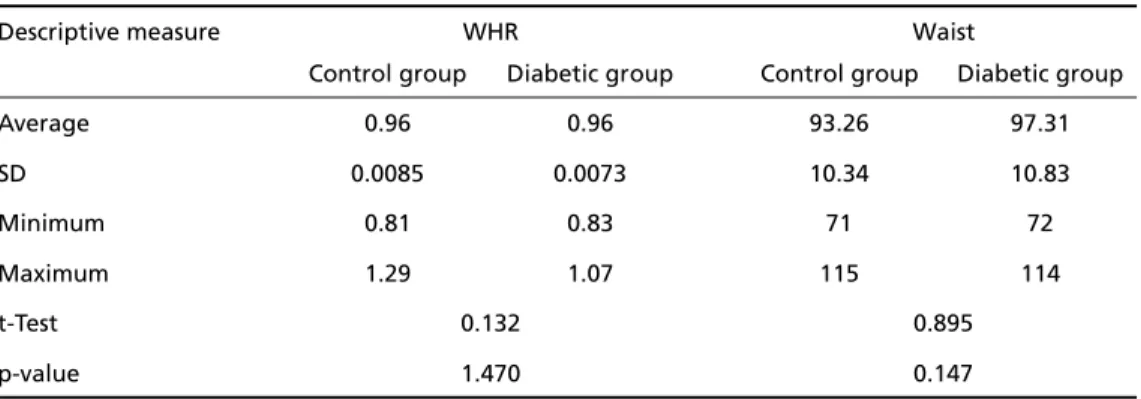
A n t h ropometrical index –The averages, the stan-d a rstan-d stan-deviation (X±SD) and the minimum and maxi-mal values of WHR and waist in each group are shown in Table 1.
A c c o rding to the qui-square test, there was not any evidence of association between the WHR and the studied groups (2=1.92; p=0.307), as it can be
seen by Table 2.
The qui-square test was applied to the data fro m Table 3 and presented a value equal to 0.56 with p-value = 0.627, which shows that there is not an asso-ciation between abdominal obesity (according to the evaluation of the waist circ u m f e rence) and the stud-ied groups.
Table 2. Distribution of WHR values in type 2 DM patients and control subjects.
WHR
Group Abnormal Normal Qui-Square p value
n % n %
Type 2 DM 24 40.0 2 3.3
Control 27 45.0 7 11.0 1.92 0.307
Total 51 85.0 9 15.0
WHR abnormal in men >0.95 and in women > 0.80.
Table 3. Distribution of waist values in type 2 DM patients and control subjects.
Waist
Group Abnormal Normal Qui-Square p value
n % n %
Type 2 DM 14 23.3 12 20.0
Control 15 25.0 19 31.7 0.56 0.627
Total 29 48.3 31 51.7
Table 1. Descriptives measures of WHR and waist, and comparison with tTest for diabetic and nondia -betic control group.
Descriptive measure WHR Waist
Control group Diabetic group Control group Diabetic group
Average 0.96 0.96 93.26 97.31
SD 0.0085 0.0073 10.34 10.83
Minimum 0.81 0.83 71 72
Maximum 1.29 1.07 115 114
t-Test 0.132 0.895
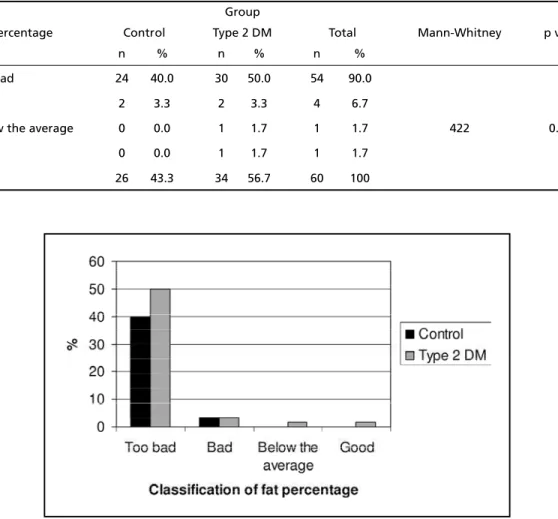
We can observe by Table 4 that 90% of the pa-tients presented a fat percentage in a “very bad” lev-el. From the 26 patients of the control group, 92% p resented a fat percentage in a “very bad” level, and 88% in the study group.
The Mann-Whitney test was applied (Table 4) in o rder to compare the classification of fat perc e n t a g e per group, showing no evidence of statistically signi-ficative difference between both groups, (p>0.566). These observations can be seen in Figure.
DISCUSSION
G roups’ characteristics –Sixty patients suff e r i n g f rom acute ischemic stroke, being 26 diabetics (study g roup) and 34 non-diabetics (control group), took part in this study. The Odds Ratio (OR) for sex and gro u p was not significative (OR=0.744, p>0.05), re v e a l i n g that both, men and women, are susceptible to the same risks of contracting that disease. These re s u l t s d i ffer from the ones obtained by Pradhan et al.1 1, in
which women seem to be susceptible to a higher risk of contracting coro n a ry disease; however, they are
similar to the results obtained by Hart et al.1 2, who
c o m p a red risk factors to stroke in men and women.
R e g a rding age, we obtained results in accord a n c e to the ones in literature, with averages and standard deviations of 66.55±10.36 years old. Diabetes did not have a significative influence in the precocity of s t roke, once the average age was similar in both g roups. In the casuistry of Broderick et al.3, the
pati-ents above 55 years old suff e red more than others from stroke attacks.
In the sample, the age of the patients ranged f rom 40 to 90 years. In the study group, the average and the standard deviation ranged from 66.35 ± 9 . 9 2 years, and in the control group, from 66.71 ± 1 0 . 8 3 years, which is in accordance with established in the literature.
A n t h ropometric profile –Obesity is a chronic dis-ease that has been increasing significatively world-wide; being one of the main risk factors for the devel-oping of diabetes type 2 and, consequently, ischemic stroke13.
Table 4. Distribution of fat percentage in type 2 DM patients and control subjects.
Group
Fat percentage Control Type 2 DM Total Mann-Whitney p value
n % n % n %
Too bad 24 40.0 30 50.0 54 90.0
Bad 2 3.3 2 3.3 4 6.7
Below the average 0 0.0 1 1.7 1 1.7 422 0.566
Good 0 0.0 1 1.7 1 1.7
Total 26 43.3 34 56.7 60 100
The pattern distribution of body fat and visceral adipose, when altered, can induce to the emerg e n c e of both DM and glucose intolerance, being re l a t e d to ages below 65 years old. The predominance of DM type 2 reaches 16% in men and 12.8% in women f ro m 75 to 84 years old. Above 65 years old, the DM and the glucose intolerance reaches 30% to 40% in the patients from the Framingham study14.
We observed that there was no significative dif-ference between the WHR, the waist circumdif-ference and the fat percentage; thus, characterizing a gro u p homogeneity (Table 1).
As to the checking of the cutaneous folds values, in the left or right side of the body, Wo m e r s l e y, Dur-nin cited by DurDur-nin, Wo m e r s l e y7did not find
statis-tical diff e rences when evaluating the fat perc e n t a g e using the measures of the cutaneous folds in the right side in comparison to the ones of the left side. On the other hand, studies undertaken by Gwinup, Chel-vam and Steinberg1 5, comparing the superior limb of
tennis players in activity to the other limb without a c t i v i t y, concluded that there was no significative dif-ference as well.
The study group presented body fat perc e n t a g e average similar to that of the control group, which was considered above the average in 96.7% of the cases. It can be observed from Table 4, that 90% of the patients presented a fat percentage in a “very bad” level. From 34% of the control group patients, 92% of them presented this same level of fat perc e n-tage, and the diabetic group, 88%. It is relevant to point out that, among the 60 patients studied, only one individual presented a fat percentage consid-e rconsid-ed “good” (1.7%). Thconsid-e waist-hip ratio prconsid-e s consid-e n t consid-e d average and standard deviation of 0.96±0.0085 in the control group, and 0.96±0.0073 in the study g roup; 85% of the patients were out of the norm a l-ity limit, from these, 40% belonged to the diabetic g roup and 45% to the control group. The abdomin a l o b e s i t y, translated by the waist circ u m f e rence in the p resence of overweight, is associated to the insulin resistance as well as to the metabolic syndrome, being m o re correlated to metabolic risk factors than to the isolated increasing of BMI. There f o re, the simple mea-s u rement of the abdominal circ u m f e rence imea-s re c o m-mended to identify the risk component5.
The percentage of male patients, suffering from stroke, that presented an abdominal circumference value higher than 102 cm was 18.3%, and 30% of fe-male patients were higher than 88 cm. Comparing women among themselves, it was observed that
78.3% of them were out of the limit of abdominal circumference normality, and 29.7% of the men.
The values of the waist, presented by Table 3, point out the diabetic group, in which the average value is higher than that of the group control, i.e., the average value of the waist of diabetics is 4.3% higher than the average waist of the control gro u p ; although, besides this slight diff e rence, there was no association between obesity (according to the waist c i rc u m f e rence evaluation) and the studied groups (2
=0.56, p=0.627). There f o re, the data from the pre s-ent study of percs-entage and distribution of body fat can possibly point to the existence of insulin re s i s t-ance in both studied groups, even if the basal level of insulinemia had not presented a conclusive re s u l t regarding such a hypothesis.
The abdominal circ u m f e rence presented itself as a rate of adiposity better than the other rates, re p o rt-ing a strong risk factor to health, once it is re s p o n s i-ble to the accumulation of abdominal fat. The advan-tage of this adiposity rate consists in not being influ-enced by height16. This fat distribution in the
abdo-men seems to be a metabolically active tissue, con-stantly renewing itself. In addition, in relation to lipo-lyses, this tissue seems to be more sensitive to cate-cholamines, which differs from the pre s e rvative action of the insulin1 7. These results show a small diff e re n c e
between the two groups, in spite of the fact that the small quantity of obese people in the diabetic gro u p called our attention to the work of Nawawi et al.18,
which shows the severity in the association of more than one risk factor. The diabetes type 2 and the obe-sity are associated to atherogenic risk factors19,20.
In the literature, there are many studies showing an increase in the metabolic activity of the visceral fat, which would be more responsive to an activa-tion of the hypothalamus-hypophisis-adrenal axis in individuals with a BMI incre a s e5 , 1 0. Regarding the
vis-ceral obesity clinically translated, although not pre-c i s e l y, bepre-cause of the inpre-crease in the WHR, it is been o b s e rved an increase in the production of athero-genic lipoproteins, in part i c u l a r, the LDL. Besides, the increase of free fatty acid can constitute a substract to a higher hepatic production of VLDL, rich in triglyc-e r i d triglyc-e s2 1. However, the authors of this present re s
p reviously re p o rted, and the WHR was considered as a determinant independent of the Lp(a) concentra-tion, both in patients with DM type 1 and patients with DM type 22 3 , 2 4. By the contrary, such a corre l
a-tion was not found in non-diabetics patients25.
A therapeutical objective in the control of the main risk factors of stroke, such as the hypert e n s i o n , very frequent in both groups, is to find a drug with a good tolerance profile to treat patients with over-weight or android obesity, without bringing altera-tions in the metabolism of carbonate hydrates and lipids26.
S t roke places a tremendous burden on health re-s o u rcere-s throughout the world. Improved detection and modification of risk factors can reduce the impact of this disease. The strong association between dia-betes mellitus and obesity suggests that these fac-tors must be strictly controlled.
In conclusion, the predominance of obesity was v e ry high among the studied groups, and there was a prevalence of the android type obesity, suggesting that there is a possible insulin resistance in the pro-cess. There was no significative diff e rence in the an-t h ropomean-tric evaluaan-tion by an-the measuremenan-t of WHR and the waist in the groups. Only arterial hyperten-sion was higher in the diabetic patients compared to the non-diabetic ones.
REFERENCES
1. Lessa I. Epidemiologia das doenças cere b ro v a s c u l a res no Brasil. Rev Soc Cardiol Estado de São de Paulo 1999;4:509-518.
2. Sacco RL. Risk factors and outcomes for ischemic stroke. Neuro l o g y 1995;45:510-514.
3. B roderick JP, Brott T, Tomsick T, Huster G, Miller R. The risk of sub-aracnoid and intracerebral hemorrages in blacks as compared with whites. N Engl J Med 1992;326:733-736.
4. Fernandes J Filho. A prática da avaliação física: testes, medidas e avalia-ção física em escolares, atletas e academias de ginástica. Rio de Janeiro : SHAPE, 1999.
5. Executive Sumary of the Third Report to the National Cholestero l Education Program (NCEP) Expert panel on detection evaluation and t reatment of high blood cholesterol in adults (Adult Treatment Panel III), JAMA 2001;285:16-19.
6. Wa i t z b e rg DL, Ferrini MT. Exame físico e antropometria. In Wa i t z b e rg D L (ed). Nutrição oral, enteral e parenteral na prática clínica, 3.ed. São Paulo: Editora Atheneu 2000:16-17.
7. Durnin JV, Womersley J. Body fat assessed from total bodydensity and its estimation from skinfold thickness: measurements on 481 men and women aged from 16 to 72 years. Br J Nutr 1974;32:77-97.
8. Pollock ML, Wi l m o re JH. Exercícios na saúde e na doença: avaliação e p rescrição para prevenção e reabilitação. 2.ed. Rio de Janeiro: Medsi 1993:43-45.
9. Katch FI, Mcardle WD. Prediction of body density from simple anthro-pometric measurements in college-age men and women. Hum Biol 1973;45:445-454.
10. Zhu S, Wang Z, Shen W, Heymsfield SB, Heshka S. Percentage body fat ranges associated with metabolic syndrome risk: results based on the third National Health and Nutrition Examination Survey (1988-1994). Am J Clin Nutr 2003; 78:228-235.
11. Pradhan AD, Skerrett PJ, Mason JE. Obesity, diabetes and coronary risk in woman. J Cardiovasc Risk 2002;9:323-330.
12. Hart CL, Hole DJ, Smith GD. Comparisom of risk factors for stro k e incidence and stroke mortality in 20 years of follow-up in man and women in the Renfrew/Paisley study in Scotland. Stroke 2000;31: 1893-1896.
13. S i l v e s t reJA. Hospitalizações SUS 1997. Coordenadoria da Atenção à Saúde do Idoso. Ministério da Saúde.
14. Kannel WB. Fifty years of Framinham Study contributions to under-standing hypertension. J Hum Hypertens 2000;14:83-90.
15. Gwinup G, Chelvam R, Steinberg T. Thickness of subcutaneous fat and activity of underlying muscles. Ann Intern Med 1971;74:408-411. 16. Lean MEJ, Han TS, Seidell JC. Impairment of health and quality of life
in people with large waist circumference. Lancet 1998;351:853-856. 17. L a rge V, Arner P. Regulation of lipolysis in humans. Pathophysiological
in obesity, diabetes, and hyperlipidaemia. Diabetes Metab 1998;24: 409-418.
18. Nawawi HM, Muhajir M, Kian YC, Mohamud WN, Yu s o ff K, Khalid BA. Type of diabetes and waist-hip ratio are important determinants of serum lipoprotein (a) levels in diabetic patients. Diabetes Res Clin Pract 2002;56:221-227.
19. Wilson PW, Kannel WB. Obesity, diabetes, and risk of card i o v a s c u l a r disease in the elderly.Am J Geriatr Cardiol 2002;11:119-123. 20. Bjorntorp P. The origins and consequences of obesity. Diabetes. Ciba
Found Symp 1996;201:68-80.
21. Bener A, Zirie M, Al-Rikabi A. Genetics, obesity, and enviro n m e n t a l risk factors associated with type 2 diabetes. Croat Med J 2005;46: 302-307.
22. Holanda MM, Filizola RG, Costa MJ, Andrade RV, Silva JA. Plasma l i p o p rotein(a) levels: a comparison between diabetic and non-diabet-ic patients with acute ischemnon-diabet-ic stroke. A rq Neuropsiquiatr 2004; 62: 233-236.
23. Gambhir JK, Kaur H, Gambhir DS, Prabhu KM. Lipoprotein(a) as an independent risk factor for coronary artery disease in patients below 40 years of age. Indian Heart J 2000;52:411-415.
24. Poon M, Zhang X, Dunsky KG. A p o p l i p o p rotein(a) induces monicyte chemotactic activity in human vascular endothelial cells. Circ u l a t i o n 1997;96:2514.
25. Gillum RF. Indices of adipose tissue distribution, apolipoproteins B and AI, lipoprotein (a), and triglyceride concentration in children aged 4 - 11 years: the Third National Health and Nutrition Examination Survey. J Clin Epidemiol 2001;54:367-375.