Introduction
Obesity is considered a chronic and progressive disease that is associated with metabolic and cardiovascular complications1,2. Its treatment requires a combination of regular physical activity and healthy eating habits, in order to achieve weight reduction and long-term weight loss maintenance3,4. The challenge is to monitor the therapeutic response of obese individuals, who are under the inluence of environmental, hormonal and genetic factors that interfere in body weight reduction and control5.
Genetic factors, such as the presence of polymorphisms in adrenergic receptor (ADR) encoding genes, have been associ-ated with changes in energy regulation and expenditure6. In fact, polymorphisms in the gene encoding β2 adrenergic receptor (ADRB2) may change the thermogenic efects of catecholamines, being associated with the presence of obesity and weight regain7,8, and may also alter lipolysis9. Therefore, allelic variants in genes associated with energy expenditure may negatively inluence the reduction of adipose tissue10 and weight reduction11.
Intervention programs that include physical exercise and restrictive diet have efective results in weight loss in obese adults12. However, in adolescents, physical activities associ-ated with nutritional guidance for healthy and balanced eating habits is recommended13, which can promote the reduction of body fat14, abdominal obesity and insulin resistance15,16, as well
as the reduction of obesity-associated chronic inlammation14. Speciic genetic variants may interfere in the metabolic re -sponse to training, contributing to the variability in individual response to exercise training17. In this context, the polymorphism Gln27Glu (rs1042714) in the ADBR2 gene, in which substitu-tion of a cytosine for a guanine leads to amino acid changes at protein position 27 (substitution of glutamine (Gln) for glutamic acid (Glu), appears to be important. In adults, although exercise increases the activity of the sympathetic nervous system, this re-sponse was impaired in obese women carriers of the 27Glu allele18, whereas obese subjects with homozygous genotype (Gln27Gln) beneitted from physical activity in order to reduce weight19.
In the treatment of obese adolescents, combined exercises has been used with excellent metabolic20and inlammatory responses14and seems to more efective in improving the vis -ceral fat than aerobic training alone21, and induce the same efects in itness that isolated aerobic and resistance training do22. Nevertheless, the impact that the Glu27 allele may have
on inlammatory parameters in response to combined training have not been assessed. Thus, this study aimed to compare anthropometric, metabolic and inlammatory parameters of overweight adolescents, carriers and noncarriers of the Glu27 allele of ADRB2 gene, after 12 weeks of combined training. Original Article (short paper)
ADRB2 Gln27Glu polymorphism inluenced changes in leptin but not body
composition or metabolic and other inlammatory parameters after twelve weeks
of combined training in overweight adolescents
Neiva Leite1, Larissa Rosa da Silva1, Íncare Correa de Jesus1, Wendell Arthur Lopes2, Claudia Regina Cavaglieri3, Cássio Leandro Consentino4, Rosana Bento Radominski4,Ricardo Lehtonen Rodrigues de Souza4, Luciane Viater
Tureck5, Lupe Furtado-Alle6
1Universidade Federal do Paraná, UFPR, Curitiba, PR, Brazil; 2Universidade Estadual de Maringá, UEM, Maringá, PR, Brazil; 3Universidade Estadual de CAmpinas, UNICAMP, Campinas, SP, Brazil; 4Universidade
Federal do Paraná, UFPR, Curitiba, PR, Brazil; 5Universidade Tecnológica Federal do Paraná, UTFPR, Ponta Grossa, PR, Brazil; 6Universidade Federal do Paraná, UFPR, Curitiba, PR, Brazil.
Abstract — Aim: To compare the anthropometric, metabolic, and inlammatory parameters of overweight adolescents after 12-weeks of resistance and aerobic training (CT), taking into account the Gln27Glu polymorphism of the β2 adrenergic receptor (ADRB2) gene. Methods: Forty-seven adolescents (15.05±1.07y) were assigned to one of four groups, according to the presence or absence of the Glu27 allele: CT (CarrierT n=11; NoncarrierT n=11) or control (CarrierC n=13; NoncarrierC n=12). Body composition, abdominal fat, maturation, itness, metabolic and lipid proile, inlammatory markers were assessed. The CT consisted of six resistance exercises, followed by 30 min of walking/ running at 50-80% VO2max, totaling 60 min/session, three times a week. A mixed-model factorial ANOVA was used to compare variables at baseline and after 12-weeks. Results: TC was efective in reducing total fat mass (NoncarrierT ES=.45, CarrierT ES=.27) and subcutaneous abdominal fat (NoncarrierT ES=.48, CarrierT ES=.46) and increasing lean mass (NoncarrierT ES=.58, CarrierT ES=.60) and itness. CarrierT group showed a reduction in leptin (ES=.49).
Conclusion: The responses of body composition and physical itness to TC were not inluenced by the presence of the Gln27Glu polymorphism. However, only the Glu27 allele carriers showed reductions in leptin after 12-weeks. Besides, a lack of intervention caused obesogenic efects, especially in Glu27carriers.
Methods
The study was composed of 47 overweight adolescents, aged 12 to 16 years. The sample size was calculated by the G*Power3 software considering an α of 0.05, β of 0.8 and minimal efect size of 0.2, according to the changes in the VO2max of overweight girls who underwent combined training for 12 weeks14. The minimum sample size was of six participants per each groups (total n=24).
They were genotyped for Gln27Glu (rs1042714, C>G) poly-morphism of the ADBR2 gene. The recessive and additive allelic interaction models were also tested, but the dominant model was consistent with our results. Thus, carriers of Gln27Glu and Glu27Glu genotypes were grouped (Glu27 carriers), whereas those with the Gln27Gln genotype were considered noncarriers.
After the genotypes had been identiied, the subjects were grouped according to the presence or absence of the Glu27 al-lele, and then randomly assigned to the training or the control group. Thus, the subjects were divided into four groups: a) CarrierT– Training group consisting of ADRB2 Glu27 allele car-riers (n=11); b) CarrierC – Control group consisting of ADRB2 Glu27 allele carriers (n=13); c) NoncarrierT – Training group consisting of Glu27 allele noncarriers (n=11); and d) NoncarrierC – Control group consisting of Glu27 allele noncarriers (n=12). The NonCarrierC and CarrierC groups were used for the clinical monitoring of the physiological changes that might occur within the 12 weeks, independently of intervention.
The inclusion criteria were BMI Z-score ≥1; Tanner stage 4 or 5; being at a stable weight for two months or longer; not being using anorectic drugs or other drugs that may interfere on weight control and hyperinsulinemia; and having had no exercise in the last 6 months. Exclusion criteria were medical contraindication to exercise; changes in TSH levels; and having participated in less than 70% of the training sessions.
All subjects were informed of the objectives, experimental procedures and possible protocol events. All participants signed an assent form, while their parents or legal guardians signed a consent form previously approved by the Ethics Committee of the Federal University of Paraná (protocol number 2460.067/2011-03).
Assessments
All participants were assessed twice by a multidisciplinary team, at the baseline and after 12 weeks of treatment.
Anthropometry
Height was measured to the nearest 0.1 cm, using a wall stadiom-eter, and weight was measured in kilograms (kg) on a platform scale of the brand Filizola, with 150 kg capacity and accurate to 100 g. Waist circumference was measured to the nearest 0.1 cm, using a lexible non-elastic tape parallel to the ground and placed midway between the iliac crest and the last rib23.
Body Mass Index was calculated by body mass (kg) divided by height squared (m2). The z-score was calculated using the World Health Organization AnthroPlus software. Adolescents with a BMI z-score ≥ 1 were considered overweight.
Body Composition
Body composition was assessed by dual-energy X-ray absorp-tiometry (DXA), using a LunarTM Prodigy, according to the protocol previously described24. The analysis and quantiication of bone mineral content and underlying tissues, total fat mass and fat free mass were performed using the enCore 2008 soft-ware, version 12.30. The assessment was performed by a single trained examiner and the intra-observer coeicient of variation was 0.1% for total mass; 2.4% for fat mass; 3.06% for trunk fat mass; and 1.64% for the fat percentage.
Muscular Strength
Muscular strength was assessed by 1RM testing in the bench press, leg press and arm curl, after a period of familiarization with the resistance-training exercises. The 1RM protocol was conducted according to Brown and Weir25. The tests were later used for the prescription of the intensity of the exercises per-formed during the intervention with resistance training.
Cardiorespiratory Fitness
Cardiorespiratory itness was assessed with a treadmill test, using the X-Fit 7 Power Treadmill and a breath-by-breath gas analyzer (K4b², Cosmed, Italy). Prior to the beginning of the test, in order to warm up and get used to the treadmill, the subjects walked on it for 2 minutes. We used the modiied treadmill ramp protocol, starting at 4 km/h and 1% slope, with increments of 0.3 km/h every 30 seconds and a constant slope of 1% until maximum efort was achieved26. The test was considered maximum if at least two of the following criteria were met: a) exhaustion or inability to maintain the required speed; b) HR at or above 200 bpm, and c) respiratory exchange ratio (RER) equal to or greater than one. Maximum oxygen consumption (VO2max) was calculatedas described above22.
Biochemical analyses
Blood samples were collected by a qualiied professional in the morning, after 12 hours of fasting. Post-training blood collec-tion occurred 72 hours after the last training session. For the cytokine assays, the serum was extracted and frozen at -80° C for later analysis. The interleukin-6 (IL-6), C-reactive protein (CRP), leptin and adiponectin serum levels were determined by ELISA (solid-phase, enzyme-linked immunosorbent assay), using high sensitivity kits (R & D Systems, Minneapolis, USA) and following the manufacturer’s instructions.
sensitivity (IS) were assessed using the Homeostasis Model Assessment (HOMA)28 and the Quantitative Insulin Sensitivity Check Index (QUICKI), respectively29.
Genetic analyses
Leukocyte DNA extractions were performed using the method by Lahiri and Nurnberger30. The obtained DNA was diluted to a inal concentration of 20ng/uL. ADBR2 Gln27Glu polymorphism was genotyped using a TaqMan allelic discrimination assay and performed on a 7500TM Real-Time PCR System (Applied Biosystems, Foster City, CA, USA). The following PCR protocol was used: step 1, 2 minutes at 50°C; step 2, 10 minutes at 95°C; and step 3, 50 cycles of 15 seconds at 95°C followed by 1 minute at 62°C.
Subcutaneous and visceral abdominal ultrasonography Visceral and subcutaneous adiposity measurements were per-formed according to Vlachos, Hatziioannou, Perelas, Perrea31, using a portable ultrasound device of the brand GE, model Logiq Book XP, for high-resolution ultrasonography, with 8 MHz linear transduction. The intra-observer coeicients for visceral and subcutaneous fat measures were 1.92% and .36%, respectively.
Dietary assessment
Nutritional assessment was evaluated by a 24-h food record (R24h)32, before and after the intervention. The instrument was applied by a nutritionist, in two non-consecutive days. The recalls were tabulated on the Diet Pro® 5.5 software to obtain the information related to total energy consumption (TEC), carbohydrates, proteins and lipids, and were presented in kilocalories and grams. The participants were requested not to change their usual food intake during the intervention.
Intervention Program
The combined training (CT) protocol consisted of resistance training (RT) and aerobic training (AT) performed in the same session, three times a week and divided into three phases (P1, P2 and P3), each consisting of 4 weeks of training. RT was composed of six exercises and aerobic training AT consisted of walking/running in an athletic track (Table 1). The charac-The charac-terization of the training sessions and intensity progression has been previously described14. The RT workloads were adjusted weekly. The participants were encouraged to perform the great-est number of repetitions when they came to the last set of each exercise, maintaining the same range of motion and execution speed previously determined. The workloads were increased by 1 kg for lower body and ½ kg for upper body for each repetition performed over the established training protocol in the last set of the last training session of the week.
Statistical analysis
Normal distribution of data was veriied by Shapiro-Wilk test. The chi-square test was used to compare proportions between genders by group. Due to the small number of subjects per group, a natural logarithm was applied to normalize the data. Between-group comparisons were conducted by using ANOVA one-way for parametric data and the Kruskal-wallis test for nonparametric data at baseline. Statistical signiicance for multiple comparisons was deined at the corrected α=.0083 for baseline comparisons. Comparisons of anthropometric, it -ness, body composition, ultrasound and metabolic parameters between baseline and post-treatment (time factor) and between groups (group factor) were performed using a mixed-model factorial ANOVA. The equality of variance was assessed by the Levene’s test. Observed efect size (ES) for each group was calculated by Cohen’s d33.The analysis of the changes between the NoncarrierC and CarrierC groups was performed based on the observed magnitude of the efect33. Comparisons between subjects were performed by Wilcoxon signed-ranks test with
Table 1. Combined training programme.
Resistance Exercise
P1 (1-4 wk) P2 (5-8 wk) P3 (9-12 wk)
Set
(n) Rep(n) (RM)Load (min)Rest Set(n) Rep(n) (RM)Load (min)Rest Set(n) Rep(n) Load(RM) (min)Rest
Leg press 3 10 10RM 1 3 8 8RM 1.5 3 6 6RM 2
Leg extension 3 10 10RM 1 3 8 8RM 1.5 3 6 6RM 2
Leg curl 3 10 10RM 1 3 8 8RM 1.5 3 6 6RM 2
Bench press 3 10 10RM 1 3 8 8RM 1.5 3 6 6RM 2
Lateral pull-down 3 10 10RM 1 3 8 8RM 1.5 3 6 6RM 2
Arm Curl 3 10 10RM 1 3 8 8RM 1.5 3 6 6RM 2
Aerobic Exercise
< VT (min)
= VT (min)
VT – RCP (min)
= RCP (min)
< VT (min)
< VT (min)
= VT (min)
VT – RCP (min)
= RCP (min)
< VT (min)
< VT (min)
= VT (min)
VT – RCP (min)
= RCP (min)
< VT (min) Walking/
Running 5 10 10 5 5 - 10 10 5 3 - 12 10 5
split ile by group for variables that did not show normality. The p≤.05 value was considered statistically signiicant.
Results
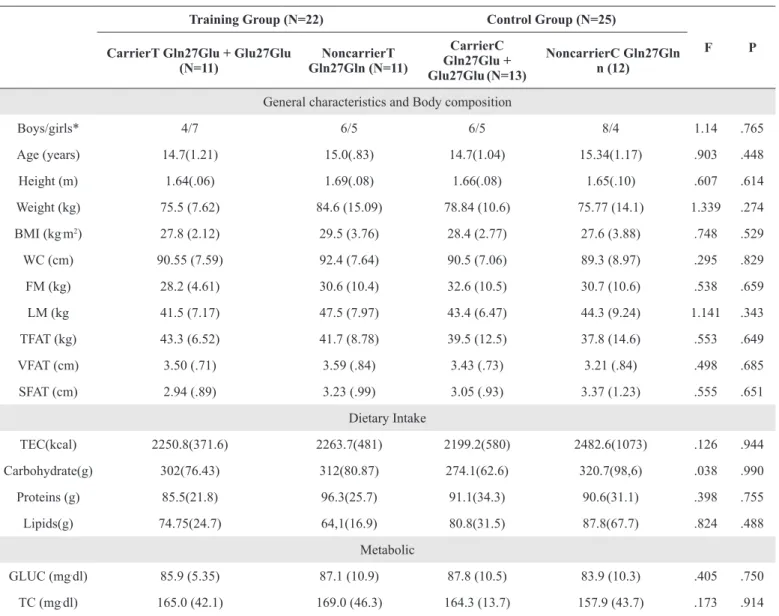
All adolescents were in the post-pubertal stage. There were no diferences between groups on anthropometric, body composi -tion, metabolic, and physical itness variables at baseline. The NonCarrierT group had higher levels of adiponectin than the NoncarrierC group, but lower levels than the CarrierC group, while the CarrierT group had higher levels of adiponectin than the NoncarrierC group and the NoncarrierT group. IL-6 levels were greater in the NoncarrierC group than in the CarrierT group, but smaller when compared to the NoncarrierT group. As for the IL-10 levels, the NoncarrierT group had higher levels when compared to the other three groups. Moreover, the NoncarrierC group had higher levels than the CarrierT group (Table 2).
After 12 weeks of training, there were no diferences between
NoncarrierT and CarrierT with regards to BM, height, BMI, WC, SFAT, GLUC, TC, HDL-c, LDL-c, VLDL, TG, Leg press and arm curl. The NoncarrierT group had a higher frequency of subjects with increased INS levels (Z=-2.401; p=.016) and reduced QUICKI values (Z=-2.045; p=.041) than the CarrierT group (Table 3).
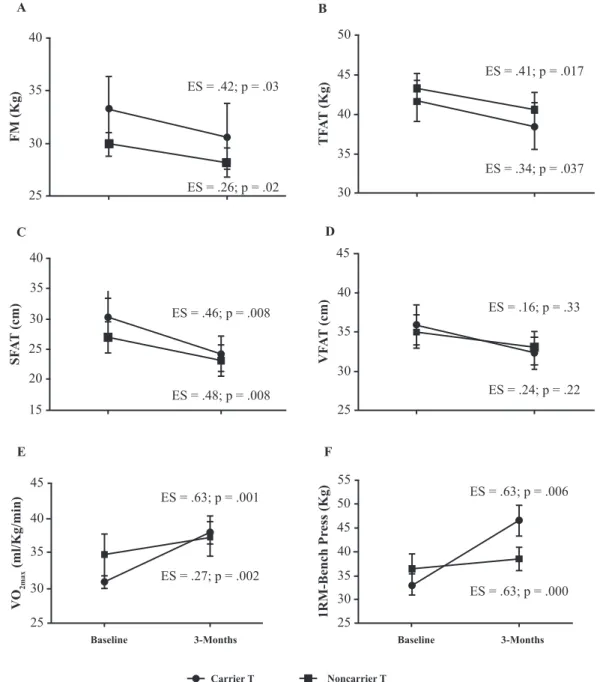
Both groups showed a reduction in FM and TFAT. Nevertheless, the CarrierT group showed a possibly beneicial efect, whereas for the NoncarrierT group the efect was prob -ably trivial. VFAT reduction and LM increase were similar between groups, since both showed a probably trivial efect. Both groups showed possibly beneicial efects for increased bench press strength and reduced subcutaneous abdominal fat. However, the CarrierT group showed a possibly beneicial efect for VO2max, whereas the NoncarrierT only exhibited a probably trivial efect (Figure 1).
On the inlammatory markers, the CarrierT group showed an increase in IL-6 levels with an unclear efect size, whereas the NonCarrierT group had a reduction in IL-6 levels after 12 weeks of training, with a possibly beneicial efect. Of the
Table 2. Baseline characteristics of the training group and control group, both divided into carrier and noncarrier.
Training Group (N=22) Control Group (N=25)
F P
CarrierT Gln27Glu + Glu27Glu
(N=11) Gln27Gln (N=11)NoncarrierT
CarrierC Gln27Glu +
Glu27Glu(N=13)
NoncarrierC Gln27Gln n (12)
General characteristics and Body composition
Boys/girls* 4/7 6/5 6/5 8/4 1.14 .765
Age (years) 14.7(1.21) 15.0(.83) 14.7(1.04) 15.34(1.17) .903 .448
Height (m) 1.64(.06) 1.69(.08) 1.66(.08) 1.65(.10) .607 .614
Weight (kg) 75.5 (7.62) 84.6 (15.09) 78.84 (10.6) 75.77 (14.1) 1.339 .274
BMI (kg.m2) 27.8 (2.12) 29.5 (3.76) 28.4 (2.77) 27.6 (3.88) .748 .529
WC (cm) 90.55 (7.59) 92.4 (7.64) 90.5 (7.06) 89.3 (8.97) .295 .829
FM (kg) 28.2 (4.61) 30.6 (10.4) 32.6 (10.5) 30.7 (10.6) .538 .659
LM (kg 41.5 (7.17) 47.5 (7.97) 43.4 (6.47) 44.3 (9.24) 1.141 .343
TFAT (kg) 43.3 (6.52) 41.7 (8.78) 39.5 (12.5) 37.8 (14.6) .553 .649
VFAT (cm) 3.50 (.71) 3.59 (.84) 3.43 (.73) 3.21 (.84) .498 .685
SFAT (cm) 2.94 (.89) 3.23 (.99) 3.05 (.93) 3.37 (1.23) .555 .651
Dietary Intake
TEC(kcal) 2250.8(371.6) 2263.7(481) 2199.2(580) 2482.6(1073) .126 .944
Carbohydrate(g) 302(76.43) 312(80.87) 274.1(62.6) 320.7(98,6) .038 .990
Proteins (g) 85.5(21.8) 96.3(25.7) 91.1(34.3) 90.6(31.1) .398 .755
Lipids(g) 74.75(24.7) 64,1(16.9) 80.8(31.5) 87.8(67.7) .824 .488
Metabolic
GLUC (mg.dl) 85.9 (5.35) 87.1 (10.9) 87.8 (10.5) 83.9 (10.3) .405 .750
LDL-c(mg.dl) 83.1 (25.2) 94.6 (36.5) 87.9 (7.89) 83.5 (26.9) .480 .698
HDL-c(mg.dl) 59.1 (14.5) 55.4 (11.6) 56.0 (8.83) 54.3 (14.2) .316 .814
VLDL (mg.dl) # 20.7 (13.7) 19.02 (6.56) 21.8 (8.56) 20.59 (9.81) .571 .903
TG(mg.dl) # 103.3 (68.36) 95.1 (32.8) 109 (42.8) 102.9 (49.06) .571 .903
INS(μU.mL) # 17.6 (11.19) 15.6 (6.37) 16.7 (6.85) 14.83 (8.26) 3.146 .370
HOMA-IR# 3.68 (2.12) 3.34 (1.29) 3.53 (1.46) 3.01 (1.72) 3.146 .379
QUICKI .326 (.031) .323 (.018) .323 (.019) .332 (.020) .424 .737
Inlammatory markers
IL-6(pg.mL) 1.51 (.80) 3.31 (3.05) 1.51 (.75) 1.70 (.63)c 4.431 .009
CPR(mg.L) 1.90 (1.92) 3.36 (3.73) 1.65 (2.15) 1.70 (1.74) .802 .501
TNF-α(pg.mL)# 4.77 (6.03) 2.02 (.99) 1.55 (1.11) 5.03 (5.26) 5.605 .132
Leptin(ng.mL# 41.0 (32.1) 33.9 (20.9) 32.6 (22.4) 42.7 (54.6) .239 .971
Resistin(ng.mL) 9.30 (3.71) 8.48 (3.60) 8.55 (4.64) 7.94 (1.64) .358 .784
Adiponectin(ng.
mL) 9.70 (7.43) 7.39 (4.60)
d.f 7.65 (3.73) 6.14 (3.04)a,.c 23.50 .000
IL-10(pg.mL) .313 (.19) .369 (.16)d.f .306 (.20) .350 (.19)a.c 26.78 .000
Fitness VO2max(ml.
kg.1min.-1) 30.9 (2.89) 34.3 (7.24) 34.9 (6.42) 36.3 (7.44) .125 .306
1RM_Legpress 177 (35.7) 183.8 (61.9) 176.4 (35.9) 182.5 (53.6) .067 .977
1RM_Bench
press# 33.1 (7.16) 36.4 (10.82) 34.7 (8.4) 36.8 (12.08) 1.943 .584
1RM_Arm curl
19.9 (3.45) 20.91 (5.09) 19.9 (3.51) 21.1 (6.26) .193 .900
Variable testing by chi-square, #variable testing by Krukal-wallis. aNoncarrierC vs CarrierC; bNoncarrierC vs NoncarrierT; cNoncarrierC vs CarrierT; dCarrierC vs NoncarrierT; eCarrierC vs CarrierT; fNoncarrierT vs CarrierT. ES= Efect size; BMI= body mass index; WC= waits circumference;; FM= fat mass; LM= lean mass; TFAT = trunk fat; VFAT = visceral fat; SFAT = subcutaneous fat; INS= insulin, GLUC= glucose; HOMA-IR = homeostasis model assessment; QUICKI = quantitative insulin sensitivity check index; TC = total cholesterol; HDL-c = high-density lipoprotein; LDL-c = low-density lipoprotein; TG=triacylglycerol; TNF-α = tumour necrosis factor-alpha; IL = interleukin; VO2max = maximal oxygen consumption; 1RM= one-repetition maximum test.
subjects who trained, those in the CarrierT group showed a higher frequency of reduced leptin levels after 12 weeks of train-ing when compared to those in the NoncarrierT group, with a
possibly beneicial efect. Both groups had reduced adiponectin and CRP levels after 12 weeks of training, although the efect size in the NoncarrierT group was possibly beneicial, while in
Table 3. Means in body composition, metabolic, inlammatory and itness in Carrier and Noncarrier training after 12 weeks of combined training.
TRAINING GROUP
Gln27Glu + Glu27Glu (N=11) Gln27Gln (n=11)
T P GXT P
12 weeks ES 12 weeks ES
General characteristics and Body composition
Height (m) 1.64 (.07) .05 1.69(.08) .08 .020 .890 .892 .356
the Carrier group it was unclear for adiponectin and probably trivial CRP (Figure 2).
After 12 weeks, the CarrierC group showed an increase in height, which was not observed in the training group. Both carrier groups showed an increase in WC, although the efect size was
greater in the group that did not train (ES=.74 vs ES=.22). No main efect or interactions between CarrierT and CarrierC groups were shown in TEC (F=1.938; p=.189); carbohydrates (F=.158; p=.698), proteins (F=1.960; p=.187) and lipids (F=.571; p=.464).
The participants of the CarrierT group showed a reduction
BMI (kg/m2) 27.9(2.02) .14 28.9(3.61) .27 .298 .591 1.340 .261
WC (cm) 89.6(8.37) .22 93.9(11.7) .21 .013 .911 1.594 .222
FM(kg) 28.1(4.60) .26 30.6(10.4) .42 8.688 .008 .459 .506
LM(kg 43.3(7.22) .16 48.7(7.29) .24 82.65 .000 3.329 .083
TFAT (kg) 40.6(7.16) .34 38.5(9.74) .41 15.467 .001 .056 .816
VFAT (cm) 3.29(.70) .46 3.23(.67) .29 6.843 .017 .467 .502
SFAT (cm) 2.43(.94) .46 2.32(.86) .48 29.001 .000 .0008 .93
Metabolic variables
GLUC (mg/dl) 82.2(7.26) .66 80.9(7.83) .26 7.717 .012 .501 .487
TC (mg/dl) 158.4(38.4) .15 161.7(48.9) .35 2.882 .105 .007 .932
LDL-c(mg/dl) 88.7(27.3) .14 89.2(39.8) .24 .000 .989 1.688 .209
HDL-c(mg/dl) 48.4(8.83) .29 51.9(11.9) .47 5.434 .030 1.409 .249
VLDL (mg/dl) # 21.4(11.3) .14 20.6(6.62) .17 -.711 .477 -.711 .477
TG(mg/dl) # 106.8(56.3) .15 103.3(33.1) .17 -.800 .424 -.800 .424
INS(μU/mL) # 14.3(9.73) .29 13.6(6.91) .51 -2.401b .016 -
-HOMA-IR# 2.91(1.99) .43 2.71(1.32) .49 -2.312b .021 -
-QUICKI# .347(.048) .54 .335(.025) .43 -2.045a .041 -
-Inlammatory markers
IL-6(pg/mL) 1.96(1.63) .56 1.85(1.42) .54 4.797 .042 .495 .491
CPR(mg/L) 1.48(2.12) .21 1.45(1.19) .39 10.33 .005 1.876 .189
TNF-α(pg/mL) 6.95(8.87) .24 1.89(1.34) .15 2.711 .126 .936 .352
Leptin(ng/mL)# 41(32.08) .33 33.87(20.9) .16 - - -2.073b .038
Resistin(ng/mL) 10.39(6.54) .17 9.21(2.44) .39 .105 .750 .105 .750
Adiponectin(ng/mL) 9.70(7.43) .49 7.39(4.60) .26 5.615 .029 .200 .660
IL-10(pg/mL) .27(.22) .27 .49(0.77) .06 .000 .986 .052 .986
Fitness
VO2max(ml.kg.1min.-1) 37.9(5.31) .63 37.4(9.56) .27 34.943 .000 4.621 .057
1RM_Legpress# 240.3(42.9) .63 200.8(36.7) .84 -2.388b .017 -
-1RM_Bench press 46.6(10.8) .63 38.4(8.08) .63 77.231 .000 3.782 .078
1RM_Arm curl 23.7(4.19) .74 23(3.84) .87 11.260 .006 .594 .457
of FM and TFAT, as well as an increase in VO2max, and in the leg press and arm curl test values. In the CarrierC group, after the 12 weeks of training, most participants showed lower strength test values and higher HOMA-IR values than the CarrierT group (Table 3). Participants of both Carrier groups had a reduction in subcutaneous abdominal fat. However, the efect size was greater in the group that trained (ES=.48 vs ES=.17). As for the inlammatory variables, while the CarrierT group showed a reduction in leptin levels after 12 weeks of training, the CarrierC group showed an increase of such levels.
After the intervention, the NoncarrierC group showed an increase in height and in WC, which was not observed in the NoncarrierT group. The participants in the NoncarrierT group showed a reduction in TFAT, as well as an increase in LM, LEG press and bench press, while the NoncarrierC group did
not. No main efect or interactions between NoncarrierT and NonarrierC groups were shown in TEC (F=1.314; p=.269), carbohydrates (F=2.244; p=.154), proteins (F=1.218; p=.285) and lipids (Z=-1.540b; p=.123).
When compared to the control group, the NoncarrierT group had a lower frequency of subjects who showed an increase in insulin levels, as well as a higher frequency of subjects with reduced HOMA-IR values and increased QUICKI values after the 12 weeks of training. The NoncarrierT group had a higher frequency of subjects with increased VO2max after the 12 weeks than the NoncarrierC group. The NoncarrierC showed a reduction in LDL-c values, while the training group did not. The NoncarrierT group showed a reduction in HDL-c values after the 12 weeks of training, which was not observed in the training group.
ES = .42; p = .03
ES = .26; p = .02 40
35
30
25
FM (Kg)
A
ES = .41; p = .017
ES = .34; p = .037 50
40 45
35
30
TF
A
T
(Kg)
B
ES = .46; p = .008
ES = .48; p = .008 40
25 30 35
20
15
SF
A
T
(cm)
C
ES = .16; p = .33
ES = .24; p = .22 40
45
35
30
25
VF
A
T
(cm)
D
ES = .63; p = .001
ES = .27; p = .002 45
40
35
30
25
V
O2max
(ml/Kg/min)
E
Baseline 3-Months
ES = .63; p = .006
ES = .63; p = .000 55
45 50
40
35
30
25
1RM-Bench Pr
ess (Kg)
F
Baseline 3-Months
Carrier T Noncarrier T
5
4
3
2
1
0
ES = .56; p = 0.2
ES = .06; p = .03 A
IL
- 6 (pg/ml)
60
40
20
0
ES = .49; p = .038
ES = .26; p = .238 B
Leptin (pg/ml)
15
10
5
0
ES = .18; p = .033
ES = .55; p = .033 C
Adiponectin (mg/ml)
5
4
3
2
1
0
ES = .63; p = .022
ES = .24; p = .10 D
CRP
(mg/L)
Baseline 3-Months Baseline 3-Months
Carrier T Noncarrier T
Figure 2. Means of Interleukin-6 (IL-6) (A), Leptin (B), Adiponectin (C), C-reative Protein (CRP) (D) in the Carrier and in the Noncarrier Train-ing groups at baseline and after 3 months of trainTrain-ing. Note: CarrierT = Gln27Glu or Glu27Glu; NoncarrierT= Gln27Gln; ES= Efect size.
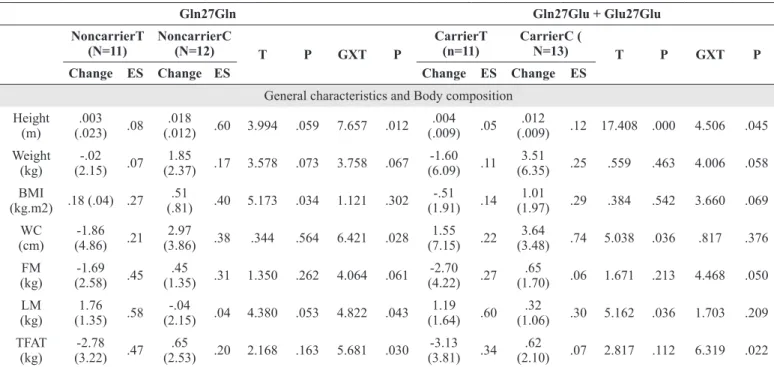
Table 4. Changes in body composition, metabolic, inlammatory and itness in Carrier and Noncarrier after 12 weeks of combined training.
Gln27Gln Gln27Glu + Glu27Glu
NoncarrierT
(N=11) NoncarrierC (N=12) T P GXT P
CarrierT
(n=11) CarrierC ( N=13) T P GXT P
Change ES Change ES Change ES Change ES
General characteristics and Body composition Height
(m)
.003 (.023) .08
.018
(.012) .60 3.994 .059 7.657 .012 .004 (.009) .05
.012
(.009) .12 17.408 .000 4.506 .045 Weight
(kg)
-.02 (2.15) .07
1.85
(2.37) .17 3.578 .073 3.758 .067
-1.60 (6.09) .11
3.51
(6.35) .25 .559 .463 4.006 .058 BMI
(kg.m2) .18 (.04) .27 .51
(.81) .40 5.173 .034 1.121 .302 -.51 (1.91) .14
1.01
(1.97) .29 .384 .542 3.660 .069 WC
(cm)
-1.86 (4.86) .21
2.97
(3.86) .38 .344 .564 6.421 .028 1.55 (7.15) .22
3.64
(3.48) .74 5.038 .036 .817 .376 FM
(kg)
-1.69 (2.58) .45
.45
(1.35) .31 1.350 .262 4.064 .061
-2.70 (4.22) .27
.65
(1.70) .06 1.671 .213 4.468 .050 LM
(kg)
1.76 (1.35) .58
-.04
(2.15) .04 4.380 .053 4.822 .043 1.19 (1.64) .60
.32
(1.06) .30 5.162 .036 1.703 .209 TFAT
(kg)
-2.78 (3.22) .47
.65
(2.53) .20 2.168 .163 5.681 .030
-3.13 (3.81) .34
.62
VFAT (cm)
-.21 (.53) .20
-.26
(.47) .32 4.710 .042 .056 .816 -.35 (.47) .46
.026
(.67) .04 1.820 .191 2.451 .132 SFAT
(cm)
-.42 (.33) .48
.021
(.62) .02 3.286 .087 4.010 .061 -44 (.38) .46
-17
(.44) .17 11.838 .003 2.160 .157 Metabolic GLUC (mg.dl) -3.68 (9.12) .26 -5.60
(10.8) .34 4.712 .042 .202 .658
-6.20 (7.48) .66
-3.02
(5.42) .29 12.226 .002 1.443 .242 TC
(mg.dl)
-6.60 (15.48) .35
-9.51
(13.31) .45 6.846 .017 .224 .641
-7.31 (22.32) .15
.39
(19.82) .00 .646 .430 .802 .380 LDL-c
(mg.dl)
5.53 (12.44) .24
-13.27
(17.04) .47 1.478 .238 8.742 .008
-5.41 (25.05) .14
-.73
(28.07) .19 .316 .580 .183 .673 HDL-c
(mg.dl)
-10.7 (12.4) .47
1.89
(13.8) .07 2.483 .036 5.071 .036
-3.49 (15.95) .29
2.02
(18.06) .13 .044 .837 .613 .440 VLDL
(mg.dl) #
-1.40 (7.75) .17
1.87
(8.18) .30 - - -.800 .424
1.62 (6.98) .14
-.89
(7.19) .00 - - -.711 .477
TG(mg. dl) #
-7.01 (38.8) .17
9.32
(40.93) .30 - - -.800 .424
8.17 (34.9) .15
-4.46
(35.9) .00 - - -.711 .477
INS(μU. mL) #
-4.00 (4.18) .51
3.51
(4.85) .39 - - -2.401b .016
-2.05 (4.17) .29
1.03
(5.93) .07 - - -1.379 .701
HOMA-IR#
-0.95 (1.09) .49
.52
(.92) .36 - - -2.312a .021 -.62 (.86) .43
.09
(1.23) .04 - - -2.045b .041
QUICKI# .021 (.31) .43
-.009
(.016) .28 - - -2.045b .041 .012 (.017) .54
-.001
(.021) .04 1.869 .185 2.563 .124 Inlammatory markers IL-6 (pg.mL) -1.72 (3.09) .56 .25
(1.11) .44 .319 .581 1.997 .179 .32 (1.57) .06
-.24
(1.31) .52 1.324 .267 .741 .402 CPR
(mg.L)
-2.02 (3.40) .63
.28
(1.23) .19 1.093 .312 3.598 .077 -.11 (.94) .24
-.56
(2.05) .14 .822 .378 .069 .796 TNF-α
(pg.mL)# .27 (1.32) .09
-.55
(6.54) .00 - - -.338 .735
1.66 (1.93) .24
.14
(1.29) .31 2.649 .124 .170 .686 Leptin(ng.
mL#
-5.54 (14.36) .26
1.81
(12.12) .03 - - -1.245 .213
-7.80 (9.16) .49
10.83
(14.76) .41 .422 .524 8.781 .008 Resistin
(ng.mL) .73 (2.80) .39
.71
(3.08) .27 1.712 .208 .108 .746 2.12 (3.15) .41
.71
(3.16) .30 4.216 .054 1.058 .317 Adipo-nectin (ng.mL) -2.00 (5.23) .55 .08
(3.15) .03 1.277 .274 1.599 .223 -.79 (2.34) .18
-.27
(2.82) .06 .612 .44 .063 .805
IL-10 (pg.mL)
.195 (.81) .06
.018
(.21) .08 .001 .972 .047 .832
-.045 (.27) .28
.041
(.15) .12 .002 .964 .783 .387 Fitness VO2max (ml.kg. 1min.-1)# 5.57 (2.86) .63 1.21
(4.19) .00 - - -2.371b .018 2.60 (1.28) .27
-.56
(2.13) .08 3.635 .083 8.828 .013
1RM_ Legpress
53.1 (23.6) .63
15.7
(13.04) .54 45.524 .000 13.451 .003
56.67 (39.83) .84
10.9
(12.61) .20 27.921 .000 12.802 .003 1RM_ Bench press 12.3 (4.07) .51 2.71
(2.62) .54 67.089 .000 27.316 .000 7.83 (4.16) .63
.54
(2.91) .14 - - -2.207a .027
1RM_ Arm curl
2.71 (4.53) .74
1.42
(1.39) .54 5.334 .040 .514 .487 4.33 (2.58) .87
1.45
(2.38) .20 - - 5.359 .035
Discussion
This study investigated the inluence of ADRB2 Gln27Glu
polymorphism in anthropometric, metabolic and inlamma -tory parameters in overweight adolescents after twelve weeks of combined training (CT). The CT was efective in reducing total fat mass, subcutaneous abdominal fat, increasing lean mass, and itness independent of presence of ADRB2 Gln27Glu
polymorphism. However, only the Glu27 allele carriers showed reductions in leptin after 12-weeks.
At baseline, Glu27carriers and noncarriers had similar body composition, physical itness, anthropometric and metabolic pa -rameters. These results are in line with other studies with children and adolescents that found no diferences in anthropometric34,35, metabolic and cardiorespiratory itness parameters36 or risk of bronchospasm due to exercise37 between carriers and noncarri-ers. Conversely, other studies indicate that the Glu27 allele is associated with greater body mass36, body mass index38, waist circumference39, and higher blood pressure and triglycerides
levels40, when compared to Glu27 allele noncarriers. On the
other hand, higher total cholesterol levels have been found in adolescents homozygotes for the usual allele (Gln27Gln) when compared to carriers of the Glu27 variant36
. With regard to the presence or absence of the Glu27 allele in groups whose leptin, CRP, TNF-alpha and resistin levels, they were similar at baseline. In contrast, all the four groups presented diferences in adipo -nectin and IL-6 levels. This result, however, was independent of the presence of the Glu27allele. Carrier adolescents had lower IL-10 levels than noncarrier adolescents, which suggests that they have a lower protective efect, since IL-10 is a cytokine with anti-inlammatory properties that plays a central role in infections by controlling immune responses to pathogens41.
After 12 weeks of training, our results have shown that Glu27 allele carriers who trained had a reduction in total fat mass and trunk fat mass, and an increase in lean body mass, but no changes in body mass, BMI and WC. The efect size was greater in the Glu27 allele carrier group who trained, when analyzing the reduction in total fat mass (ES=.46 vs ES=.26) and trunk fat mass (ES=.41 vs ES=.34). Our results disagree with another study conducted with children and adolescents, in which a reduction in weight, BMI z-score and WC was identi-ied in ADRB2 Glu27 carriers and noncarriers after 12 weeks of aerobic exercises40. This divergence is probably due to the fact that the adolescents in this study undertook a lower volume of aerobic physical activity and exhibited an increase in lean body mass as a result of resistance exercises. Similarly, in a study with postmenopausal women, in which intervention consisted of 12 months of resistance training, carriers showed a greater increase in lean body mass than noncarriers, even though no signiicant changes were found in body composition43.
As for the metabolic parameters, Glu27 carriers exhibited reductions only in blood glucose levels after the 12 weeks of training. The efect, however, was probably beneicial only for the group that trained, whereas the control group only experi-enced a trivial efect. In addition, carriers who undertook the intervention had a higher frequency of improvement of IR than controls, which suggests that the performance of this kind of
exercise protocol by adolescents, regardless of the genotype of
the Gln27Glu polymorphism, may help control and prevent the
progression of glucose metabolism-related disorders.
Although no signiicant diference was found after the 12 weeks of training, the intervention groups exhibited changed levels of IL-6, leptin, adiponectin and CRP. The NoncarrierT group had reduced IL-6 levels after the 12 weeks of training, showing a probably beneicial efect. This may be associated with greater IL-6 levels at baseline, as well as with reduced CRP levels after combined training. Considering that IL-6 has been described as being a cytokine with both pro- and anti-inlammatory properties44, the reduction in IL-6 and CRP levels may indicate a decrease in the inlammatory process in the NoncarrierT group. Exercise may have both a direct anti-inlammatory efect, through an increase in the production of anti-inlammatory cytokines such as IL-6 by the skeletal muscle, and an indirect anti-inlammatory efect, through the reduction of adipose tissue, which results in a lower release of cytokines45.
After 12 weeks of CT, only the individuals in the CarrierT group had lower levels of circulating leptin (ES=.49), showing better response in reducing body fat through the performance of this training program than the individuals in the NoncarrierT group. Leptin stimulates glucose uptake through activation of adenosine monophosphate-activated protein kinase (AMPK). However, at high concentrations, it may inhibit AMPK activa-tion, because it increases insulin receptor substrate-1 expression, due to the activation of the suppressor of cytokine signalling 346. In the present study, these efects may be associated with the reductions in FM observed after the intervention, which consequently led to an improvement of the inlammatory status and of insulin response. Moreover, individuals in the CarrierC group showed increased leptin levels after 12 weeks of train-ing, with a moderate efect size (ES=.41), which suggests that inactivity may be another obesogenic factor, whereas regular physical exercise probably promotes reductions and improve-ments in the inlammatory proile. In adults, the homozygous Glu27 genotype47 appears to be associated with greater leptin concentrations than the other two genotypes.
With regards to physical itness, both groups showed in -creased VO2max and 1RM bench press values. Nevertheless, the efect size regarding VO2max increase was greater in the CarrierT group (ES=.63 vs ES=.27; possibly beneicial) than in the NoncarrierT group. All groups showed changes in lean body mass. Nevertheless, when compared to their controls, both carriers and noncarriers exhibited probably beneicial efects, which suggests that training was efective in increasing lean body mass, regardless of the β2-adrenergic receptors.
activity, resulting in the release of circulating free fatty acids48. Considering that, ADRB2 Gln27Glu polymorphism seems to result in reduced receptor sensibility, which leads to a reduction in lipase activity49. It may be suggested that regular physical exercise acts as a compensatory and mitigating mechanism in the change generated by the presence of the Glu27 allele, since exercise can stimulate sympathetic nervous system activity, thus stimulating lipolysis.
One limitation of this study is the small number of par-ticipants, which prevents the performance of a gender-speciic analysis. However, all participants were in the postpubertal stage, in which the morphological and biological diferences between genders are milder than in puberty50. Moreover, the analyses and comparisons made were limited to the Gln27Glu polymorphism, other variants of the beta adrenergic genes have not been assessed. Findings of previous studies indicate the exis-tence of links between variants which, when combined, increase the risk of and the susceptibility to obesity48. In view of this, further research is needed taking into consideration the other polymorphisms of the ADRB2 gene. Besides, further research including diferent exercise modalities and intensities could improve the understanding of interactions between variants of the ADRB2 gene and adolescents’ responsiveness to exercise.
We conclude that CT led to changes in body composition, regardless of the genotypes of the ADRB2 Gln27Glu polymor-phism. Moreover, the presence of the Glu27 allele did not result in a negative efect, since Glu27 carriers responded better to training than noncarriers. This was shown by a greater efect size on reduction in body composition, as well as by an increase in itness. Nevertheless, only the Glu27 allele carriers showed reductions in leptin levels after 12 weeks. Another important factor is that the Glu27 allele carriers had lower IL-10 levels at baseline, which gives them a lower anti-inlammatory protec -tion. Lack of regular physical activity in overweight adolescents, especially in the Glu27 carrier group, was associated with in-creased obesity indicators and leptin levels in adolescents, which suggests that exercise can be an important tool to mitigate the changes associated with possible risk alleles.
References
1. MacPherson M, de Groh M, Loukine L, Prud’homme D, Dubois L. Prevalence of metabolic syndrome and its risk factors in Canadian children and adolescents: Canadian Health Measures Survey Cycle 1 (2007-2009) and Cycle 2 (2009-2011). Heal Promot chronic Dis Prev Canada Res policy Pract. 2016;36(2):32-40. http://www.ncbi.nlm.nih.gov/pubmed/26878492. Accessed June 2, 2016.
2. Silva LR, Stefanello JMF, Pizzi J, Timossi LS, Leite N. Aterosclerose subclínica e marcadores inlamatórios em crian-ças e adolescentes obesos e não obesos. Rev Bras Epidemiol. 2012;15(4):804-816. doi:10.1590/S1415-790X2012000400012. 3. Nemet D, Barkan S, Epstein Y, Friedland O, Kowen G, Eliakim
A. Short- and long-term beneicial efects of a combined dietary-behavioral-physical activity intervention for the treatment of
childhood obesity. Pediatrics. 2005;115(4):e443-9. doi:10.1542/ peds.2004-2172.
4. Miles L. Physical activity and health. Nutr Bull. 2007;32:314-363. doi:10.1111/j.1467-3010.2007.00668.x.
5. Moreno-Aliaga MJ, Santos JL, Marti A, Martínez JA. Does weight loss prognosis depend on genetic make-up? Obes Rev. 2005;6(2):155-168. doi:10.1111/j.1467-789X.2005.00180.x. 6. Chou YC, Tsai CN, Lee YS, Pei JS. Association of adrenergic
recep-tor gene polymorphisms with adolescent obesity in Taiwan. Pediatr Int. 2012;54(1):111-116. doi:10.1111/j.1442-200X.2011.03516.x. 7. Masuo K, Rakugi H, Ogihara T. Relationships of Beta2- and
Beta3--Adrenoceptor Polymorphisms with Obesity, Hypertension and Metabolic Syndrome. Curr Hypertens Rev. 2010;6(2):118-129. doi:10.2174/157340210791171065.
8. Masuo K, Katsuya T, Kawaguchi H, Rakugi YFH, Ogihara T, Tuck ML. Rebound weight gain as associated with high plasma norepinephrine levels that are mediated through polymorphisms in the beta2-adrenoceptor. Am J Hypertens. 2005;18(11):1508-1516. doi:10.1016/j.amjhyper.2005.05.006.
9. Villares SM, Mancini MC, Gomez S, Charf AM, Frazzatto E, Halpern A. Associação entre polimorismo Gln27Glu do recep-tor beta2-adrenérgico e hipertensão arterial sistêmica em obesos mórbidos. Arq Bras Endocrinol Metabol. 2000;44(1):72-80. doi:10.1590/S0004-27302000000100012.
10. Masuo K, Katsuya T, Fu Y, Rakugi H, Ogihara T, Tuck ML. Beta2- and beta3-adrenergic receptor polymorphisms are related to the onset of weight gain and blood pressure elevation over 5 years. Circulation. 2005;111(25):3429-3434. doi:10.1161/ CIRCULATIONAHA.104.519652.
11. Okay DM, Jackson P V., Marcinkiewicz M, Papino MN. Exercise and Obesity. Prim Care - Clin Of Pract. 2009;36(2):379-393. doi:10.1016/j.pop.2009.01.008.
12. Wanjek M, Senner V, Scharhag-Rosenberger F, Halle M. Efects of diferent weight loss intervention programmes in health clubs – an observational multicenter study. Eur J Sport Sci. 2016;16(7):859-867. doi:10.1080/17461391.2016.1139628.
13. Strong WB, Malina RM, Blimkie CJR, Daniels SR, Dishman RK, Gutin B, Hergenroeder AC, Must A, Nixon PA, Pivarnik JM, Rowland T, Trost S, Trudeau F. Evidence based physical activity for school-age youth. J Pediatr. 2005;146(6):732-737. doi:10.1016/j.jpeds.2005.01.055.
14. Lopes WA, Leite N, da Silva LR, Brunelli DT, Gáspari AF, Radominski RB, Chacon-Mikahil, Cavaglieri CR. Effects of 12 weeks of combined training without caloric restriction on inflammatory markers in overweight girls. J Sports Sci. 2016;34(20):1902-1912. doi:10.1080/02640414.2016.1142107. 15. Leite N, Milano GE, Cieslak F, Lopes W a., Rodacki a., Radominski
RB. Efects of physical exercise and nutritional guidance on metabolic syndrome in obese adolescents. Rev Bras Fisioter. 2009;13(1):73-81. doi:10.1590/S1413-35552009005016. 16. Lee S, Kim Y. Efects of exercise alone on insulin
sensitiv-ity and glucose tolerance in obese youth. Diabetes Metab J. 2013;37(4):225-232. doi:10.4093/dmj.2013.37.4.225.
Training. Metabolism. 2004;53(2):193-202. doi:10.1016/j. metabol.2003.09.010.
18. Marti A, Corbalán MS, Martínez-Gonzalez MA, Martinez JA. TRP64ARG polymorphism of the beta 3-adrenergic receptor gene and obesity risk: efect modiication by a sedentary lifestyle. Diabetes Obes Metab. 2002;4(6):428-430. http://www.ncbi.nlm. nih.gov/pubmed/12406043. Accessed June 21, 2016.
19. Meirhaeghe a, Helbecque N, Cottel D, Amouyel P. Impact of polymorphisms of the human beta2-adrenoceptor gene on obesity in a French population. Int J Obes Relat Metab Disord. 2000;24(3):382-387. http://www.ncbi.nlm.nih.gov/ pubmed/10757635.
20. de Mello MT, Piano A, Carnier J, Sanches PL, Corrêa FA, Tock L, Ernandes RMY, Tuik S, Dâmaso AR. Long-term efects of aerobic plus resistance training on the metabolic syndrome and adipo-nectinemia in obese adolescents. J Clin Hypertens (Greenwich). 2011;13(5):343-350. doi:10.1111/j.1751-7176.2010.00388.x. 21. Dâmaso AR, Campos RMDS, Caranti DA, Piano A, Fisberg M,
Foschini D, Sanches PL, Tock L, Lederman HM, Tuik S, De Mello MT. Aerobic plus resistance training was more efective in improving the visceral adiposity, metabolic proile and inlamma-tory markers than aerobic training in obese adolescents. J Sports Sci. 2014;32(June):1-11. doi:10.1080/02640414.2014.900692. 22. Libardi CA, De Souza GV, Cavaglieri CR, Madruga VA,
Chacon-Mikahil MPT. Efect of resistance, endurance, and concurrent training on TNF-α, IL-6, and CRP. Med Sci Sports Exerc. 2012;44(1):50-56. doi:10.1249/MSS.0b013e318229d2e9. 23. Lohman TG, Roche AF, Martorell R. Anthropometric
Standardization Reference Manual. Vol 24. 1988. http://books. google.com/books?id=jjGAAAAAMAAJ&pgis=1.
24. Coutinho PR, Leite N, Lopes WA, Da Silva LR, Consentino CM, Araújo CT, Moraes Jr FB, Jesus IC, Cavaglieri CR, Radominski RB. Association between adiposity indicators, metabolic parameters and inlammatory markers in a sample of female adolescents. Arq Bras Endocrinol Metabol. 2015;59(4):325-334. doi:10.1590/2359-3997000000070.
25. Brown LE, Weir JP. Accurate Assessment of Muscular Strength and Power JEPonline Journal of Exercise Physiologyonline ASEP Procedures Recommendation ASEP PROCEDURES RECOMMENDATION I: ACCURATE ASSESSMENT OF MUSCULAR STRENGTH AND POWER. An Int Electron J. 2001;4(3):1-21.
26. Jones AM, Doust JH. A 1% treadmill grade most accurately relects the energetic cost of outdoor running. J Sports Sci. 1996;14(4):321-327. doi:10.1080/026404196367796.
27. Friedewald WT, Levy RI, Fredrickson DS. Estimation of the concentration of low-density lipoprotein cholesterol in plasma, without use of the preparative ultracentrifuge. Clin Chem. 1972;18(6):499-502. http://www.ncbi.nlm.nih.gov/ pubmed/4337382. Accessed April 12, 2016.
28. Matthews DR, Hosker JP, Rudenski AS, Naylor BA, Treacher DF, Turner RC. Homeostasis model assessment: insulin resistance and beta-cell function from fasting plasma glucose and insulin concen-trations in man. Diabetologia. 1985;28(7):412-419. http://www. ncbi.nlm.nih.gov/pubmed/3899825. Accessed April 12, 2016. 29. Katz A, Nambi SS, Mather K, Baron AD, Follmann DA,
Sullivan G, Quon MJ. Quantitative insulin sensitivity check
index: a simple, accurate method for assessing insulin sensitiv-ity in humans. J Clin Endocrinol Metab. 2000;85(7):2402-2410. doi:10.1210/jcem.85.7.6661.
30. Lahiri DK, Nurnberger JI. A rapid non-enzymatic method for the preparation of HMW DNA from blood for RFLP studies. Nucleic Acids Res. 1991;19(19):5444. http://www.ncbi.nlm.nih. gov/pubmed/1681511. Accessed June 8, 2016.
31. Vlachos IS, Hatziioannou A, Perelas A, Perrea DN. Sonographic assessment of regional adiposity. AJR Am J Roentgenol. 2007;189(6):1545-1553. doi:10.2214/AJR.07.2366.
32. Majem LLS, Barba L. Recordatorio de 24 horas. In: Majem LLS, Bartrina JA, Verdú JM, eds. Nutrición Y Salud Pública - Métodos, Bases Cientíicas Y Aplicaciones. Vol Barcelona: masson; 1995. 33. Cohen J. Statistical Power Analysis. Curr Dir Psychol Sci.
1992;1(3):98-101. doi:10.1111/1467-8721.ep10768783. 34. Mattevi VS, Zembrzuski VM, Hutz MH. Impact of variation in
ADRB2, ADRB3, and GNB3 genes on body mass index and waist circumference in a Brazilian population. Am J Hum Biol. 2006;18(2):182-186. doi:10.1002/ajhb.20486.
35. Ochoa MC, Moreno-Aliaga MJ, Martínez-González MA, Martínez JA, Marti A. TV watching modifies obesity risk linked to the 27Glu polymorphism of the ADRB2 gene in girls. Int J Pediatr Obes. 2006;1(2):83-88. doi:http://dx.doi. org/10.1080/17477160600650386.
36. Leite N, Lazarotto L, Milano GE, Titski ACK, Consentino CLM, Mattos F, Andrade FA, Furtado-Alle L. Associação do gene ADRB2 com sobrepeso e asma em crianças e adolescentes e sua relação com a aptidão física. Rev Paul Pediatr. 2015;33(4):381-386. doi:10.1016/j.rpped.2015.01.012.
37. Consentino CLM, Furtado‐Alle L, Silva LR Da, Lopes WA, Tureck LV, Milano GE, Lazarotto L, Cavaglieri CR, Leite N. Inluência dos polimorismos no receptor beta 2 adrenér-gico na presença de broncoespasmo induzido pelo exercício em adolescentes. Rev Paul Pediatr. 2015;(xx). doi:10.1016/j. rpped.2015.06.002.
38. Rauhio A, Uusi-Rasi K, Nikkari ST, Kannus P, Sievänen H, Kunnas T. Association of the FTO and ADRB2 genes with body composition and fat distribution in obese women. Maturitas. 2013;76(2):165-171. doi:10.1016/j.maturitas.2013.07.004. 39. Podolsky RH, Barbeau P, Kang H-S, Zhu H, Treiber FA,
Snieder H. Candidate genes and growth curves for adiposity in African- and European-American youth. Int J Obes (Lond). 2007;31(10):1491-1499. doi:10.1038/sj.ijo.0803673.
40. Leite N, Milano-Gai, GE., Lazarotto L, Milano GE, Radominski, RB. Andrade F, Furtado-Alle L. Overweight adolescents and β2-adrenergic receptor gene polymorphisms: metabolic response after 12-weeks aerobic training. In: 19th Annual Congress of the EUROPEAN COLLEGE OF SPORT SCIENCE. Vol ; 2014:679. 41. Iyer SS, Cheng G. Role of interleukin 10 transcriptional
regulation in inlammation and autoimmune disease. Crit Rev Immunol. 2012;32(1):23-63. http://www.ncbi.nlm.nih.gov/ pubmed/22428854. Accessed June 28, 2016.
trial of physical activity among postmenopausal women. Behav Genet. 2010;40(5):649-659. doi:10.1007/s10519-010-9361-1. 43. Scheller J, Chalaris A, Schmidt-Arras D, Rose-John S. The pro-
and anti-inlammatory properties of the cytokine interleukin-6. Biochim Biophys Acta - Mol Cell Res. 2011;1813(5):878-888. doi:10.1016/j.bbamcr.2011.01.034.
44. Gleeson M, Bishop NC, Stensel DJ, Lindley MR, Mastana SS, Nimmo MA. The anti-inlammatory efects of exercise: mecha-nisms and implications for the prevention and treatment of disease. Nat Rev Immunol. 2011;11(9):607-615. doi:10.1038/nri3041; 10.1038/nri3041.
45. Cao H. Adipocytokines in obesity and metabolic disease. J Endocrinol. 2014;220(2):T47-59. doi:10.1530/JOE-13-0339. 46. Daghestani MH, Warsy A, Daghestani MH, Al-odaib AN, Eldali
A, Al-Eisa NA, Al-zhrani S. The Gln27Glu polymorphism in β2-adrenergic receptor gene is linked to hypertriglyceridemia, hyperinsulinemia and hyperleptinemia in Saudis. Lipids Health Dis. 2010;9:90. doi:10.1186/1476-511X-9-90.
47. Cipolletta E, Carillo A, Annunziata R, Trimarco B, Franco A, Iaccarino G. The impact of (beta) 2 adrenergic receptor polymor-phisms on the outcomes in cardiovascular diseases. Cardiogenetics. 2014;4(1):10-21. doi:10.4081/cardiogenetics.2014.4661. 48. Atala MM, Consolim-colombo FM. Inluência dos polimorismos
dos genes dos receptores β-adrenérgicos na regulação cardio-vascular e no desenvolvimento das doenças cardiocardio-vasculares. Receptor. 2007;14(4):258-264.
49. Malina RM, Bouchard C, Bar-Or O. Growth, Maturation, and Physical Activity.; 2004.
Acknowledgements
“This work was partial supported by Fundação Araucária do Estado do Paraná
under Grant 19281-408/2012”. Leite N and Cavaglieri CR are productivity scholar-ship holders from CNPq; Silva LR is a scholarscholar-ship holder from CAPES, Furtado-Alle L is a productivity scholarship holder from Fundação Araucária.
Corresponding author
Neiva Leite
Department of Physical Education - Federal University of Paraná, Curitiba-PR,
Bra-zil. Adress: Rua Coração de Maria, 92. Jardim Botânico, Curitiba, Paraná, BraBra-zil.
Email: [email protected]
Manuscript received on June 29, 2017
Manuscript accepted on September 14, 2017
Motriz. The Journal of Physical Education. UNESP. Rio Claro, SP, Brazil