Assessing the Impact of Lung Hyperinflation Maneuver on
Systemic Inflammatory Response and Lung Collapse in
Patients Undergoing Surgeries under Spontaneous Ventilation
Luiz Marcelo Sá Malbouisson, TSA
1, Elton Lúcio Silva de Souza
2, Larissa Barbalho
3, Cristina de Oliveira
Massoco
4, Maria José Carvalho Carmona, TSA
5, José Otávio Costa Auler Jr, TSA
6Summary: Malbouisson LMS, Souza ELS, Barbalho L, Massoco CO, Carmona MJC, Auler Jr JOC – Assessing the Impact of Lung Hyperinflation Maneuver on Systemic Inflammatory Response and Lung Collapse in Patients Undergoing Surgeries under Spontaneous Ventilation.
Background and objectives: Lung hyperinflation maneuvers (LHM) reverse intraoperative atelectasis; however, they can lead to pulmonary-induced systemic inflammatory response. The objective of this study was to determine the impact of LHM on systemic inflammatory response and lung structure in patients undergoing subarachnoid block.
Methods:After approval by the Ethics Committee of the institution and signing the informed consent, 20 patients undergoing small and medium surgical procedures were randomly separated into two groups: 1) control (CG), and 2) LHM (LHMG). One hour after the spinal anesthesia, LHM was performed in LHMG by applying bilevel positive pressure in the airways (BIPAP) with an expiratory pressure of 20 cmH2O and inspiratory pressure of 20 cmH2O for 1 to 2 minutes. Blood levels of TNFα, IL-1, IL-6, IL-8, IL-10, and IL-12 were determined by flow cytometry at baseline and at 90, 180, and 780 minutes. Lung volumes and weights were determined using CT scans obtained immediately after the surgery.
Results: The use of LHM resulted in a reduction in the fraction of non-aerated pulmonary parenchyma (7.5 ± 4.3%, in the Control Group, vs. 4 ± 2.1%, in the LHM Group, p = 0.02) without changing pulmonary volumes. A progressive increase in plasma levels of IL-1, IL-6, IL-8, and IL-10, similar in both groups, was observed. Plasma levels of TNFα and IL-12 were undetectable during the study.
Conclusions: The use of LHM reduced the incidence of atelectasis, but it did not amplify the inflammatory response in patients with normal lungs under-going small and medium surgeries under subarachnoid block.
Keywords: ANESTHETIC TECHNIQUE, Regional: subarachnoid; COMPLICATIONS: atelectasis; METABOLISM: systemic inflammatory response syndro-me; VENTILATION, Mechanical: positive pressure, lung hyperinflation maneuver.
Financial Support: Fundação de Amparo à Pesquisa do Estado de São Paulo (FAPESP) process number 2006/57786-2.
[Rev Bras Anestesiol 2010;60(3): 247-258] ©Elsevier Editora Ltda.
INTRODUCTION
Pulmonary collapse is a common complication in patients un-dergoing general anesthesia 1. The use of lung hyperinflation maneuvers up to total lung capacity have been described as being effective in reversing atelectasis associated with muscle relaxation, sedation, and mechanical ventilation 2,3.
Despite the beneficial effects of lung hyperinflation maneuvers (LHM) promoting reversion of atelectasis, and improving blood
Received from the Hospital das Clínicas (HC) of the Faculdade de Medicina da Universidade de São Paulo (FMUSP), SP
1. Anesthesiologist and Specialist in Intensive Care Unit; Supervisor Physician of the Surgi-cal ICU of the Discipline of Anesthesiology of the Instituto Central of the HCFMUSP; Doctor in Sciences by the USP
2. Anesthesiologist
3. Anesthesiologist; Assistant physician of the Service of Anesthesiology do HCFMUSP 4. Veterinarian; Doctor in Sciences by the USP
5. Director of the Division of Anesthesiology of the Instituto Central of the HCFMUSP; As-sociate Professor of the Discipline of Anesthesiology of the FMUSP
6. Director of the Division of Anesthesiology and Surgical Intensive Care of the Instituto do Cora-ção do HCFMUSP; Full Professor of the Discipline of Anesthesiology of the FMUSP
Submitted on May 13, 2009 Approved on January 20, 2010
Correspondence to:
Dr. Luiz Marcelo Sá Malbouisson
Programa de Pós-Graduação e Pesquisa em Anestesiologia Coordenador: Prof. Dr. José Otávio Costa Auler Jr.
Instituto do Coração – Hospital das Clínicas da Faculdade de Medicina da USP Av. Enéas de Carvalho Aguiar, 44, 2o andar
05403-000 – São Paulo, SP, Brasil E-mail: [email protected]
oxygenation, and the clinical safety regarding barotrauma when pressures of 40 cmH2O are used for a short period, some studies have demonstrated that stretching of the pulmonary parenchyma by applying sustained elevation of airway pressures can lead to damage of the parenchymatous structure and inflammation of the lungs, with the subsequent release of interleukins in the blood 4-8. In a recent study, a small but significant release of interleukins in the blood was observed in healthy volunteers without evidence of inflammatory activity who underwent lung hyperinflation maneu-vers with bilevel pressure in the airways (BIPAP) 9.
However, even in patients with normal lung function, mechani-cal ventilation itself can promote activation of systemic inflamma-tory response 10,11. For this reason, it is not possible to separate LHM-related inflammation from that promoted by the surgical procedure without the bias of mechanical ventilation in patients undergoing surgery under general anesthesia. The present stu-dy was designed to evaluate whether isolate LHM can amplify the inflammatory response generated by the surgery, knowing that LHM with pressures of up to 40 cmH2O for short periods in patients with spontaneous ventilation is a safe procedure 9.
METHODS
After approval by the Ethics Commission of the Hospital das Clínicas da Faculdade de Medicina da Universidade de São Paulo and signing of the informed consent, 20 patients under-going small and medium surgeries under arachnoid block were randomly divided in two groups: 1) Control Group (n = 10), and 2) Lung Hyperinflation Maneuver Group (LHM Group) (n = 10). Patients were divided in two groups by random drawing; to re-duce selection bias, the anesthesiologist in charge of patient selection was informed which group the patient was assigned to only when the patient was admitted to the operating room.
Inclusion criteria were: 1) Patients classified as P1 or P2 by the risk score proposed by the American Society of Anesthe-siologists; 2) Older than 18 years; and 3) Elective surgery un-der subarachnoid block.
Exclusion criteria were: 1) Active infection; 2) Immunosup-pression of any etiology; 3) Perioperative use of anti-inflam-matories; 4) Perioperative blood transfusion; 5) Malignancies; 6) Acute lung disease; and 7) Body mass index > 30 kg.m2.
On the day of the surgery, after being admitted to the operat-ing room, all patients were monitored with cardioscope (DII and V5 derivations), non-invasive blood pressure, and pulse oxime-ter, and a peripheral venous access was established with an 18G catheter. After monitoring, all patients underwent subarachnoid block with the administration of 15 mg of hyperbaric bupivacaine in the subarachnoid space through a 27G Whitacre needle. Pa-tients maintained spontaneous ventilation with oxygen, 2 L.min-1, through a nasal catheter, and they were sedated with 2 mg of midazolam.
One hour after the beginning of the procedure, lung hyperin-flation maneuver up to total lung capacity was performed in the LHM Group. Lung hyperinflation maneuver was performed with a non-invasive mechanical ventilation device (BIPAP Vision, Re-spironics Inc., Carlsbad. California, USA) with inspired fraction of oxygen of 30% during spontaneous ventilation. After the total facial mask (Respironics Inc., Carlsbad, California, USA) was adjusted to avoid the escape of air, continuous positive pressure (CPAP) of 5 cmH2O was applied and increased by 3 cmH2O after every 5th breath until 20 cmH
2O, after which an additional inspiratory pressure of 20 cmH2O was applied using bilevel posi-tive airway pressure (BIPAP), reaching a maximal pressure of 40 cmH2O in the airways for 10 respiratory cycles. The CPAP was reduced in a step-wise fashion from 20 cmH2O to 5 cmH2O, in 3 cmH2O decrements after every 5th respiratory cycle. At the end of the procedure, all patients in both groups underwent a CT scan of the chest during a small period of apnea at the end of a normal expiration.
Venous blood samples were drawn at baseline, after the ve nipuncture, and 90, 180, and 780 minutes after the spinal anesthesia. Immediately after the blood was drawn, 5-mL aliquots of EDTA-containing blood were centrifuged at 1500 g for 5 minutes and the plasma was removed and stored at -70°C for posterior analysis. Simultaneous detection of mul-tiple interleukins by flow cytometry was done to quantify inter-leukins (IL)-1β, IL-6, IL-8, IL-10, IL-12p70, and tumor necrosis factor (TNF)-α (Cytometric Bead Array – Human Inflammation Kit, BD Biosciences, Heidelberg, Germany).
Spiral volumetric tomographies of the chest were obtained in a helicoidal Toshiba tomography scanner and contiguous recon-structed images with 5 mm width were analyzed with the Osiris 4.19 software (Geneva University Hospital, Switzerland).
Lung volume was determined by adding the total number of voxels (elemental volume unit in computerized tomography), whose dimensions were known, in all lung areas in the differ-ent contiguous images. The volumes of gas and tissue were calculated using the following formulas:
(1) Voxel volume = (pixel area) x width of the section, in which the area of the pixel is provided for each tomography. (2) Total volume of the compartment = number of voxels x
voxel volume for each band of radiographic density. (3) Air volume = (CT coefficient/1,000) x total compartment
volume, if the compartment considered had a CT coeffi-cient between -1,000 HU and 0 HU; or (3’) volume of air = 0, if the compartment under consideration had a CT coe-fficient higher than 0 HU; or (3’’) volume of air = total com-partment volume, if the CT coefficient was -1,000 HU. (4) Tissue volume = (1 + CT coefficient/1,000) x total
com-partment volume, if the comcom-partment had a CT coeffi-cient between -1,000 HU and 0 HU; or (4’) tissue volume = number of voxels x voxel volume, if the compartment had a CT coefficient greater than 0 HU; or (4’’) tissue vo-lume = 0, if the compartment had a CT coefficient lower than -1,000 HU.
(5) Weight of lung parenchyma = tissue volume, if the compart-ment had a radiographic density lower than 0 HU; or (5’) weight of lung parenchyma = 1 + radiological density/1,000 x total compartment volume, if the compartment had a CT coefficient greater than 0 HU.
In which the CT coefficient is the X-rays coefficient of at-tenuation that characterizes each voxel in the image.
Later, total air and tissue volume, as well as the weight of the lung parenchyma of a region of interest were calculated by adding the corresponding volumes and weights of the com-partments analyzed in the different areas of interest.
The tissue volume measured from the CT represents the sum of the volumes of the lung parenchyma, blood, and ex-travascular water.
In parallel to the determination of lung air and tissue vol-umes, lung parenchyma was divided in four compartments as a function of the degree of aeration:
1) Hyperinflated lung parenchyma: CT coefficient between -1,000 HU and -900 HU.
2) Normally aerated lung parenchyma: CT coefficient betwe-en -900 HU and -500 HU.
3) Poorly aerated lung parenchyma: CT coefficient between -500 HU and -100 HU.
4) Non-aerated lung parenchyma: CT coefficient between -100 HU and +100 HU.
type of analysis allows the calculation of the amount (weight) of parenchyma in each one of the compartments.
The normalcy of all parameters evaluated in this study was tested by the Kolmogorov-Smirnov test. Anthropometric and laboratorial data, as well as those related with the total results of both lungs were compared by the Student t test for indepen-dent samples, if they had a normal distribution, or Wilcoxon test. The Chi-square test was used to compare the categorical data in both groups. The temporal behavior of the cytokines in both groups was analyzed by two-way Analysis of Variance for repeated measurements, followed by multiple compari-sons by the Bonferroni method when indicated. The software Aabel 2.4.2 (Gigawiz, Oklahoma City, Oklahoma, USA) and Graphpad Prism 4.02 (GraphPad Software, La Jolla, Califor-nia, USA) were used for the statistical analysis, considering a level of significance of 0.05. Results were expressed as mean ± standard deviation and mentioned when otherwise.
RESULTS
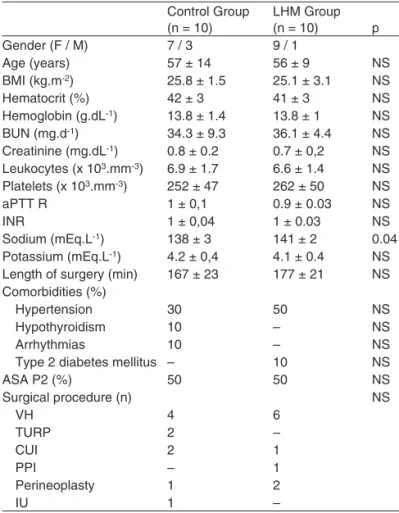
Table I shows the anthropometric characteristics of the study patients. Both groups were comparable regarding the
distribu-tion of gender, type of surgery, age, BMI, and physical status classification according to the ASA. Except for sodium levels, which were slightly higher in the LHM group than in the Con-trol Group (141 ± 21 mEq.L-1vs. 138 ± 3 mEq.L-1, p = 0.04), laboratorial profiles of both groups were similar.
Figure 1 shows sample images of the tomographies ob-tained immediately after the surgical procedure in the Con-trol and LHM Groups. As can be seen in Figure 2, total lung volume calculated from CTs of the chest obtained after pa-tients were admitted to the post-anesthetic recovery room was 3,116 ± 1,184 mL, in the Control Group, versus 3,383 ± 793 mL, which was not statistically significant. When the volumes of air and tissue were considered as a fraction of the total lung volume, those volumes represented 30.5 ± 8.5% and 69.5 ± 8.5%, in the Control Group, and 26.6 ± 6.4% and 73.2 ± 6.4%, in the LHM Group.
Table I – Demographic and Laboratorial Data
Control Group (n = 10)
LHM Group
(n = 10) p
Gender (F / M) 7 / 3 9 / 1
Age (years) 57 ± 14 56 ± 9 NS
BMI (kg.m-2) 25.8 ± 1.5 25.1 ± 3.1 NS
Hematocrit (%) 42 ± 3 41 ± 3 NS
Hemoglobin (g.dL-1) 13.8 ± 1.4 13.8 ± 1 NS BUN (mg.d-1) 34.3 ± 9.3 36.1 ± 4.4 NS Creatinine (mg.dL-1) 0.8 ± 0.2 0.7 ± 0,2 NS Leukocytes (x 103.mm-3) 6.9 ± 1.7 6.6 ± 1.4 NS Platelets (x 103.mm-3) 252 ± 47 262 ± 50 NS
aPTT R 1 ± 0,1 0.9 ± 0.03 NS
INR 1 ± 0,04 1 ± 0.03 NS
Sodium (mEq.L-1) 138 ± 3 141 ± 2 0.04 Potassium (mEq.L-1) 4.2 ± 0,4 4.1 ± 0.4 NS Length of surgery (min) 167 ± 23 177 ± 21 NS Comorbidities (%)
Hypertension 30 50 NS
Hypothyroidism 10 – NS
Arrhythmias 10 – NS
Type 2 diabetes mellitus – 10 NS
ASA P2 (%) 50 50 NS
Surgical procedure (n) NS
VH 4 6
TURP 2 –
CUI 2 1
PPI – 1
Perineoplasty 1 2
IU 1 –
LHM – lung hyperinflation maneuver; BMI – body mass index; aPTT R – ac-tivated partial thromboplastin time ratio; INR – international normalized ratio; VH – vaginal hysterectomy; TURP – transurethral resection of the prostate; CUI – correction of urinary incontinence; PPI – penile prosthesis implant; IU – internal uteroplasty.
Figure 1 – CT Scan of the Chest of the Control Group (right panel) and Lung Hyperinflation Group (left panel).
Control
V
olume (mL)
LHM
Tissue Total
4.000
3.500
3.000
2.500
2.000
1.500
1.000
500
0
Air
DISCUSSION
The main findings of this study were: 1) lung hyperinflation maneuvers, commonly used to promote alveolar recruitment, did not cause an increase in systemic inflammatory response
Figure 4 – Temporal Behavior of Interleukins IL-10 (upper panel), IL-8 (upper mid panel), IL-6 (lower mid panel), and IL-1β (lower pa-nel) in the Control (closed circles) and Lung Hyperinflation Maneuver (open circles) Groups.* p < 0.05 when compared to baseline levels. Data expressed as mean ± standard deviation.
CG 30
20
10
0
IL – 8 (pg.L
–1
) LHMG
CG 30
35
20 25
10 15
5 0
IL – 1
β
(pg.L
–1
) LHMG
basal 90 min 180 min 780 min CG
50 150
100 200
0
IL – 6 (pg.L
–1
)
LHMG CG 90
80 70 60 50 40 30 20 10 0
IL – 10 (pg.L
–1)
LHMG
*
*
*
*
Moment
Figure 3 – Total Weight of Lung Parenchyma and that of Non-aerated, Poorly Aerated, Normal Aeration, and Hyperinflated Com-partments in the Control (black bars) and Lung Hyperinflation Ma-neuver (open bars) Groups.Data expressed as mean ± standard deviation.
W
eight of the lung parenc
h
yma (g)
Non-aer
ated
T
otal
P
o
or
ly aer
ated
Nor
m-aer
ated
Hyper
inflated
Control LHM
p = 0.02 1.000
800
600
400
200
0
The lung parenchyma had a mean weight of 871 ± 158 g, in the Control Group, versus 875 ± 164 g, in the LHM Group, and this difference was not statistically significant. When aera-tion of the lung parenchyma was analyzed, it was observed that non-aerated lung parenchyma represented 7.5 ± 4.3% of the total weight of the lung parenchyma, in the Control Group, versus 4 ± 2.1%, in the LHM Group, with p = 0.02. Significant differences in poorly aerated, normally aerated, or hyperin-flated compartments were not observed between both groups (Figure 3).
in patients undergoing small to medium surgeries, and 2) lung hyperinflation maneuvers promoted a reduction in the fraction of collapsed lung parenchyma in the LHM Group when com-pared to the lung collapse seen in the Control Group.
Several publications have demonstrated the beneficial ef-fects or alveolar recruitment maneuvers that promote lung hyperinflation up to total lung capacity, leading to an improve-ment in blood oxygenation and increasing lung compliance in patients undergoing general anesthesia 2,12-14. However, stretching the lung parenchyma beyond its physiological limits by applying high pressures to the airways could be associated with the lung-induced inflammatory response.
Almost all tissues in the body show an immediate mechani-cal response, with an increase in rigidity directly proportional to the mechanical stress applied 15. In the lungs, the pressure of the residual volume that remains in the parenchyma after a normal expiration (elastic recoil volume) is responsible for maintaining the extracellular matrix that surrounds the alveoli tense and hardened and to avoid alveolar collapse 16. When forces that promote stretching beyond those physiological limits are applied in the pulmonary parenchyma, the expres-sion of specific genes and inflammatory and anti-inflammatory molecules in the lungs can change 17. Vlahakis et al. observed that when type II pneumocytes are stretched more than 30%, this promotes a release of interleukin 8 18. Von Bethmann et al. described that hyperventilation induced an increase in the release of TNFα and IL-6 in the perfusate of the rat model of healthy lungs 19. Several other experimental studies reported similar findings when tissue or lung models were stretched beyond physiological limits 7,20,21. Clinical studies with patients with acute respiratory failure undergoing mechanical ventila-tion confirmed the experimental data, demonstrating that repe-titive stretching of the lung parenchyma promotes the release of interleukins, and that ventilatory strategies that limit inflation pressures and cyclical lung collapse would reduce this inflam-matory response 8,22.
However, the role of isolate use of alveolar recruitment ma-neuver on the activation of systemic inflammatory response in patients with normal lungs and spontaneous ventilation is controversial. In a prior study with healthy volunteers with ho-mogeneously aerated lungs, we observed that applying lung hyperinflation maneuvers for a short period promoted a subtle, but significant, increase in circulating inflammatory and anti-inflammatory cytokines 9. In that study, lung hyperinflation ma-neuver was the only stimulus for the development of a systemic inflammatory response. However, the inflammatory response observed was of low intensity and self-limited, since the lev-els of interleukins returned to normal within 12 hours. Besides, studies weighing the physiological impact of the release of in-terleukins in the blood stream after alveolar recruitment maneu-ver against the possible benefits in patients undergoing general anesthesia who evolve with hypoxemia do not exist.
In the present study, we investigated whether the magni-tude of this inflammatory response induced by stretching the lungs was additive or synergistic to the inflammatory response related to the surgical procedure in patients with normal lungs. Amplification of the inflammatory response in patients under-going alveolar recruitment maneuver was not observed. It is possible that the magnitude of the inflammatory response re-lated to this isolate alveolar recruitment maneuver was insig-nificant even in patients undergoing small to medium surgeries in whom a discrete inflammatory response to surgical trauma is expected. Puls et al. reported similar data, since they did not observe the release of inflammatory and anti-inflammatory cytokines in the blood when alveolar recruitment maneuvers with CPAP of 40 cmH2O for 6-second periods were used 23.
It is important to emphasize that a unique alveolar recruit-ment maneuver was tested in patients without evidence of in-flammatory activity. At this moment, it is not possible to state whether different alveolar recruitment maneuvers with differ-ent airways pressurization regimen, duration, and periodicity of repetitions in humans could produce similar patterns of in-flammatory response. Therefore, it is not possible to gener-alize this data for other alveolar recruitment maneuvers with other airways pressurization regimens or the repetitive use of those maneuvers in patients with respiratory failure.
Note that lung hyperinflation maneuver was capable of reduc-ing the fraction of non-aerated parenchyma in patients undergo-ing subarachnoid block. To our knowledge, this is the first time lung collapse in patients undergoing regional block was quanti-fied and the impact of the lung hyperinflation maneuver reversing atelectasis in this population was evaluated. The supine position and use of sedation, which can reduce the amplitude of respira-tory movements, were probably the mechanisms related to the small lung collapse observed. However, on the clinical point of view, this lung collapse was non-significant.
Some patients included in the study had comorbidities, which can be observed in Table I. Three patients in the Con-trol Group and five patients in the LHM Group had hyperten-sion, and isolated cases of hypothyroidism, arrhythmias, and type 2 diabetes mellitus were also observed. All comorbidities observed were clinically controlled, and those patients were classified as P2 according to the score proposed by the Amer-ican Society of Anesthesiologists (ASA). It seems unlikely that any of the comorbidities present, which were clinical under control, could have affected the results of the study.