ABSTRACT
INTRODUCTION
Postmortem autolytic changes have been
described in heart1,5,8,12,15, temporal bones9,
pancreas10,14,17, kidneys4,17, liver17, skeletal
muscle17, blood vessels11, blood cells13 and sweat
glands3. Clumping1,3,4,5,11,17 and margination of the
nuclear chromatin1,3,4,10,12,17, pyknotic nuclei1,3,4,10,11,
breakdown of nuclear membranes4,10, swelling
or lysis of cells1,3,4,9,10,11,12,17 and a progressive
reduction in cell staining quality6,13,14 were some of
the events reported in the literature.
In previous investigations on human sublingual
glands2,7
was not elucidated. A lack of information exists
Postmortem acinar autolysis in rat sublingual
gland: a morphometric study
Leticia Rodrigues NERY1, Carla Ruffeil MOREIRA2, Tania Mary CESTARI3 4 5
1- DDS, MSc, Graduate Student, Bauru School of Dentistry, University of São Paulo, Bauru, SP, Brazil. 2- DDS, MSc, PhD student, Bauru School of Dentistry, University of São Paulo, Bauru, SP, Brazil.
3- BS, Biologist, Department of Biological Sciences, Bauru School of Dentistry, University of São Paulo, Bauru, SP, Brazil. 4- DDS, PhD, Professor, Department of Biological Sciences, Bauru School of Dentistry, University of São Paulo, Bauru, SP, Brazil. 5- DDS, PhD, Professor, Department of Stomatology, Bauru School of Dentistry, University of São Paulo, Bauru, SP, Brazil.
Corresponding address: Carla Ruffeil Moreira - Departmento de Estomatologia - Faculdade de Odontologia de Bauru, USP - Al. Dr. Octávio Pinheiro Brisolla 9-75 - 17.012-901 - Bauru, SP - Brasil - Phone/fax: +55 (14) 3234-8254 - [email protected]
!" #$#%!
O
bjective: To analyze and to quantify morphological acinar postmortem changes in rat sublingual glands (SLG). Material and Methods: Fifty rats were divided into two groups of 25 animals each. Group I was used for morphological and morphometric evaluations and group II for the determination of gland density and processed gland volume. Acinar autolytic changes were studied at 0 (control group), 3, 6, 12 and 24 h postmortem periods. The morphometric analysis of the volume density (VV) and total volume (VT) ofintact (ia) and autolyzed (aa) acini was performed under light microscopy using a Zeiss II integration grid with 100 symmetrically distributed points. Results: Morphologically, temporal progressive nuclear alterations and gradual loss of the structural architecture of acinar cells were found. Regarding quantitative results, both the VVaa and the VVia
VVaa increased from 0.42% at 0 h to 75.84% at 24 h postmortem and VVia decreased
from 71.16% to 0% over the same period. For VTaa and VTia,
!"#"$#&' VTaa increased
from 0.18 mm3 at 0 h to 38.17 mm3 at 12 h, while VTia showed a decrease from 33.47
mm3 to 0 mm3 between 3-24 h postmortem. Data concerning VTaa were adjusted by
two-variable linear regression, obtaining the equation: y=-3.54 + 3.38x (r2=0.90). The VTaa
growth rate calculated by this equation was 3.38 mm3/h between 0-12 h. Conclusion:
* ;<>? postmortem and was widely spread through the gland at 12 h.
Key words: Rats. Salivary glands. Sublingual gland. Postmortem changes. Autolysis.
concerning postmortem autolytic changes in the mucous and mixed acini of salivary glands, mainly to distinguish these from pathological causes before death or others artifacts. Therefore, the purpose of this study was to analyze and quantify morphological acinar postmortem changes in a ;<> different time intervals after death.
MATERIAL AND METHODS
Animals
Fifty adult male Wistar rats (Rattus norvegicus),
weighing approximately 366 g, obtained from the Central Animal House of Bauru School of Dentistry were divided into two groups of 25 animals each. Group I was used for morphological and morphometric evaluations and group II for the determination of the retraction provoked by histological processing and glandular density, both required when calculating processed glandular volume. Groups I and II were divided into subgroups according to the following postmortem periods: 0 (control), 3, 6, 12 and 24 h (5 rats/period).
General histological procedures
Prior to anethesia induction, atropine was administered (1.25% atropine solution, Laboratório Prado AS, Curitiba-PR, Brazil) at a dosage of 4.0 @JK ketamine hydrochloride (intramuscular injection of 100 mg/kg of body mass) and xylazine hydrochloride (intramuscular injection of 3 mg/ kg of body mass). The body mass of each rat was determined and the corpses were stored at room
temperature (18oC). At each postmortem time,
their sublingual glands were carefully removed and immediately weighed on an analytical scale to
obtain the fresh gland mass (m). The glands were
#!N for 1 week at room temperature. Subsequently, the specimens were dehydrated in ethanol, cleared in xylol and embedded in Histosec-Merck (Merck Q>*U>* #V#J !#V stained with hematoxylin-eosin.
Calculation of processed gland volume
The processed gland volume (VP) was calculated
for each gland using the following equation:
VP=m/d x rf, where m is the fresh gland mass,
d is the glandular density and rf is the shrinkage
caused by histological processing.
Glandular density (d) was evaluated in the
group II glands at the established postmortem periods using a Mettler Toledo AT261 Delta Rang (Mettler Toledo, Barcelona, Spain) precision scale determinations. The average density obtained for the periods was 1.046 mg/cm³. The retraction caused by the histological procedures was evaluated
using the method described by Taga and Sesso16
(1978). In this method, linear measurements are obtained from the square trimmed fresh organ (Sf) and after histological processing (Sp). The averages of the Sf and Sp linear values are raised
to the third power. The retraction factor (rf) was
estimated using the relationship: rf=Sp3/Sf3. The
mean rf was 0.625.
Morphometric evaluation of the acinar volume density (VV) and total volume (VT)
The VV of the acini of each sublingual gland was
determined using an Olympus light microscope (Olympus America Inc., New York, NY, USA) with a 100x objective and 8x Zeiss Kpl eyepiece containing a Zeiss II integration grid (Carl Zeiss Jena GmbH, Jena, Germany) with 10 parallel lines and 100 points symmetrically distributed over ^ _
per rat, selected by systematic randomization
proceedings18, the number of points (P) coinciding
with the images of intact (ia) and autolyzed (aa) acini were counted. The total number of points
(PT) over total gland area was also obtained. VV
was calculated by the equation: VV=P/PT. Once
the VV and processed gland volume (VP) values
were determined, VT was calculated (mm3) by the
equation: VT=VV x VP.
Adopted criteria of intact and autolyzed acini
An acinus was counted as autolyzed when it presented the minimum sign of loss of cell limit, independent of the degree. For morphometric analysis, the following criteria were adopted: a) intact acini: included mixed or mucous intact K ^ ` b) autolyzed acini: included mixed or mucous autolyzed acini; c) other: these included ducts, | stroma, which were represented by the connective tissue. Eventual artifacts were also computed here.
Statistical analysis
The results obtained for postmortem periods were compared by one-way ANOVA or Kruskal-Wallis followed by Student-Newman-Keuls using
the Sigma Stat JadelTM ;
Windows (Jadel Corporation, Chicago, IL, USA). The K total volume of autolyzed acini were submitted to
# ~0+a1x)
;#; K ^
2).
RESULTS
4XDOLWDWLYH¿QGLQJV
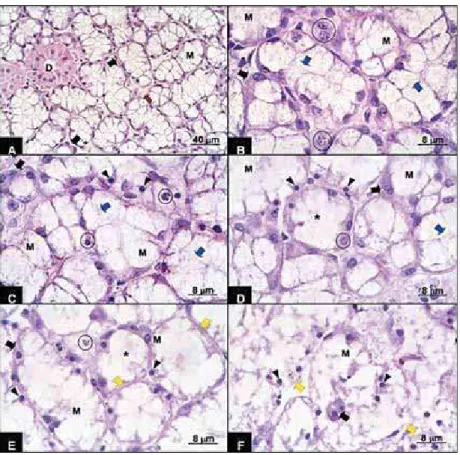
K;<> the rats (Figure 1A) were intact and presented mixed acini, mucous acini, ducts and small quantities of conjunctive material between these. The mixed acini presented larger mucosa cells than the serous # cytoplasm and eliptical nuclei, while the serous cells grouped in half-moon form were located in the peripheral portion of the acini, presenting small eosinophilic cytoplasm and central spherical nuclei. Rat glands at 3 h postmortem presented initial signs of acini destruction. Some mucous cells presented granulations, irregular spaces in the cytoplasm and loss of cell limit integrity (Figure 1B). The serous cells presented aspects similar to 0 h and the ducts exhibited an advanced stage of autolysis, including granular cytoplasm cells, loss of cell limits and nuclei alterations. In the 6 h postmortem group (Figure 1B), the glands
presented morphological characteristics similar to the 3 h postmortem period. The nuclei presented karyorrhexis, irregular distribution of chromatin, which formed clumping along the nuclei periphery, and loss of limits.
After 12 h (Figures 1C and 1D), almost all the acini presented intermediary stage autolysis, # Within the acini, the mucous cells showed partial or complete loss of limits and disorganized cytoplasm. Some nuclei presented karyorrhexis and others were pyknotic and hyperchromatic due to high chromatin condensation. In the 24 h postmortem group (Figures 1E and 1F), the acini presented an advanced stage of autolysis. Areas presenting the complete disappearance of acinus external limits were observed. The cytoplasmatic contents | J nuclei. However, in other areas, acinus limits _
distinguish the stromal parenchyma.
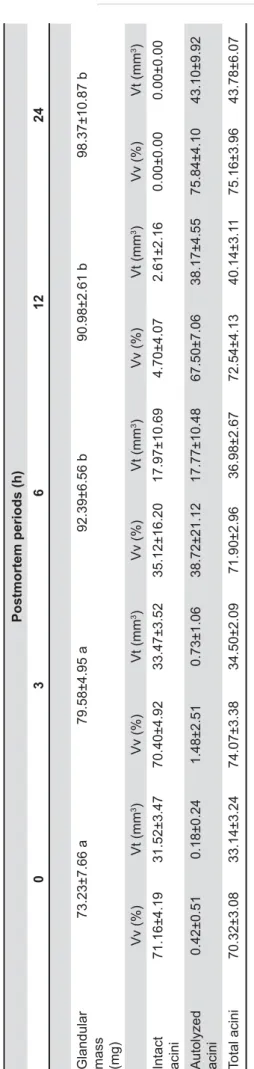
Quantitative results
The results of the morphometric analysis are
shown in Table 1. Both the VVaa and the VVia
all postmortem periods (p<0.05). Only the VVia
&
The VVaa increased from 0.42% at 0 h and to
1.48, 38.72, 67.50 and 75.84% at 3, 6, 12 and
24 h postmortem, respectively. The VVia showed
the opposite trend, presenting 71.16% at 0 h and decreasing to 70.40, 35.12, 4.70 and 0.00% at 3, 6, 12 and 24 h postmortem, respectively.
For the VTaa and the VTia, no statistically
!"#"$
#&' KVTaa increased
from 0.18 mm3 at 0 h to 0.73, 17.77 and 38.17
mm3 at 3, 6 and 12 h postmortem, respectively.
The VTia showed stable values between 0 (31.52
mm3) and 3 h (33.47 mm3) decreasing to 17.97,
2.61 and 0.00 mm3 at 6, 12 and 24 h postmortem,
respectively.
The equation obtained through linear regression
analysis for the VTaa was: y=-3.54+3.38x (Figure
2). The VTaa in the period from 0-12h postmortem
increased at a rate of 3.38 mm3/h.
DISCUSSION
Autolysis is normally associated with autopsies and recognition of the phenomenon is very
important12,15 to elucidate forensic cases19. Thus,
autolytic changes have been investigated by forensic pathologists, because they may assist in determining the time of death, especially in the
3,17.
&#'*+
03
6
1
2
2
4
Glandular mass (mg)
73.23±7.66 a
79.58±4.95 a
92.39±6.56 b
90.98±2.61 b
98.37±10.87 b
Vv (%)
Vt (mm
3)
Vv (%)
Vt (mm
3)
Vv (%)
Vt (mm
3)
Vv (%)
Vt (mm
3)
Vv (%)
Vt (mm
3)
Intact acini
71.16±4.19
31.52±3.47
70.40±4.92
33.47±3.52
35.12±16.20
17.97±10.69
4.70±4.07
2.61±2.16
0.00±0.00
0.00±0.00
Autolyzed acini
0.42±0.51
0.18±0.24
1.48±2.51
0.73±1.06
38.72±21.12
17.77±10.48
67.50±7.06
38.17±4.55
75.84±4.10
43.10±9.92
T
otal acini
70.32±3.08
33.14±3.24
74.07±3.38
34.50±2.09
71.90±2.96
36.98±2.67
72.54±4.13
40.14±3.1
1
75.16±3.96
43.78±6.07
T
able
Glandular mass, volume density (VV) and total volume (VT) of intact, autolyzed and total acini in postmortem periods
Groups followed by the same letter did not dif
fer from each other (p>0.05). Glandular mass and total acini are expressed by the
mean ± standard deviation; intact and
autolyzed acini are expressed by the median ± interquartile range
Although postmortem autolysis depends on
various factors9,17, the most important factor is the
postmortem period8,9,14. The literature reporting
on the severity of autolysis during postmortem
time has been investigated in functional1,10,12,
light microscopic3,4,11-14 and electron microscopic
studies1,3-5,8-10,12,13,15,17 in both humans3,9,14 and
animals1,4,5,8,10-12,15,17. Despite some quantitative
studies in various organs or tissues8,11,13,15, a
mucous salivary glands that describes the sequence of postmortem autolytic events is lacking. Thus, in the present study, the increase in the postmortem time was correlated with morphometric evaluation of autolytic changes in the mucous and mixed acini of the rat sublingual gland. Intact and autolyzed acini were counted to measure the phenomenon.
Rat body mass presented no statistically (p=0.145), thus showing sample homogeneity regarding the size and age of the rats. Glandular mass showed a mean increase of 34.3% from 0 to 24 h postmortem, suggesting the incorporation of liquids originating from the interstices or surrounding tissues. Autolysis promotes increased concentration within the organ, attracting liquids, leading to the increase in mass.
The present qualitative results followed the general line of descriptions of other works
regarding different cells and organs1,3-5,9-12,17. At 0 h
postmortem, the glandular structure was practically intact. An increase in the postmortem period presented loss of cell limit integrity, eventually followed by its disappearance. In parallel, the presence of granulations in the cytoplasm and nuclei alterations increased, culminating in total disorganization of the glandular structure at 24 h postmortem (Figure 1). Some of these postmortem autolytic changes were similar to alterations also
described as apoptosis4,17 and inadequate/delayed
6,9,11. As stated by Margarone, et al.6
(1985), acini of minor salivary glands are specially artifacts similar to postmortem autolytic changes.
Nuclear alterations similar to apoptosis4,17 or
1, such as peripheral chromatin
condensation, have been described for different organs of the body, including the pancreas, kidneys and heart. Early nuclear autolytic changes in postmortem are margination and condensation of chromatin against the nuclear membrane and later changes include rupture of nuclear membrane
and chromatolysis. Nevalainen and Anttinen10
! and granules are the nuclear structures most susceptible to autolytic degradation. It should be pointed out that nuclear changes were observed here in SLG acinar cells (Figure 1) and previously
in pancreatic acinar cells10,17.
The present results showed more severe autolytic changes in the striated and excretory
ducts than in the acini. This suggests a different rate of autolysis in rat SLG structures, similar to previously reported situations involving different
animal and human organs4,9,11,17. According to
Sukura, et al.4 (1990), these temporal differences
can be partially explained by oxygen deletion tissues. Cells rich in digestive enzymes are most readily subject to autolytic changes after death. Lysosomes might burst within injured, still living,
cells. In spite of this, Tomita, et al.17 (2004) found
that pancreas cells, which present a high content of hydrolytic enzymes, were relatively resistant to postmortem change up to 24 h after death. They also demonstrated that changes observed under a light microscope occurring during the early #"$ h after death.
In contrast to the present results regarding SLG ducts, previous observations in human salivary glands suggested that autolytic changes in duct cells seams to be less accelerated when compared
to acini cells2,3,7. Ultrastructurally, even the same
cellular organelle demonstrated varying resistance
to autolysis depending on the cell type9. Regarding
acinus cells, greater resistance to autolysis occurred in serous cells compared to mucous cells, both
in humans2,7 ! _
elements, clear differences were found among platelets and red and white cells. Lymphocytes seemed to present the highest resistance in
comparison with the other white cells13.
Various types of blood and other human cells retain their morphological structure and viability
for long periods after death13. Minimal or no
morphological changes were observed for at least
three h after death in different cells1,3,4,11. In the
present study, isolated autolytic changes were
found even in the 0 h group. Pallot, et al.11 (1992)
also found isolated alterations in the cells of rat carotid body. These authors stated that some cells showed autolytic changes within the few minutes required to complete organ dissection. Armiger,
et al.1 (1976) reported mild nuclear changes in
some control specimens and attributed them to speculate that SLG manipulation during dissection could promote the occurrence of these phenomena.
In this study, numerical analysis of the evolution
of the VTaa and the VTia showed that at 3 h, only
2.0% of the VT of the total acini were autolyzed,
increasing to 53.8%, 93.0% and 100% at 6, 12 and 24 h postmortem, respectively. Thus, half the acini of rat sublingual glands already presented autolysis at 6 h postmortem, with the greatest rate occurring between 3 and 6 h, and almost total autolysis at 12 h postmortem. This demonstrates the fragility of SLG in relation to postmortem K calculated using the adjusted linear equation:
y=-3.54+3.38x was 3.38 mm3/h. Thus, V
!"
a mean velocity of 3.38 mm3 per h.
The morphological alterations caused by autolysis demonstrated here (Figure 1) could help researchers and pathologists recognizing the phenomena and discard pathological areas and other artifacts. Further ultrastructural studies would be helpful to characterize the sequence of microstructural postmortem changes in sublingual glands, possibly including smaller postmortem periods. From the above comments it is evident that many changes in autolytic rat SLG acinar cells are very similar to those observed during the autolysis of many other cell types.
ACKNOWLEDGEMENTS
The authors would like to thank FAPESP (Nery LR, 05/53340-7) and CAPES (Moreira CR) for providing scholarships. They would also like to thank the professors and employees of the Department of Biological Sciences of Bauru School of Dentistry for their assistance.
REFERENCES
1- Armiger LC, Seelye RN, Carnell VM, Smith CU, Gavin JB, Herdson PB. Morphologic and biochemical changes in autolysing dog heart muscle. Lab Invest. 1976;34(4):357-62.
2- Azevedo LR, Damante JH, Lara VS, Lauris JR. Age-related changes in human sublingual glands: a post mortem study. Arch Oral Biol. 2005;50(6):565-74.
3- Cingolani M, Osculati A, Tombolini A, Tagliabracci A, Ghimenton C, Ferrara SD. Morphology of sweat glands in determining time of death. Int J Legal Med. 1994;107(3):132-40.
4- el-Shennawy IE, Gee DJ, Aparicio SR. Renal tubular epithelia ultrastructure in autolysis. J Pathol. 1985;147(1):13-21.
5- Hibbs RG, Black WC. Electron microscopy of post-mortem changes in the rat myocardium. Anat Rec. 1963;147:261-72. 6- Margarone JE, Natiella JR, Vaughan CD. Artifacts in oral biopsy specimens. J Oral Maxillofac Surg. 1985;43(3):163-72.
7- Moreira CR, Azevedo LR, Lauris JR, Taga R, Damante JH. Quantitative age-related differences in human sublingual gland. Arch Oral Biol. 2006;51(11):960-6.
8- Muñoz DR, Almeida M, Lopes EA, Iwamura ES. Potential morphometric study. Forensic Sci Int. 1999;104(2-3):81-9. 9- Nadol JB Jr, Burgess B. A study of postmortem autolysis in the human organ of Corti. J Comp Neurol. 1985;237(3):333-42. 10- Nevalainen TJ, Anttinen J. Ultrastructural and functional changes in pancreatic acinar cells during autolysis. Virchows Arch B Cell Pathol. 1977;24(3):197-207.
11- Pallot DJ, Seker M, Abramovici A. Post-mortem changes in the normal rat carotid body: possible implications for human histopathology. Virchows Arch A Pathol Anat Histopathol. 1992;420(1):31-5.
12- Penttilå A, Ahonen A. Electron microscopical and enzyme histochemical changes in the rat myocardium during prolonged autolysis. Beitr Pathol. 1976;157(2):126-41.
13- Penttilå A, Laiho K. Autolytic changes in blood cells of human cadavers. II. Morphological studies. Forensic Sci Int. 1981;17(2):121-32.
14- Shimizu M, Hayashi T, Saitoh Y, Ohta K, Itoh H. Postmortem autolysis in the pancreas: multivariate statistical study. K | 1990;5(1):91-4.
15- Sukura A, Soveri T, Lindberg LA. Morphometric quantitation of early autolytic changes in rat myocardial cells. Res Vet Sci. 1990;48(3):276-9.
16- Taga R, Sesso A. Cell population growth in the rat parotid gland during postnatal development. Arch Oral Biol. 2001;46(10):909-18.
17- Tomita Y, Nihira M, Ohno Y, Sato S. Ultrastructural changes during in situ early postmortem autolysis in kidney, pancreas, liver, heart and skeletal muscle of rats. Leg Med (Tokyo). 2004;6(1):25-31.