ABSTRACT
Liver proteome of mice with different genetic
Zohaib Nisar KHAN1, Aline de Lima LEITE1,2, Senda CHARONE1, Isabela Tomazini SABINO1, Tatiana MARTINI1,
Heloísa Aparecida Barbosa da Silva PEREIRA2, Rodrigo Cardoso de OLIVEIRA1, Marília Afonso Rabelo BUZALAF1
1- Universidade de São Paulo, Faculdade de Odontologia de Bauru, Departamento de Ciências Biológicas, Bauru, SP, Brasil.
2- Universidade Federal de São Carlos, Centro de Ciências Biológicas e da Saúde, Departamento de Genética e Evolução, São Carlos, SP, Brasil.
Corresponding address: Marília Afonso Rabelo Buzalaf - Departamento de Ciências Biológicas - Faculdade de Odontologia de Bauru - Universidade de São
Paulo - Al. Octávio Pinheiro Brisolla, 9-75 - Bauru - SP - 17012-901 - Brazil - Phone: + 55 14 32358346 - Fax + 55 14 32271486 - e-mail: [email protected]
6XEPLWWHG$XJXVW0RGL¿FDWLRQ'HFHPEHU$FFHSWHG-DQXDU\
A
/J and 129P3/J mice strains have been widely studied over the last few years because having higher circulating F levels. These two strains also present different characteristics regardless of F exposure. Objective: In this study, we investigated the differential pattern of protein expression in the liver of these mice to provide insights on why they have different responses to F. Material and Methods: Weanling male A/J and 129P3/J mice (n=10 from each strain) were pared and housed in metabolic cages with ad libit um access to low-Fv1.0.8) and protein-protein interaction network was constructed (PSICQUIC, Cytoscape). Results: Most proteins with fold change were increased in A/J mice. The functional category with the highest percentage of altered genes was oxidation-reduction process (20%). Subnetwork analysis revealed that proteins with fold change interacted with Disks large homolog 4 and Calcium-activated potassium channel subunit alpha-1. A/J mice had an
a possible explanation for the high susceptibility of these mice to the effects of F, since the exposure also induces oxidative stress.
Ke y w or ds: Proteomics. Fluorides. Liver. Oxidative stress.
I N TROD UCTI ON
A/J and 129P3/J mice strains have been widely studied over the last few years because they respond
given the same dose of F, the A/J strain responds with a rapid onset and severe development of dental
8. This was believed to be a consequence
of the faster excretion of F by the 129P3/J strain. Surprisingly, a metabolic study showed that the 129P3/J mice excrete less F in urine, have higher circulating F levels and, consequently, higher bone F levels, however, they still are remarkably resistant
5.
Some differences between these strains are intrinsic to themselves and do not depend on
the F exposure. For example, the A/J mice drink
129P3/J counterparts4, which can be explained
by the increased expression of Alpha-aminoadipic semialdehyde dehydrogenase in the kidney of 129P3/J mice, regardless of F exposure. This enzyme metabolyzes irreversibly betaine aldehyde to betaine that is the most effective osmoprotectant accumulated by eukaryotic organisms to cope with osmotic stress4. In addition, exclusive proteins
expressed in the kidney of A/J or 129P3/J mice
This suggests that the genetic background per se
accounts for such differences between these two strains of mice.
eliminating toxins from the digestive tract through hepatocyte-mediated enzymatic detoxification systems. Due to these important functions, liver is one of the body’s organs most subject to injury. Thus, it is believed that the differential pattern of protein expression in the liver of A/J and 129P3/J mice can provide new insights that could explain why they respond differently when exposed to F. To achieve this, state-of-the-art shotgun proteomics combined to bioinformatics approaches were used.
M ATERI AL AN D M ETH OD S
An im a ls a n d sa m ple s colle ct ion
Weanling male mice from the A/J and 129P3/J inbred strains (3-week-old; n=10 from each strain) were pared and housed in metabolic cages with
ad lib it u m access to low-F food (AIN76A, PMI Nutrition, Richmond, IN, USA, 0.95 mg/Kg F) and deionized water for 42 days. The temperature and humidity in the climate-controlled room, which had a 12 h light/dark cycle, were 23±1°C and 40%-80%, respectively. All experimental protocols were approved by the Ethics Committee for Animal Experiments of Bauru School of Dentistry, University of São Paulo (Protocol # 031/2013). At the end of the study, the mice were anesthetized with ketamine/xylazine and livers were collected. Samples designated for proteomic analysis were stored at -80°C, while those designated for F analysis were stored at -20°C.
Flu or ide a n a ly sis in liv e r
Fluoride analysis was done with the ion-sensitive electrode, after hexamethyldisiloxane-facilitated diffusion22, exactly as previously described20.
St a t ist ica l a n a ly sis
For liver F concentration, the GraphPad InStat software version 4.0 for Windows (GraphPad software Inc., La Jolla, California USA) was used. Data were analyzed by unpaired t t est (p<0.05).
Sa m ple pr e pa r a t ion for pr ot e om ic a n a ly sis
Samples were prepared for analysis as previously described17. The frozen tissue was homogenized in
a cryogenic mill (model 6770, Spex, Metuchen, NJ, EUA). For protein extraction, liver homogenate was incubated in lysis buffer containing 7 M urea, 2 M thiourea, 4% CHAPS, 1% IPG buffer pH 3-10, 40 mM DTT for 1 h at 4°C with occasional shaking. After this period, the homogenate was centrifuged at 15,000 rpm for 30 min at 4°C and the supernatant containing soluble proteins was recovered. The proteins were precipitated using the kit PlusOne 2D Cleanup (GE Healthcare, Uppsala, Sweden), as recommended by the manufacturer. Pellets were resuspended in rehydration buffer (7 M urea, 2
M thiourea, 0.5% CHAPS, 0.5% IPG buffer pH 3–10, 18 mM DTT, 0.002% bromophenol blue).
of the same group were combined to constitute a
pool, 50 mM AMBIC, containing 3 M urea, were
AMICON (Millipore, St Charles, MO, USA). Protein
by Bradford protein assay3. To each sample (50 μg
of total protein for each pool in a volume of 50 μL), 10 μL of 50 mM AMBIC were added. In sequence, 25 μL of 0.2% RapiGEST™ (Waters Co., Manchester, UK) were added and incubated at 80°C for 15 min. Following, 2.5 μL of 100 mM DTT were added and incubated at 60°C for 30 min. Also, 2.5 μL of 300 mM IAA were added and incubated for 30 min at room temperature (under dark). Then, 10 μL of trypsin (100 ng; Trypsin Gold Mass Spectrometry, Promega, Madison, USA) were added and digestion occurred for 14 h at 37°C. After digestion, 10 μl of 5 % TFA were added, incubated for 90 min at 37°C and the sample was centrifuged (14,000 rpm for 30 min). The supernatant was collected and 5 μL of ADH (1 pmol/μL) plus 85 μL 3% ACN were added.
LC- M S/ M S a n d bioin for m a t ics a n a ly se s
performed on a nanoAcquity UPLC-Xevo QTof MS system (Waters, Manchester, UK), exactly as previously described15. Difference in expression
among the groups was obtained using PLGS software and expressed as p<0.05 for down-regulated proteins 1-p>0.95 for up-down-regulated proteins (Table 1). Bioinformatics analysis was performed, as reported earlier1,15,17-19. Briefly,
Uniprot protein ID accession numbers were mapped back to their associated encoding Uniprot gene entries for the comparison A/J X 129P3/J. Gene Ontology annotation of Broad Biological Process was performed using Cluego v2.0.7 + Clupedia v1.0.8, a Cytoscape plugin. Uniprot IDs were uploaded to Table 1 and analyzed with default parameters, which specify a Enrichment (right-sided hypergeometric test) correction method using Bonferroni step down, analysis mode “Function” and load gene cluster list for Mus m usculus, Evidence Codes “All”, set
8) and KappaScoreThreshold 0.03. The protein-protein interaction network was downloaded from PSICQUIC, built in Cytoscape version 3.0.2 and constructed as proposed by Millan18 (2013). A
Foldchange
aAccess Gene Protein name description PLGS
score
A/J 0 ppm
129P3/ J 0 ppm
Number name
Q921H8 Acaa1a 3-ketoacyl-CoA thiolase A, peroxisomal 195.3 1.65 -1.65
Q8VCH0 Acaa1b 3-ketoacyl-CoA thiolase B, peroxisomal 195.3 1.70 -1.70
Q8BWT1 Acaa2 3-ketoacyl-CoA thiolase, mitochondrial 189.2 1,42 -1,42
P63038 Hspd1 60 kDa heat shock protein, mitochondrial 153.6 1.55 -1.55
P20029 Hspa5 78 kDa glucose-regulatedprotein 254.4 1.43 -1.43
P68033 Actc1 Actin, alpha cardiacmuscle 1 630.1 1.28 -1.28
P68134 Acta1 Actin, alpha skeletalmuscle 630.1 1.28 -1.28
P62737 Acta2 Actin, aorticsmoothmuscle 60.2 1.35 -1.35
P60710 Actb Actin, cytoplasmic 1 62.4 1.25 -1.25
P63260 Actg1 Actin, cytoplasmic 2 62.4 1.26 -1.26
P63268 Actg2 Actin, gamma-enteric smooth muscle 60.2 1.34 -1.34
P47738 Aldh2 Aldehydedehydrogenase, mitochondrial 72.6 1.67 -1.67
P17182 Eno1 $OSKDHQRODVH26 0XVPXVFXOXV 129.4 1.46 -1.46
P16460 Ass1 Argininosuccinatesynthase 58.6 1.28 -1.28
P05202 Got2 Aspartateaminotransferase, mitochondrial 79.3 1.34 -1.34
Q03265 Atp5a1 ATP synthase subunit alpha, mitochondrial 74.7 1.43 -1.43
P56480 Atp5b ATP synthasesubunit beta, mitochondrial 138.6 1.35 -1.35
O35490 Bhmt Betaine--homocysteine S-methyltransferase 1 40.6 1.23 -1.23
Q8C196 Cps1 Carbamoyl-phosphate synthase [ammonia], mitochondrial 269.2 1.39 -1.39
Q63880 Ces3a Carboxylesterase 3A 336.9 1.46 -1.46
Q8VCU1 Ces3b Carboxylesterase 3B 139.1 1.65 -1.65
P24270 Cat Catalase 260.8 1.62 -1.62
Q8R0Y6 Aldh1l1 Cytosolic 10-formyltetrahydrofolate dehydrogenase 53.1 1.55 -1.55
Q9DCW4 Etfb (OHFWURQWUDQVIHUÀDYRSURWHLQVXEXQLWEHWD 174.4 1.48 -1.48
P10126 Eef1a1 Elongationfactor 1-alpha 1 245.5 1.39 -1.39
P70694 Akr1c6 Estradiol 17 beta-dehydrogenase 5 207.5 1.48 -1.48
Q91XD4 Ftcd Formimidoyltransferase-cyclodeaminase 121.1 3.82 -3.82
Q91Y97 Aldob Fructose-bisphosphatealdolase B 96.1 1.62 -1.62
P35505 Fah Fumarylacetoacetase 136.0 1.46 -1.46
P26443 Glud1 Glutamatedehydrogenase 1, mitochondrial 467.9 1.84 -1.84
P10649 Gstm1 Glutathione S-transferase Mu 1 129.1 1.26 -1.26
P15626 Gstm2 Glutathione S-transferase Mu 2 109.8 1.32 -1.32
P48774 Gstm5 Glutathione S-transferase Mu 5 109.8 1.32 -1.32
P19157 Gstp1 Glutathione S-transferase P 1 317.2 -0.66 0.66
P63017 Hspa8 Heat shock cognate 71 kDa protein 275.2 1.36 -1.36
P01942 Hba Hemoglobinsubunit alpha 1252.1 -0.85 0.85
P02104 Hbb-y Hemoglobinsubunit epsilon-Y2 854.2 -0.48 0.48
Q8CGP6 Hist1h2ah Histone H2A type 1-H 193.0 1.22 -1.22
Q64522 Hist2h2ab Histone H2A type 2-B 241.3 1.51 -1.51
P62806 Hist1h4a Histone H4 88.1 1.54 -1.54
P54869 Hmgcs2 Hydroxymethylglutaryl-CoAsynthase, mitochondrial 292.1 1.22 -1.22
P11588 Mup1 Major urinaryprotein 1 815.0 -0.53 0.53
B5X0G2 Mup17 Major urinaryprotein 17 824.6 -0.54 0.54
P11589 Mup2 Major urinaryprotein 2 815.0 -0.54 0.54
P11591 Mup5 Major urinaryprotein 5 389.7 -0.57 0.57
P02762 Mup6 Major urinaryprotein 6 815.0 -0.53 0.53
P04938 Mup8 Major urinary proteins 11 and 8 (Fragment) 815.0 -0.54 0.54
P08249 Mdh2 Malatedehydrogenase, mitochondrial 247.9 1.45 -1.45
Q64374 Rgn Regucalcin 107.2 1.36 -1.36
P24549 Aldh1a1 Retinaldehydrogenase 1 208.9 1.49 -1.49
Foldchange
aAccess Gene Protein name description PLGS
score
A/J 0 ppm
129P3/ J 0 ppm
Number name
P07724 Alb Serumalbumin 108.5 1.34 -1.34
P00329 Adh1 Alcoholdehydrogenase 1 163.3 +
-Q61234 Snta1 Alpha-1-syntrophin 77.6 +
-Q8VCT3 Rnpep Aminopeptidase B 73.8 +
-Q9D3D9 Atp5d ATP synthasesubunit delta, mitochondrial 183.6 +
-Q62210 Birc2 Baculoviral IAP repeat-containing protein 2 65.9 +
-Bad Q61337 Bcl2 antagonist of cell death 116.2 - +
P21550 Eno3 Beta-enolase 161.0 +
-P34914 Ephx2 Bifunctionalepoxidehydrolase 2 441.9 +
-Q8R1G2 Cmbl Carboxymethylenebutenolidasehomolog 73.2 +
-Q61686 Cbx5 Chromoboxproteinhomolog 5 96.9 +
-Q3V079 Ccdc176 Coiled-coil domain-containing protein 176 66.5 +
-P50172 Hsd11b1 Corticosteroid 11-beta-dehydrogenase isozyme 1 100.4 +
-Cth Q8VCN5 Cystathioninegamma-lyase 100.5 - +
P48771 Cox7a2 Cytochrome c oxidase subunit 7A2, mitochondrial 185.6 +
-P10518 Alad Delta-aminolevulinicaciddehydratase 316.8 +
-Q9DBT9 Dmgdh Dimethylglycinedehydrogenase, mitochondrial 89.4 +
-Q99LC5 Etfa (OHFWURQWUDQVIHUÀDYRSURWHLQVXEXQLWDOSKDPLWRFKRQGULDO 77.6 +
-Q9ER73 Elp4 Elongatorcomplexprotein 4 103.4 +
-P63242 Eif5a Eukaryotic translation initiation factor 5A-1 104.8 +
-Q9QXD6 Fbp1 Fructose-1,6-bisphosphatase 1 154.4 +
-P17183 Eno2 Gamma-enolase 159.3 +
-Q3UHD2 Gfod1 Glucose-fructose oxidoreductase domain-containing protein 1 83.6 +
-P11352 Gpx1 Glutathioneperoxidase 1 419.0 +
-P24472 Gsta4 Glutathione S-transferase A4 127.0 +
-Q9QYE6 Golga5 Golginsubfamily A member 5 103.4 +
-P07901 Hsp90aa1 Heat shock protein HSP 90-alpha 67.4 +
-P11499 Hsp90ab1 Heat shock protein HSP 90-beta 107.9 +
-P68433 Hist1h3a Histone H3.1 163.6 +
-P84228 Hist1h3b Histone H3.2 163.6 +
-P84244 H3f3a Histone H3.3 163.6 +
-P02301 H3f3c Histone H3.3C 163.6 +
-Hgd O09173 Homogentisate 1,2-dioxygenase 95.6 - +
Hadh Q61425 Hydroxyacyl-coenzyme A dehydrogenase, mitochondrial 183.9 - +
Q5U5V2 Hykk Hydroxylysinekinase 78.0 +
-Q8BLR9 Hif1an Hypoxia-induciblefactor 1-alpha inhibitor 96.3 +
-O88844 Idh1 Isocitratedehydrogenase [NADP] cytoplasmic 69.5 +
-Q9CPU0 Glo1 Lactoylglutathionelyase 203.5 +
-P06151 Ldha L-lactatedehydrogenase A chain 153.0 +
-Acsl1 P41216 Long-chain-fatty-acid--CoA ligase 1 48.0 - +
Q9DB40 Med27 Mediator of RNA polymerase II transcription subunit 27 68.9 +
-Q8BPT6 Immp2l Mitochondrial inner membrane protease subunit 2 65.7 +
-Myef2 Q8C854 Myelinexpressionfactor 2 44.9 - +
Q9DC69 Ndufa9 NADH dehydrogenase [ubiquinone] 1 alpha subcomplexsubunit
9, mitochondrial
79.2 +
-Ncoa5 Q91W39 Nuclear receptor coactivator 5 67.7 - +
P11725 Otc Ornithinecarbamoyltransferase, mitochondrial 217.0 +
-O08807 Prdx4 Peroxiredoxin-4 391.3 +
-Prdx5 P99029 Peroxiredoxin-5, mitochondrial 174.7 - +
O08709 Prdx6 Peroxiredoxin-6 321.1 +
-P09411 Pgk1 Phosphoglyceratekinase 1 106.8 +
-Pgap2 Q3TQR0 Post-GPI attachment to proteins factor 2 60.0 - +
RESULTS
Liv e r F a n a ly sis
Mean±SD liver F concentrations found in 129P3/J
μ
than those found in A/J mice (0.015±0.002 μg/g) (t=4.929, p=0.0006).
/LYHUSURWHRPHSUR¿OHDQGLGHQWL¿FDWLRQRI
diffe r e n t ia lly e x pr e sse d pr ot e in s
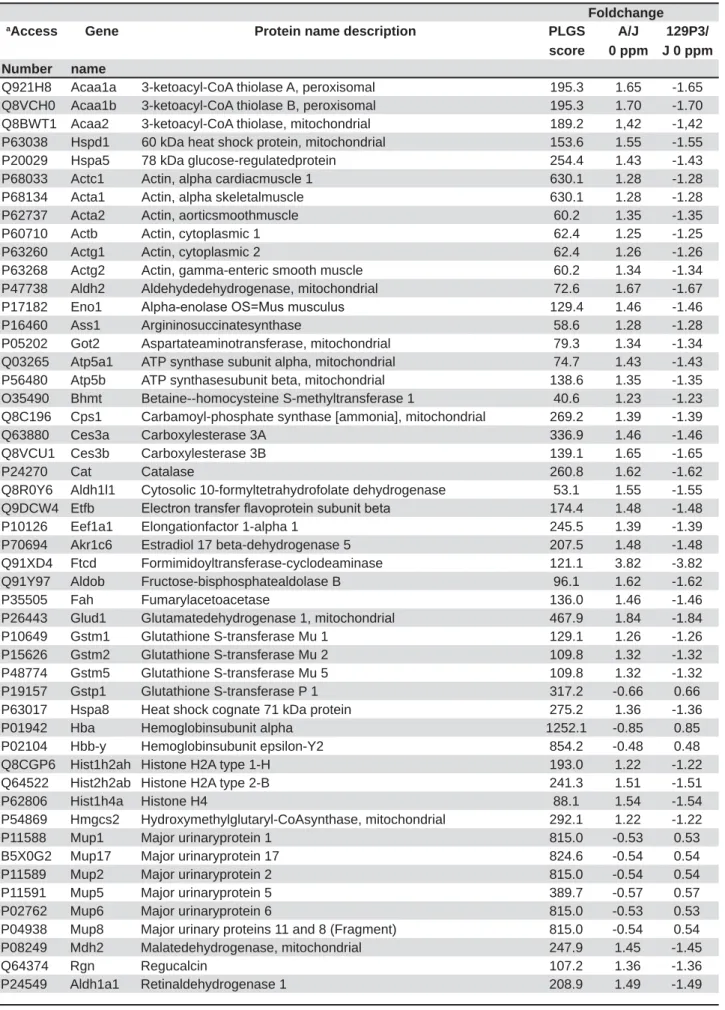
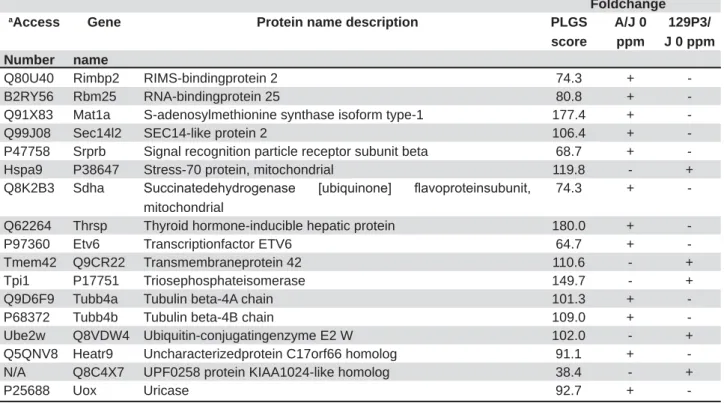
Table 1 shows proteins with expression changes in A/J and 129P3/J mice. In general, most proteins with fold change were increased in A/J mice.
Ge n e on t ology a n n ot a t ion
Figure 1 shows the functional classification according to the biological process with the most
Among them, the category with the highest percentage of genes was oxidation-reduction process (20%), followed by cellular amino acid metabolic process (16%) and response to oxidative stress (12%).
Pr ot e in - pr ot e in in t e r a ct ion n e t w or k
For the comparison displayed above, a network was created; employing all the interactions found in the search conducted using PSICQUIC. After the global network was created, nodes and edges were
Mus m usculus
taxonomy (10090). The value of fold change and also the p-value were added in new columns. The ActiveModules 1.8 plug-in to Cytoscape was used to make active modules connected subnetworks within the molecular interaction network whose
fold changes and p-value, as shown in the original proteomic analysis. Figure 2 shows the subnetwork generated by VizMapper. As can be seen, most proteins with fold change present interaction with Disks large homolog 4 (Q62108; 11 proteins) and Calcium-activated potassium channel subunit alpha-1 (Q08460; 18 proteins).
D I SCUSSI ON
129P3/J mice interestingly have been reported to excrete less F and as consequence to have higher circulating F levels, bone and enamel F levels and they still are remarkably resistant to
5,7-8,12. In this
study, even without administration of F through the drinking water and with consumption of a low-F
concentrations, which might have been due to the residual amounts of F present in their diets and is in-line with the metabolic characteristics of this strain regarding F4-5.
In this study, proteomic analysis of liver of 129P3/J and A/J mice was employed to provide insights into the possible mechanisms that could
Foldchange
aAccess Gene Protein name description PLGS
score
A/J 0 ppm
129P3/ J 0 ppm
Number name
Q80U40 Rimbp2 RIMS-bindingprotein 2 74.3 +
-B2RY56 Rbm25 RNA-bindingprotein 25 80.8 +
-Q91X83 Mat1a S-adenosylmethionine synthase isoform type-1 177.4 +
-Q99J08 Sec14l2 SEC14-like protein 2 106.4 +
-P47758 Srprb Signal recognition particle receptor subunit beta 68.7 +
-Hspa9 P38647 Stress-70 protein, mitochondrial 119.8 - +
Q8K2B3 Sdha 6XFFLQDWHGHK\GURJHQDVH >XELTXLQRQH@ ÀDYRSURWHLQVXEXQLW
mitochondrial
74.3 +
-Q62264 Thrsp Thyroid hormone-inducible hepatic protein 180.0 +
-P97360 Etv6 Transcriptionfactor ETV6 64.7 +
-Tmem42 Q9CR22 Transmembraneprotein 42 110.6 - +
Tpi1 P17751 Triosephosphateisomerase 149.7 - +
Q9D6F9 Tubb4a Tubulin beta-4A chain 101.3 +
-P68372 Tubb4b Tubulin beta-4B chain 109.0 +
-Ube2w Q8VDW4 Ubiquitin-conjugatingenzyme E2 W 102.0 - +
Q5QNV8 Heatr9 Uncharacterizedprotein C17orf66 homolog 91.1 +
-N/A Q8C4X7 UPF0258 protein KIAA1024-like homolog 38.4 - +
P25688 Uox Uricase 92.7 +
-7KHLGHQWL¿HGSURWHLQVDUHRUJDQL]HGDFFRUGLQJWRDOSKDEHWLFDORUGHU5HODWLYHGLIIHUHQWLDOLVLQGLFDWHGE\VLJQZKHQWKH
explain the differential metabolic handling and effects of F in these two strains. It has been shown that even without exposure to F, A/J mice present a higher retention of proteins in the maturing enamel9. For this reason, the mice
were not treated with F, because we wanted to
were intrinsic to the strains. Most proteins with fold change were increased in the A/J mice (Table 1), with fold changes ranging between 1 and 2.
Form im idoylt ransferase- cyclodeam inase, however, was increased 3.82 times in A/J mice. This enzyme
patients with autoimmune hepatitis14 and is found
down-regulated in hepatocellular carcinoma16. Fo r m i m i d o y l t r a n sf e r a se - cy cl o d e a m i n a se has two enzymatic functions. In one of them, formiminotetrahydrofolate and glutamate are produced. Through its cyclodeaminase function, the enzyme breaks down formiminotetrahydrofolate, involved in the synthesis of purines and pyrimidines, and amino acids (UNIPROT). Thus, the increase in this enzyme might explain the increased expression of other liver proteins in A/J mice due to higher supply of nucleotides and amino acids.
Remarkably, the functional category with the highest percentage of altered genes was oxidation-reduction process. The increase of proteins such as ATP synthase subunit alpha, mitochondrial, Heat shock cognate 71 kDa protein, Electron
Beta-enolase, Gamma-enolase and, Malate dehydrogenase in the A/J mice indicate an increased
concomitant increase in GRP78, which suggests endoplasmic reticulum (ER) stress20. ER stress
occurs when nascent proteins are misfolded or not folded properly, leading to the initiation of the unfolded protein response, as the unfolded proteins accumulate in the ER13. It has been demonstrated
that F is able to induce an ER stress response in the LS8 ameloblast-derived cell line, which could be
13.
In addition, administration of F through the drinking water is able to increase the expression of GRP78 in the liver of rats20. Thus, considering that A/J mice
oxidative stress even without exposure to F, this exposure has been shown to worsen oxidative stress20, which can implicate in the pathogenesis 8, this can be a hypothesis for
the high susceptibility of the A/J to the effects of F. The proteins in the center of the protein-protein interaction network are related to potassium channels. One of them (calcium-activated potassium channel subunit alpha-1) is a potassium channel activated either by membrane depolarization or increase in cytosolic Ca2+ that mediates export
of K+. It is also activated by the concentration Figure 1- )XQFWLRQDO GLVWULEXWLRQ RI SURWHLQV LGHQWL¿HG ZLWK GLIIHUHQWLDO H[SUHVVLRQ LQ OLYHU RI PLFH EHORQJLQJ WR$- YV
S-VWUDLQV&DWHJRULHVRISURWHLQVEDVHGRQ*2DQQRWDWLRQ%LRORJLFDO3URFHVV7HUPVVLJQL¿FDQW.DSSD DQG
of cytosolic Mg2+. Its activation dampens the
excitatory events that elevate the cytosolic Ca2+
concentration and/or depolarize the cell membrane. Therefore, it contributes to the repolarization of the membrane potential and plays a key role in controlling excitability in a number of systems, such as regulation of the contraction of smooth muscle21, the tuning of hair cells in the cochlea6,
regulation of transmitter release6 and innate
immunity2. The other one is Disks large homolog
4 that is required for synaptic plasticity associated with NMDA (N-methyl-D-aspartate) receptor signaling11. It interacts with shaker-type potassium
channels and the cytoplasmic tail of NMDA receptor
presence of a protein associated with the nervous system in the center of the network in this study. However, we must consider that liver failure leaves to the accumulation of ammonia, which affects the cerebral function10. As mentioned above, A/J
mice presented several proteins related to the
have caused oxidative stress and contributed to liver damage, which in turn might have provoked cerebral alterations. Since this was a preliminary exploratory work, future studies comparing the
should be conducted to add new light into this topic. Also, additional studies should be done to quantify, by other techniques, the proteins with changing expression in this study. Despite being an exploratory study, the lack of additional techniques
limitation of this study.
CON CLUSI ON S
In conclusion, A/J mice had an increase in
This could be a possible explanation for the high susceptibility of these mice to the effects of F, since
Figure 2- Subnetworks generated by VizMapper for each comparison – A Group A/J vs. 129p3/J. Color of node and * indicate the differential expression of the respective protein, for each comparison. Red and green nodes indicate protein down-regulation and up-regulation, respectively, while * and ** indicate presence and absence of protein, respectively,
LQWKHUHVSHFWLYHJURXS3XUSOHQRGHLQGLFDWHVSURWHLQVSUHVHQWLQJLQWHUDFWLRQEXWWKDWZHUHQRWLGHQWL¿HGLQWKHSUHVHQW
study. The access numbers in nodes correspond to: P68134- (Acta1)Actin, alpha skeletal muscle; P10518- (Alad)
Delta-DPLQROHYXOLQLF DFLG GHK\GUDWDVH 4'&: (WIE (OHFWURQ WUDQVIHU ÀDYRSURWHLQ VXEXQLW EHWD 3 $FWE $FWLQ
F exposure also induces oxidative stress.
ACKN OW LED GM EN TS
The authors thank CNPq/TWAS for granting the
CON FLI CT OF I N TEREST STATEM EN T
REFEREN CES
1- Bauer-Mehren A. Integration of genomic information with biological networks using Cytoscape. Methods Mol Biol. 2013;1021:37-61.
2- Butler A, Tsunoda S, McCobb DP, Wei A, Salkoff L. mSlo, a complex mouse gene encoding "maxi" calcium-activated potassium channels. Science. 1993;9;261(5118):221-4.
3- Bradford MM. A rapid and sensitive method for the quantitation of microgram quantities of protein utilizing the principle of protein-dye binding. Anal Biochem. 1976;72: 248-54.
4- Carvalho JG, Leite AL, Peres-Buzalaf C, Salvato F, Labate CA, Everett ET, et al. Renal proteome in mice with different 5- Carvalho JG, Leite AL, Yan D, Everett ET, Whitford GM, Buzalaf mice. J Dent Res. 2009;88(11):1054-8.
6- Cabo R, Zichichi R, Viña E, Guerrera MC, Vázquez G, García-Suárez O, et al. Calcium-activated potassium channel SK1 is widely expressed in the peripheral nervous system and sensory organs 7- Charone S, Leite AL, Peres-Buzalaf C, Fernandes MS, Almeida LF, Graeff MS, et al. Proteomics of secretory and maturation stage enamel of genetically distinct mice. Caries Res. 2016;50:24-31. 8- Everett ET, McHenry MA, Reynolds N, Eggertsson H, Sullivan inbred mouse strains. J Dent Res. 2002;81(11):794-8.
9- Everett ET, Yan D, Weaver M, Liu L, Foroud T, Martinez-Mier Loci on mouse chromosomes 2 and 11. Cells Tissues Organs. 2009;189(1-4):212-8.
10- Felipo V. Hepatic encephalopathy: effects of liver failure on brain function. Nat Rev Neurosci. 2013;14(12):851-8.
11- Halff AW, Gómez-Varela D, John D, Berg DK. A novel mechanism for nicotinic potentiation of glutamatergic synapses. J Neurosci. 2014;5;34(6):2051-64.
12- Kobayashi CA, Leite AL, Peres-Buzalaf C, Carvalho JG, Whitford
13- Kubota K, Lee DH, Tsuchiya M, Young CS, Everett ET, Martinez-Mier EA, et al. Fluoride induces endoplasmic reticulum stress in ameloblasts responsible for dental enamel formation. J Biol Chem. 2005;280(24):23194-202.
1 4 - L a p i e r r e P, H a j o u i O , H o m b e r g J C , A l va r e z , F. Formiminotransferase cyclodeaminase is an organ-specific autoantigen recognized by sera of patients with autoimmune hepatitis. Gastroenterology. 1999;116:643-9.
15- Leite AL, Lobo GV, Pereira HA, Fernandes MS, Martini T, Zucki F, et al. Proteomic analysis of gastrocnemius muscle in rats with streptozotocin-induced diabetes and chronically exposed to 16- Liang CR, Leow CK, Neo JC, Tan GS, Lo SL, Lim JW, et al. Proteome analysis of human hepatocellular carcinoma tissues by two-dimensional difference gel electrophoresis and mass spectrometry. Proteomics. 2005;5(8)2258-71.
17- Lobo JG, Leite AL, Pereira HA, Fernandes MS, Peres-Buzalaf sensitivity in experimental diabetes. J Dent Res. 2015;94(7):990-7.
18- Millan PP. Visualization and analysis of biological networks. Methods Mol Biol. 2013;1021: 63-88.
19- Orchard S. Molecular interaction databases. Proteomics. 2012;12(10):1656-62.