118
Cardiac magnetic resonance imaging has undergone great de-velopment in the last decade, and its applications for assessing patients with cardiac ischemic disease are increasingly compre-hensive. Current cardiac magnetic resonance imaging techniques, especially the protocols based on delayed contrast enhancement, provide precise delimitation of the areas of myocardial necrosis or fibrosis in patients with previous infarction 1-7. On delayed
contrast-enhanced images, the infarcted areas had a very increased signal intensity (white areas) as compared with those of healthy myo-cardium (dark areas). The marked contrast between the necrotic or fibrotic tissue and the intact myocardium (signal intensity may be up to 10 times greater in infarcted areas) 8, in addition to the
excellent spatial resolution provided by cardiac magnetic resonance imaging, allow a precise evaluation of the infarcted area.
In a study published in 1998, Wu et al 9 reported that infarction
size, expressed as a percentage of left ventricular mass, has a significant prognostic value in patients with acute myocardial in-farction. In addition, 2 other recent studies 10,11 showed that
in-farcted mass evaluation was predictive of the recovery of overall and segmentary systolic function in that group of patients. Fur-thermore, a recent study by Kim et al 12 reported that the presence
of myocardial viability, defined as the regional functional recovery after myocardial revascularization, may be determined through quantification of the transmural extent of the infarction. That same study also reported that the greater the dysfunctional myocardial mass that was viable prior to the intervention, the greater the overall recovery of the ejection fraction after revascularization. Therefore, determination of the infarcted mass on cardiac magnetic resonance imaging may provide important and very useful infor-mation for the management of patients with previous acute myo-cardial infarction.
Currently, cardiac magnetic resonance imaging is considered the best method for assessing left ventricular infarcted mass, sur-passing the PET technique for detecting subendocardial defects 13.
The technique usually used is direct quantification through planimetry of the delayed contrast-enhanced areas. However, planimetry is a very laborious method that requires a considerable amount of time after image processing. In addition, it requires the use of specific software, which is not always easily available. On the other hand, the scoring method, which is based on the semiquantitative visual assessment of delayed contrast-enhanced images, is a much faster and more practical alternative for determining infarction extension.
Original Article
Quantification of Left Ventricular Infarcted
Mass on Cardiac Magnetic Resonance Imaging.
Comparison Between Planimetry and the
Semiquantitative Visual Scoring Method
Clerio Francisco de Azevedo Filho, Marcelo Hadlich, João Luiz Fernandes Petriz,
Luís Antonio Mendonça, Jorge Neval Moll Filho, Carlos Eduardo Rochitte
Rio de Janeiro, RJ and São Paulo, SP - Brazil
Objective
To compare a new semiquantitative visual scoring method with quantitative digital planimetry for determining left ventri-cular infarcted mass by use of cardiac delayed contrast-enhanced magnetic resonance imaging.
Method
Seventy-seven patients with previous myocardial infarction underwent delayed contrast-enhanced magnetic resonance ima-ging using a 1.5T device for assessing myocardial viability and calculating the infarcted mass. Cine magnetic resonance imaging was used for assessing left ventricular function with the Simpson method. The infarcted mass was calculated on the delayed con-trast-enhanced images according to the following 2 methods: planimetry and the scoring method. Simple linear regression and correlation and agreement between the methods and ob-servers according to the Bland-Altman plot were used.
Results
The infarcted areas in all 77 patients were detected by use of cardiac delayed contrast-enhanced magnetic resonance ima-ging. The size of the infarction measured by planimetry was similar to that obtained with the scoring method, with a mean difference between measurements of only 1.03% of the left ventricular mass. Inter- (0.41%) and intraobserver (0.34%) va-riabilities indicated an excellent reproducibility of the scoring method. Infarcted mass showed a good correlation with ejection fraction and indexed end-diastolic and end-systolic volumes, r=-0.76, r=0.63, and r=0.67, respectively.
Conclusion
In patients with previous myocardial infarction, delayed-enhanced magnetic resonance imaging provides accurate infarct size quantification by planimetry and by semiquantitative score.
Key words
myocardial infarction, magnetic resonance imaging, myocardial viability
Rede de Hospitais D’Or, LABS/RJ, and InCor of the Hospital das Clínicas of the FMUSP
Mailing address: Carlos Eduardo Rochitte - Av. Dr. Eneas de Carvalho Aguiar, 44 - Cep 05403-000 - São Paulo, SP, Brazil
E-mail: [email protected] Received: 4/17/03
Accepted: 12/3/03
119
It also has the advantage of depending only on the visualization of images in 3 different forms: digitalized on a monitor, developed on radiographic film, or printed on photographic paper. Our study aimed at introducing and describing the infarction size quantification on cardiac magnetic resonance imaging using the delayed contrast-enhanced technique, and at determining whether the calculation of the infarcted mass by use of the scoring method is valid and reliable when compared with that by use of the quantitative method of digital planimetry.
Method
This study comprised 77 patients (60 males and 17 females, with a mean age of 59.9±10.6 years) diagnosed with previous
acute myocardial infarction (subacute and chronic, ≥ 2 weeks
after infarction) and referred to our service to undergo cardiac magnetic resonance imaging for assessing myocardial viability from October 2001 to October 2002. Four patients had 2 distinct episodes of previous acute myocardial infarction, adding up to 81 different infarcted areas identified as follows: anterior, 35 (43%); inferior, 29 (36%); and lateral, 17 (21%); of which, 48 (59%) were transmural, and 33 (41%) were subendocardial.
The patients underwent magnetic resonance imaging with a Philips Gyroscan NT Intera device of 1.5T equipped with the Po-wertrack 6000 high-performance gradient system (Philips Medical Systems, Best, The Netherlands). The gadolinium intravenous con-trast medium (Dotaren®), specific for magnetic resonance imaging,
was used at the dosage of 0.2 mmol/kg. Image acquisition was performed approximately 10 to 15 minutes after contrast admi-nistration, using a sequence of pulses of the T1 turbo field echo type, synchronous with vectorcardiographic monitoring. Eight cuts of the left ventricular short axis were sequentially performed covering the length of the entire ventricular cavity, from the apex to the mitral ring. Acquisition of each cut lasted approximately 8 seconds (around 8 to 12 heart beats, depending on heart rate), during which the patient was requested to perform a respiratory pause when expiring. The trigger delay of the sequence was adjusted so that the images were acquired during ventricular diastole. The acquisition of each segment of the K space was preceded by an inversion-recovery prepulse with an inversion time (IT) adjusted to neutralize the signal of the healthy myocardium, therefore, increa-sing the contrast between the infarcted regions (intense signal – white) and the healthy myocardium (very weak signal – dark) 8.
The pulse sequence is called the delayed contrast enhancement technique, and figure 1 depicts a typical example. The technical parameters used were as follows (appendix): TR, 5.7 ms; TE, 2.8 ms; flip angle (FA), 20º; field of view (FOV), 350-420 mm; matrix, 192 x 192; rectangular field of view (RFOV), 75%; inversion time (IT), 170-300 ms; number of signals averaged or acquired (NSA), 2; number of cuts, 8-10; cut thickness, 8 mm; interval between the cuts (gap), 2 mm (therefore, 1 cut every 10 mm from the heart apex to the base).
In addition to analyzing the infarcted areas, the left ventricular function of all patients studied was also assessed 14-18. For this
purpose, cine magnetic resonance imaging of the left ventricular short axis was performed, covering the entire ventricular cavity (precisely at the same anatomical locations of the delayed contrast enhancement images), using a sequence of pulses of the T1 turbo
field echo type with transverse magnetization in the steady state condition (Balanced Fast Field Echo or B-FFE) 19-23 with the
follo-wing technical parameters: TR, 3.1 ms; TE, 1.55 ms; flip angle (FA), 55º; field of view (FOV), 350-420 mm; matrix, 192 x 128; rectangular field of view (RFOV), 75%; number of cardiac phases, 24; number of signals averaged or acquired (NSA), 1; number of cuts, 8-10; thickness of the cut, 8 mm; interval between the cuts (gap), 2 mm.
All images were stored on optical disks and later processed in the Philips Easyvision Workstation. The infarcted areas, defined as the regions that showed delayed contrast enhancement, were then assessed in the 2 following manners: 1) the quantitative digital planimetry method, and 2) the scoring method.
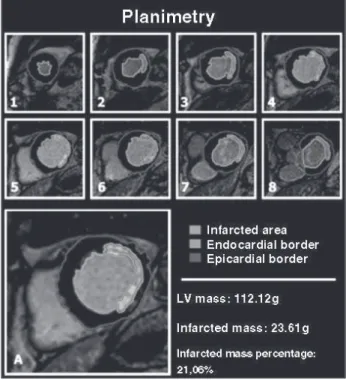
The quantitative digital planimetry method required specific software and consisted of manually designing the contour of the delayed contrast-enhanced regions in the cuts with infarcted areas (fig. 2). The infarcted tissue volume was calculated as the sum of the areas undergoing planimetry multiplied by the thickness of each cut. So that the value of the infarcted mass could be calcu-lated in grams, the infarcted volume was multiplied by the density of the myocardial tissue (1.05g/mL). The next step consisted of manually designing the contour of the left ventricular endocardial and epicardial borders in 8 cuts. The left ventricular volume was calculated as the difference between the left ventricular epicardial and endocardial volumes (LV volume = epicardial volume – endo-cardial volume). The endoendo-cardial and epiendo-cardial volumes were determined according to the Simpson method as follows: the sum of the endocardial and epicardial areas multiplied by the thickness of each cut. The left ventricular mass was then defined as the LV volume multiplied by the density of the myocardial tissue (1.05 g/mL). The percentage of left ventricular infarcted mass was calculated as follows: infarcted mass (%LV) = (infarcted mass/LV mass)*100 (equation 1).
Appendix
Technical parameters of cardiac magnetic resonance imaging:
• T → tesla → unit of intensity of the magnetic field • TFE → turbo field echo
• B-FFE (balanced fast field echo) → balanced or steady state fast field echo • TR → time of repetition
• TE → time of the echo • FA → flip angle • FOV → field of view
• RFOV → rectangular field of view • NSA → number of signals averaged
120
imaging as follows: manual contour, in specific software, of the left ventricular border in the diastolic (greater area) and systolic (smaller area) phases in the 8 cuts of the left ventricular short axis. The EDV was measured as the sum of the products of the area of each cut in the diastolic phase multiplied by the thickness of the cut. The ESV was calculated similarly, but using the systolic phase of each cut for calculation. The SEV was calculated as follows: SEV = EDV-ESV; and the EF was calculated as follows: EF = (SEV/EDV)*100. The volumes EDV, ESV, and SEV were then normalized for the body surface area, generating the para-meters IEDV, IESV, and ISEV.
Data of all variables obtained were filed and analyzed using the STATA statistical program, version 7.0. All continuous variables were expressed as mean ± standard deviation. The 2-tailed paired
Student t test was used to compare the related samples. The
degree of agreement between the methods, as well as the intra-and interobserver variabilities of the scoring method, were assessed by use of the analysis method reported by Bland and Altman 24.
The linear regression analysis and Pearson correlation were also used for assessing the relation between both methods (planimetry versus scoring) and the relation between the ventricular function data and the percentage of infarcted mass. The results were con-sidered statistically significant when P<0.05.
Results
Cardiac delayed contrast-enhanced magnetic resonance could detect myocardial necrosis or fibrosis in all 77 patients studied with The scoring method consisted of the visual evaluation of 8
cuts performed by 2 independent observers, who ignored the results of planimetry. The cuts were divided into 48 segments as follows: cuts 1 and 2 (apical cuts) with 4 segments each; cuts 3 to 6 (middle cuts) with 6 segments each; and cuts 7 and 8 (basal cuts) with 8 segments each. This division was elaborated in a way to provide weight between the masses of different cuts, con-sidering that apical cuts have smaller mass, and, therefore, have a smaller participation (weight) in determining the final mass when compared with basal cuts (fig. 3).
Each segment received a score according to the percentage of involvement obtained on delayed contrast enhancement (score zero, 1, 2, or 3). Score zero corresponded to the absence of contrast enhancement; score 1 corresponded to a contrast enhan-cement of 1 to 25% of the area of the segment; score 2 corres-ponded to a contrast enhancement of 26 to 75%; and score 3 corresponded to a contrast enhancement greater than 75% of the area of the segment. The total score of each patient was defined as the sum of the scores of the 48 segments analyzed, 144 being the maximum score possible (3*48 segments). The percentage of LV infarcted mass was then calculated as follows: infarcted mass (%LV) = (total score of the patient/144)*100. (equation 2).
For determining the intraobserver variability of the scoring method, 1 of the 2 observers calculated the percentage of infarcted mass of each patient on 2 occasions, separated by an interval of 1 to 4 months.
For assessing the left ventricular function in each patient, the following 4 parameters were calculated using the Simpson method: ejection fraction (EF); end-diastolic volume (EDV); end-systolic volume (ESV); and systolic ejection volume (SEV). These para-meters were obtained from the images of cine magnetic resonance
Fig. 2 - Images of the planimetry method in a patient with infarction of the LV lateral wall. In the 8 cuts of the short axis, from the apex (1) to the base (8), the manual contour of the endocardial (light blue) and epicardial (dark blue) borders was per-formed to determine the LV mass, and the manual contour of the delayed contrast-enhanced areas (red) was performed to determine the infarcted mass. The percentage of infarcted mass was then calculated as follows: (infarcted mass/LV mass)*100.
121
a history of previous acute myocardial infarction. The infarcted re-gions were qualitatively considered analyzable in all cases, both from the point of view of area of measurement and transmural extent. A typical example of this examination is depicted in figure 1.
Infarction size, defined as the percentage of the left ventricular infarcted mass, was slightly greater when measured using plani-metry (19.94±11.10%) than when measured using the scoring method (18.92±10.41%). The mean difference between the mea-surements obtained using both methods was 1.03% (95% confi-dence interval of 0.15 to 1.91%). Despite reaching statistical significance (P=0.02), this small difference is not significant from the clinical point of view, because it represents only approximately 1% of the total left ventricular mass. More important, the 95% agreement limit between the 2 methods was -6.74 to +8.80% (fig. 4 and tab. I).
Therefore, from the practical point of view and in routine clinical use, the size of the infarction measured through planimetry was similar to the values of the scoring method obtained by the 2 independent observers and to the mean of these values.
The significant correlation between the 2 methods was also demonstrated through the linear regression analysis, considering planimetry as the dependent variable and the score as the inde-pendent variable. The equation of the regression line was calculated as y=1.00x + 1.05, with a 95% confidence interval of the ‘b’ coefficient of 0.91 to 1.08, and a standard deviation of the residues of 3.91 (P<0.0001) (tab. II). The Pearson correlation coefficient also showed an extremely significant relation between both methods (r = 0.94; P<0.0001) (fig. 5).
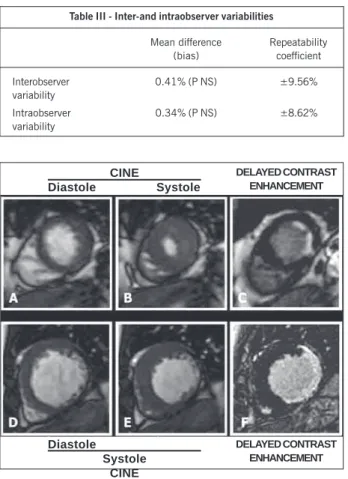
Assessment of the interobserver variability of the scoring method showed a mean difference of 0.41% (NS) between the measure-ments obtained by the 2 observers and a ±9.56% repeatability coefficient. On the other hand, assessment of the intraobserver variability showed a mean difference of 0.34% (NS) and a repea-tability coefficient of ±8.62% (tab. III).
The size of the infarction, measured both through planimetry and the scoring method, showed a significant correlation with the left ventricular ejection fraction measured through the Simpson method (r= -0.74; P<0.0001 for planimetry; and r= -0.76; P<0.0001 for the scoring method) (fig. 6). In addition to the ejection fraction, the indices of end-diastolic volume (IEDV) and end-systolic volume (IESV) also had a significant correlation with the size of the infarction (IEDV: r= 0.63 and 0.67; P<0.0001; and IESV: r= 0.73 and 0.75; P<0.0001, respectively, for plani-metry and the scoring method) (fig. 7). The indexed systolic volume (ISEV) showed no correlation with infarction size measured through the 2 methods (r= -0.27; P=0.03 for planimetry; and r=-0.19, NS for the scoring method).
Discussion
This study showed that quantification of the size of the infarc-tion, as well as its characterization and delineainfarc-tion, may be obtained through cardiac magnetic resonance imaging using the delayed contrast-enhanced technique with great precision and reproduci-bility. The scoring method rapidly and accurately quantified the infarcted mass compared with the planimetry method. The good agreement and correlation observed between the 2 methods allow us to indicate the scoring method as a rapid and practical alternative for the calculation of infarcted mass, which may then be incorpo-rated into the routine of cardiac magnetic resonance imaging reports, becoming of fundamental clinical importance, because the diagnostic and prognostic value of assessing the infarcted mass has been systematically reported in recent studies 9-12.
The delayed contrast-enhanced technique was developed from the pioneering studies by Lima et al 25, assessing the detection and
characterization of the infarcted areas through cardiac gadolinium-enhanced magnetic resonance imaging. The delayed contrast-enhanced technique was initially used in the experimental and clinical studies of the group led by Kim and Judd 1-4,10,12,26,27 and
described from the technical point of view by Simonetti et al 8. The
delayed contrast-enhanced technique is based on a sequence of pulses of the T1 turbo field echo type (T1 Turbo Field Echo), with an inversion-recovery prepulse and an inversion time (IT) adjusted to neutralize the healthy myocardium signal. Therefore, in the images acquired with this technique, the intact myocardium ap-pears as a signal of very low intensity (dark). Another characteristic of the delayed contrast-enhanced technique is the use of the intravenous contrast gadolinium, which does not penetrate intact cell membranes, and, therefore, has an extracellular distribution. In the infarcted regions, rupture of the membranes of necrotic myocytes occurs, and, therefore, gadolinium may be freely distri-buted (greater distribution volume) 28-30. In addition, as the necrosis
of myocytes also causes an alteration in the kinetics of contrast distribution, gadolinium leaves the infarcted areas more slowly (delayed washout) 2. These 2 factors cause the concentration of
the contrast medium in the necrotic regions, approximately 10 to 15 minutes after its injection, to be much greater than that in the healthy myocardial tissue 31. As a consequence, the infarcted
areas are white (intense signal) in delayed contrast-enhanced images. Briefly, by increasing the intensity of the signal in the infarcted area (using gadolinium and weighed images in T1) and
Difference
(Planimetry-Scoring)
15
10
5
0
-5
-10
-15
0 10 20 30 40 50 60
Infarcted mass percentage (Planimetry+Scoring)/2
Fig. 4 - Result of the Bland-Altman plot of the data obtained by use of the scoring method and planimetry. The mean difference (bias) is represented by the white horizontal line, and the agreement limit is represented by the black horizontal lines.
+8.80
1.03
-6.74
Table I - Bland-Altman plot – planimetry x scoring method
Mean Standard Standard P 95% agreement
difference deviation error limit
Mean of the 1.03 3.89 0.44 0.02 -6.74to + 8.80
observers
Observers 1 1.23 4.26 0.49 0.01 - 7.28to +9.74
122
Table III - Inter-and intraobserver variabilities
Mean difference Repeatability
(bias) coefficient
Interobserver 0.41% (P NS) ±9.56%
variability
Intraobserver 0.34% (P NS) ±8.62%
variability
Table II - Linear regression and Pearson correlation
Equation of Standard error of Standard deviation Pearson correlation P
the regression line the ‘b’ coefficient of the residues coefficient
Mean of the observers y = 1.00x + 1.05 0.043 3.91 0.94 <0.001
Observer 1 y = 0.92x + 2.69 0.043 4.19 0.93 <0.001
Observer 2 y = 0.98x + 1.20 0.055 4.88 0.90 <0.001
y = planimetry, x = scoring method.
Scoring
60
50
40
30
20
10
0 0
0 10 20 30 40 50
Planimetry
60 r = 0.93
Fig. 5 - Correlation between the results obtained by use of the semiquantitative scoring method and the planimetry method.
decreasing the intensity of the signal of the healthy myocardium (with inversion prepulse and IT around 200-300 ms), the delayed contrast-enhanced technique optimizes the contrast between the 2 tissues (signal difference of up to 1080%), allowing precise delimitation of the necrotic myocardial areas 8.
In the case of old infarctions, fibrosis, and not necrosis, is the underlying pathological phenomenon. In these cases, the larger extra-cellular space observed in the fibrotic tissue as compared with that in the healthy myocardium is the cause of the greater distribution volume and the alteration in the kinetics of gadolinium (delayed washout of the contrast medium from the fibrotic tissue) 31.
Several recent studies have validated the measurement of the infarction size through cardiac magnetic resonance imaging as compared with the direct measurement of the infarcted mass on pathological anatomy 1-3,5. The technique for measuring the
in-farcted mass used in these studies was planimetry of the delayed contrast-enhanced areas, which showed excellent agreement and correlation with the values obtained on pathological anatomy using TTC staining. Therefore, in our study, calculation of the infarcted mass through planimetry was considered the gold standard as compared with the scoring method developed by our group.
Correlation between the 2 methods, measured through the Pearson correlation coefficient, was very expressive and statistically significant (r=0.93; P<0.0001). The linear regression analysis also showed very consistent results (tab. II). However, as reported by Bland and Altman in their study on the comparison of the 2
measurement methods 24, assessment of the agreement between
methods is more important than the correlation or linear regression. Based on the analysis reported by Bland and Altman, we showed that the mean difference between the values of infarcted mass obtained through the 2 methods was not significant from the clinical point of view: only 1.03% (95% confidence interval of 0.15 to 1.91%). Although statistically significant (P<0.02), be-cause the number of patients studied was expressive (n=77), this small difference does not significantly interfere with the approach of patients assessed through the scoring method, because it re-presents only 1% of the total left ventricular mass. The agreement limit of the 2 methods was –6.74% to 8.80%, showing that, for a certain patient, the percentage of the infarcted mass measured using the scoring method, 95% of the time, will have a difference lower than 8.8% of the value that would be obtained if it were calculated with planimetry. This characterizes a fully acceptable degree of agreement from the clinical point of view, showing that the semiquantitative visual method may safely replace the plani-metry method in daily clinical routine. In addition, as shown in the Bland-Altman plot (fig. 4), the dispersion of the individual differences around the mean difference (bias) is very homogeneous, independent of the extension of the infarction. In other words, the CINE
Diastole Systole
DELAYED CONTRAST ENHANCEMENT
Diastole
Systole CINE
Fig. 6 - Images of cine delayed contrast-enhanced magnetic resonance imaging showing the effect of infarction extension on left ventricular function. In the upper panels, 2 images of cine-MRI are observed, 1 in diastole (A) and the other in systole (B), showing good segmentary systolic function. Both were obtained in a patient with a small subendocardial infarction of the lateral wall, observed in the delayed contrast-enhanced image to the right (C). In the lower panels, from another patient, important segmentary dysfunction of the LV lateral wall is seen in the cine-MRI images (D and E). Note the clear parietal thickening in the septal region (from panel D to panel E) and the lack of thickening in the lateral wall. In the delayed contrast-enhanced image (F), precisely in this segment, note the extensive transmural infarction of the LV lateral wall.
123
1. Judd RM, Lugo-Olivieri CH, Arai M et al. Physiological basis of myocardial con-trast enhancement in fast magnetic resonance images of 2-day-old reperfused ca-nine infarcts. Circulation 1995; 92: 1902-10.
2. Kim RJ, Chen EL, Lima JA, Judd RM. Myocardial Gd-DTPA kinetics determine MRI contrast enhancement and reflect the extent and severity of myocardial injury after acute reperfused infarction. Circulation 1996; 94: 3318-26.
3. Kim RJ, Fieno DS, Parrish TB et al. Relationship of MRI delayed contrast enhan-cement to irreversible injury, infarct age, and contractile function. Circulation 1999; 100: 1992-2002.
References
4. Mahrholdt H, Wagner A, Holly TA et al. Reproducibility of chronic infarct size mea-surement by contrast-enhanced magnetic resonance imaging. Circulation 2002; 106: 2322-7.
5. Rochitte CE, Lima JA, Bluemke DA et al. Magnitude and time course of microvas-cular obstruction and tissue injury after acute myocardial infarction. Circulation 1998; 98: 1006-14.
6. Schaefer S, Malloy CR, Katz J et al. Gadolinium-DTPA-enhanced nuclear magnetic resonance imaging of reperfused myocardium: identification of the myocardial bed at risk. J Am Coll Cardiol 1988; 12: 1064-72.
reproducibility of the scoring method is good for patients with both small and extensive infarctions.
The good reproducibility of the scoring method was also de-monstrated through the analysis of inter- and intraobserver varia-bilities. The mean difference (bias) between the measurements obtained by the 2 observers was lower than 0.5%, and the repea-tability coefficient was lower than 10%. This coefficient represents the degree of variation between the results obtained by the 2 observers and is calculated as twice the standard deviation of the difference between those measurements. The results obtained when comparing the 2 measurements calculated by the same observer at different times (intraobserver variability) were very similar: bias lower than 0.4% and repeatability coefficient lower than 9%. Similarly to the comparison with planimetry, assessment of scoring method reproducibility showed repeatability coefficients confirming very acceptable degrees of inter- and intraobserver va-riability from the point of view of clinical applicability.
Recently, Wu et al 9 reported that patients with acute
myo-cardial infarction have a poorer prognosis as the amount of infarcted mass increases. Later, Choi et al 10 reported that the determination
of the transmural extent of the infarction allows prediction of the spontaneous recovery of left ventricular segmentary contractility in patients with acute myocardial infarction. Gerber et al 11 also
reported that the potential of recovery of regional contractility, quantitatively measured by using the tagging technique, may be defined through the evaluation of delayed contrast-enhanced pat-terns in patients with acute myocardial infarction. Moreover, an important study with great clinical repercussions, showing the usefulness of the delayed contrast-enhanced technique for assessing patients with coronary heart disease indicated for myocardial re-vascularization, was developed by Kim et al 12 and recently published
in The New England Journal of Medicine. These authors reported
that regional myocardial viability might be determined through the evaluation of the transmural extent of infarcted areas in delayed contrast-enhanced images.
Correlation between infarction size and left ventricular function is intuitive and has already been shown in studies using nuclear medicine techniques 32,33. However, extension of the infarcted
area and left ventricular function are more precisely determined on cardiac magnetic resonance imaging than by the use of nuclear medicine techniques 4,13, due to its greater spatial resolution. Our
study was the first to show through cardiac magnetic resonance imaging an expressive correlation between the size of the infarction measured through the delayed contrast-enhanced technique and the data of left ventricular function measured using the Simpson method. In their study on the prognostic value of microvascular obstruction, Wu et al 9 reported no statistically significant
correla-tion between these parameters. In turn, Klein et al 13 reported only
a discrete inverse correlation (r= -0.42) between infarction size and ejection fraction. Future large-scale studies specifically designed to clarify this correlation are required to assess the prognostic value of each parameter in isolation. An important question to be answered by these studies is whether the infarcted mass could become an even more important prognostic factor than left ventricular ejection fraction in patients with acute myocardial infarction.
In conclusion, the assessment of patients with previous acute myocardial infarction on cardiac magnetic resonance imaging using the delayed contrast-enhanced technique allows the reproducible determination of the size of the infarction both through the plani-metry method and the semiquantitative scoring model. Planiplani-metry requires that the contours of the infarcted areas and the left ventricular endocardial and epicardial borders in all cuts of the short axis be manually designed in specific software. This makes it an extremely laborious method that requires a considerable amount of time after image processing, being, therefore, difficult to implement into a daily clinical routine. On the other hand, the scoring method based on semiquantitative visual assessment of the delayed contrast-enhanced images is a much faster and more practical alternative for determining the extension of the infarction. Our study was the first to show that a simpler method for deter-mining the infarcted mass could replace with good accuracy and reproducibility the more laborious method of planimetry. We believe that the use of the scoring method may allow the percentage of left ventricular infarcted mass to be more routinely calculated on cardiac magnetic resonance imaging in patients with previous myocardial infarction. Thus, these objective data of great diagnostic and prognostic importance may be regularly included in cardiac magnetic resonance imaging reports.
EF IEDV IESV
Scoring
P
la
n
im
e
tr
y 60
40
20
0/60
40
20
0
0 30 60 90/0 40 80 120 160/0 40 80 120 140
124
7. Wu E, Judd RM, Vargas JD, Klocke FJ, Bonow RO, Kim RJ. Visualisation of pre-sence, location, and transmural extent of healed Q-wave and non-Q-wave myo-cardial infarction. Lancet 2001; 357: 21-8.
8. Simonetti OP, Kim RJ, Fieno DS et al. An improved MR imaging technique for the visualization of myocardial infarction. Radiology 2001; 218: 215-23. 9. Wu KC, Zerhouni EA, Judd RM et al. Prognostic significance of microvascular
obs-truction by magnetic resonance imaging in patients with acute myocardial infarc-tion. Circulation 1998; 97: 765-72.
10. Choi KM, Kim RJ, Gubernikoff G, Vargas JD, Parker M, Judd RM. Transmural ex-tent of acute myocardial infarction predicts long-term improvement in contractile function. Circulation 2001; 104: 1101-7.
11. Gerber BL, Garot J, Bluemke DA, Wu KC, Lima JA. Accuracy of contrast-enhanced magnetic resonance imaging in predicting improvement of regional myocardial func-tion in patients after acute myocardial infarcfunc-tion. Circulafunc-tion 2002; 106: 1083-9. 12. Kim RJ, Wu E, Rafael A et al. The use of contrast-enhanced magnetic resonance ima-ging to identify reversible myocardial dysfunction. N Engl J Med 2000; 343: 1445-53. 13. Klein C, Nekolla SG, Bengel FM et al. Assessment of myocardial viability with con-trast-enhanced magnetic resonance imaging: comparison with positron emission tomography. Circulation 2002; 105: 162-7.
14. Buser PT, Auffermann W, Holt WW et al. Noninvasive evaluation of global left ven-tricular function with use of cine nuclear magnetic resonance. J Am Coll Cardiol 1989; 13: 1294-300.
15. Lorenz CH, Walker ES, Morgan VL, Klein SS, Graham TP, Jr. Normal human right and left ventricular mass, systolic function, and gender differences by cine mag-netic resonance imaging. J Cardiovasc Magn Reson 1999; 1: 7-21.
16. Sakuma H, Fujita N, Foo TK et al. Evaluation of left ventricular volume and mass with breath-hold cine MR imaging. Radiology 1993; 188: 377-80.
17. Semelka RC, Tomei E, Wagner S et al. Interstudy reproducibility of dimensional and functional measurements between cine magnetic resonance studies in the morphologically abnormal left ventricle. Am Heart J 1990; 119: 1367-73. 18. Semelka RC, Tomei E, Wagner S et al. Normal left ventricular dimensions and
func-tion: interstudy reproducibility of measurements with cine MR imaging. Radiology 1990; 174: 763-8.
19. Carr JC, Simonetti O, Bundy J, Li D, Pereles S, Finn JP. Cine MR angiography of the heart with segmented true fast imaging with steady-state precession. Radiology 2001; 219: 828-34.
20. Haacke EM, Tkach JA. Fast MR imaging: techniques and clinical applications. AJR Am J Roentgenol 1990; 155: 951-64.
21. Lee VS, Resnick D, Bundy JM, Simonetti OP, Lee P, Weinreb JC. Cardiac function:
MR evaluation in one breath hold with real-time true fast imaging with steady-state precession. Radiology 2002; 222: 835-42.
22. Miller S, Simonetti OP, Carr J, Kramer U, Finn JP. MR Imaging of the heart with cine true fast imaging with steady-state precession: influence of spatial and temporal re-solutions on left ventricular functional parameters. Radiology 2002; 223: 263-9. 23. Rehwald WG, Kim RJ, Simonetti OP, Laub G, Judd RM. Theory of high-speed MR
imaging of the human heart with the selective line acquisition mode. Radiology 2001; 220: 540-7.
24. Bland JM, Altman DG. Statistical methods for assessing agreement between two methods of clinical measurement. Lancet 1986; 1: 307-10.
25. Lima JA, Judd RM, Bazille A, Schulman SP, Atalar E, Zerhouni EA. Regional hete-rogeneity of human myocardial infarcts demonstrated by contrast-enhanced MRI. Potential mechanisms. Circulation 1995; 92: 1117-25.
26. Fieno DS, Kim RJ, Chen EL, Lomasney JW, Klocke FJ, Judd RM. Contrast-enhan-ced magnetic resonance imaging of myocardium at risk: distinction between rever-sible and irreverrever-sible injury throughout infarct healing. J Am Coll Cardiol 2000; 36: 1985-91.
27. Ricciardi MJ, Wu E, Davidson CJ et al. Visualization of discrete microinfarction after percutaneous coronary intervention associated with mild creatine kinase-MB elevation. Circulation 2001; 103: 2780-3.
28. Diesbourg LD, Prato FS, Wisenberg G et al. Quantification of myocardial blood flow and extracellular volumes using a bolus injection of Gd-DTPA: kinetic modeling in canine ischemic disease. Magn Reson Med 1992; 23: 239-53.
29. Saeed M, Wendland MF, Masui T, Higgins CB. Reperfused myocardial infarctions on T1- and susceptibility-enhanced MRI: evidence for loss of compartmentaliza-tion of contrast media. Magn Reson Med 1994; 31: 31-9.
30. Schwitter J, Saeed M, Wendland MF et al. Influence of severity of myocardial in-jury on distribution of macromolecules: extravascular versus intravascular gado-linium-based magnetic resonance contrast agents. J Am Coll Cardiol 1997; 30: 1086-94.
31. Rehwald WG, Fieno DS, Chen EL, Kim RJ, Judd RM. Myocardial magnetic reso-nance imaging contrast agent concentrations after reversible and irreversible ische-mic injury. Circulation 2002; 105: 224-9.
32. Gibbons RJ, Miller TD, Christian TF. Infarct size measured by single photon emis-sion computed tomographic imaging with (99m)Tc-sestamibi: A measure of the ef-ficacy of therapy in acute myocardial infarction. Circulation 2000; 101: 101-8. 33. Kang X, Berman DS, Van Train KF et al. Clinical validation of automatic