A Work Project, presented as part of the requirements for the Award of a Masters Degree in Management from the Faculdade de Economia da
Universidade Nova de Lisboa
The impact of the measurement unit of unit price on consumer
preference and choice
João Carlos de Paiva Coelho Machado Silva Student number: 346
Work Project carried out for the Consumer Behavior Course, with the supervision of: Professor Els. De Wilde
Table of Contents
Abstract ... 3
Introduction ... 3
Literature Review ... 5
Overview of experiments ... 8
Experiment 1 Overview ... 8
Results ... 9
Discussion ... 11
Experiment 2 Overview ... 12
Results ... 12
Discussion ... 13
General Discussion ... 14
Practical implications ... 15
Limitations and future research ... 16
Conclusion... 17
References ... 19
Appendices: Appendix 1: Products’ information ... 22
Appendix 2: Experiments’ instructions ... 23
The impact of the measurement unit of unit price on consumer preference and choice.
Abstract
This project studies how variations in the measurement unit of unit price affect consumers’ preference and choice. Particularly, we contend that consumers’ relative preference for the same two option is different when options’ unit price is presented in a large measurement unit – per kg; than when options’ unit price is presented in a small measurement unit – per 100g. Moreover, consumers’ choice will shift more to lower unit price options when options’ unit price is presented in larger measurement unit – per kg. Two experiments confirmed our hypotheses. Implications and future research on the topic are discussed.
Keywords: unit price; nominal value; preference reversals; consumer behavior.
Introduction
“L’essentiel est invisible pour les yeux…” ("The essential is invisible to the eyes…") Saint-Exupéry, in Le Petit Prince
Supermarkets offer a vast world of products, and respectively thousands of different types of packages. In fact consumers have on average, per category, 10 options to choose from (Russo et al., 1975). With so many options and as product legislation for weight and volume standardization has been very limited (McGoldrick, 1985) consumers face a trade-off between price and size.
consumers’ accurate choice when facing size vs. price trade-offs, since it allows them to have information on products’ price per unit of measurement.
Although unit price is well documented in the literature since its implementation (late 60s), little attention has been given to the impact of unit price measures on consumers behaviour (Miyazaki et al., 2000). Mainly variations on the measurement unit used to calculate unit price were proposed to influence consumers’ choice (Monroe and LaPlaca, 1972; Miyazaki et al., 2000), but there is no field work done on this subject. The scope of this work project is to improve unit price research by answering two main questions: Will individuals’ relative preference for two options differ when options’unit price is presented in a large measurement unit basis (kg), to when it is presented in a small measurement unit basis (100g)? We claim that comparing two products’ unit price presented in a large basis creates a bigger nominal difference between options’ unit price, than when equivalent information is presented in a small basis. For example, consider the following situation: a consumer is undecided on two options (A and B) of cheese. In one scenario, products’ unit prices are presented in kg basis - option A costs 15€ per kg and option B cost 20€ per kg. In another scenario equivalent products’ unit prices are presented in 100g basis - option A costs 1,5€ per 100g and option B costs 2,0€ per 100g. From this example, we argue that preference for the options depends on the information setting faced, since consumers will feature bigger dissimilarity between the two options in the first setting, as nominal difference between options’ unit price is larger (5€) than in the second situation, where nominal difference between options’ unit price is smaller (0,50€); even though information is equivalent.
that consumers will not only differentiate the two options more when unit price is expressed in a bigger unit of measure, as their choice will also shift more towards the lower unit price option. Two experiments were designed to test our hypotheses.
Literature review on unit price and on use of nominal values in judgment is presented next. The design, results and discussion of two conducted experiments are then described. Finally, general discussion of the results, implications and future research are presented. We believe our project improve the past unit price literature limitations, supporting more evidence for unit price strategies.
Literature review
The unit price system was introduced in late 60’s in Massachusettss (Russo et al.1975), and turned to be a fundamental need for consumers’ accurate choice, since they are totally confused in identifying the best economic offer without unit price information (Capon and Kuhn, 1982). Moreover, consumers with an effective use of unit price can save about 70 US dollars (47€) per year (McCullough and Padberg, 1971), shifting their purchase pattern to bigger size products with lower per unit costs (Granger and Billson, 1972). Although unit price brings clear benefits to consumers, past research is not clear about its level of use; while some studies report good levels, others account for marginal levels (Isakson and Maurizi, 1973).
benchmark on 15 top North American supermarkets identified differences: in the place where unit price is posted; in the size of unit price information; in the color scheme used and in the measurement unit upon which unit price is calculated (Miyazaki et al., 2000). Literature well documents the effects that most of these variations in unit price presentation have on consumers’ purchase behaviour (Isakson and Maurizi, 1973; Monroe and LaPlaca, 1972; Russo et al., 1975; Russo, 1977), still low consideration was given to how the use of different measurement units to calculate unit price affect consumers.
Moreover, we argue that due to the inadequate use of nominal values in judgment by individuals, preference and choice will depend on the measurement unit used. One may notice in the literature that individuals incorrectly adjust nominal value to real value, even if they differentiate and acknowledge the two concepts (Shafir et al., 1997). Particularly, Shafir et al. (1997) indicated how individuals were more satisfied with a gross raise in salary of 5% within a scenario of 4% inflation, than with a 2% salary increase when there was no inflation. Furthermore, Raghubir and Srivastava (2002) also pointed out that individuals adjust money value to foreign currencies inadequately, overspending when the exchange rate is a fraction of home currency and underspending when the opposite happens (Raghubir and Srivastava, 2002). Likewise, bias has been evidenced when the Euro currency was introduced (Gamble, 2007).
heart attacks per country); although variations in the two presented values happen due to the use of different denominators. In what concerns the unit price system, the use of a small measurement unit, as 100 grams, creates smaller nominal values – e.g.: 1,5€ / 100g compared to the use of a higher measurement unit, as kg – e.g.: 15€ / kg. Thus we argue that, the higher is the unit price measure used, more evident are the differences between options’ unit price. Consequently, and as individuals wrongly adjust nominal value to real value, we come to our first hypothesis:
H1: Consumers will have different relative preference between two options when its unit price is expressed per a larger measurement unit (kg) than when it is expressed per a smaller measurement unit (100g).
In line with hypothesis 1, preference reversals are expected to happen, since according to the importance given to the attributes of the trade-off options, individuals will change their preferences (Mellers and Cooke, 1994 and Mellers and Cooke, 1996). Mainly we assume that consumers will give more importance to unit price in their choice decisions, when a high measurement unit is used (e.g.: unit cost per kg), since nominal differences between products’ unit price are increased. Given that when choosing between two similar alternatives, consumers often choose the option that is superior on the most significant attribute (Quattrone and Tversky, 1988) we come to our second hypothesis:
Overview of experiments
Two experiments were designed to test our hypotheses. Experiment 1 explores how variations on the measurement unit of unit price influences consumers’ preferences, testing H1. While, experiment 2 explores how the variations on the measurement unit of unit price affects consumers’ choice, testing H2.
Two groups per experiment were used. For experiment 1 and 2, the groups were faced with a scenario of 4 different product categories: Curd, Smoked Ham, Ham and Cereals. For each category participants had two options (A and B), for which information on 3 attributes (price, size and unit price) was given. All the non-described attributes were told to be equal, thus differentiation between other options’ attributes, like quality or brand name, wasn’t considered.
While the two attributes - price and size - of the options were equally presented to both groups, as experimental manipulation we communicated unit price information for one group in 100g basis and for the other group in kg basis - see app. A, tables 1 and 2. After analysing the attributes of the two options, participants were asked to rate their relative preference for the two options in experiment 1 and to choose one of the two options in experiment 2.
Products’ information used in experiments was collected from www.elcorteingles.pt online grocery store in October 2009.
Experiment 1 Overview
As explained the groups were exposed to the two different UP scenarios (group 1 – unit price per 100g and group 2 – unit price per kg). After considering products’ information, each participant was asked to rate its relative preference between the two options (A and B), for each one of the 4 categories, using an 11 point Likert Scale. (see app. B – instructions for experiment 1)
By using a rate scale, we intend to quantify participants’ relative preference between the two suggested options. This way, we consider that for group 2, as unit price nominal differences between the options are evident, relative preference for one of the options will be higher; for example, a participant from group 2 is expected to prefer Curd’s option A (lower unit price option) by 3 points. In other hand, as for group 1 options’ unit price look more similar, a participant from this group is expected to have a lower relative preference for one of the two options; for example would prefer Curd’s option A by 1 point.
Results
We conducted a t-test (for unequal sample sizes, equal variance) for each product category. The main effect of unit price in consumers’ preference was significant for: Curd (t = 2,92, p<.05); Smoked Ham (t = -3,04, p<.05); Ham, (t = -3,50, p<.05) and Cereals (t = 3,77 0,00035, p<.05).
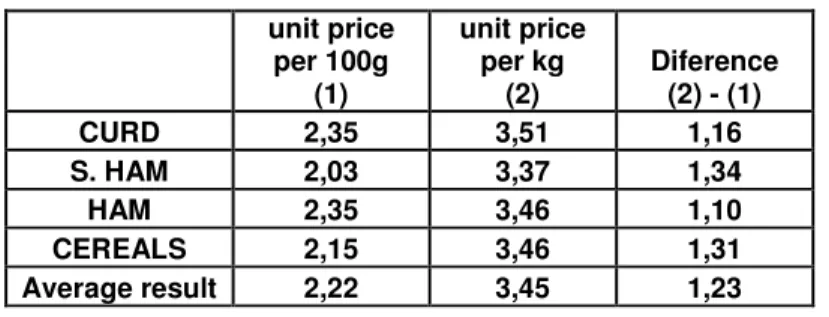
In order to quantify the difference in relative preference between groups, we conducted a mean of the absolute ratings value, for each product category. This way, we can identify the group that used higher absolute rates to evaluate the options, evidencing stronger relative preference.
with 3,51 scale points while group 1 rated Curd’s options with 2,35 scale points, representing a difference of 1,16 scale points. Comparable patterns emerged for all 4 categories. In average group 2 relative preference for the options is rated with more 1,23 scale points than group 1 relative preference - See table 3
Table 3: Average relative preference for the options unit price per 100g (1) unit price per kg (2) Diference (2) - (1)
CURD 2,35 3,51 1,16
S. HAM 2,03 3,37 1,34
HAM 2,35 3,46 1,10
CEREALS 2,15 3,46 1,31
Average result 2,22 3,45 1,23
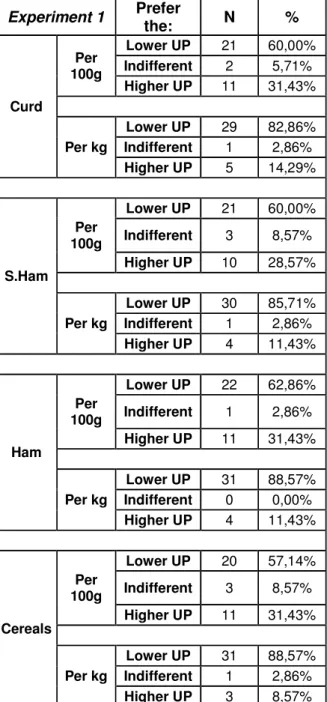
Also from the results, preference reversals were identified with significant effect of unit price attribute, as chi-square test evidence for Curd ( 2(2) = 3,85, p<0,05); for Smoked Ham ( 2(2) = 5,15, p<0,05); for Ham ( 2(2) = 5,78, p<0,05); and for Cereals ( 2(2) = 7,93, p<0,05). Specifically, participants of group 1 state to prefer, on average, the lower unit price option 60% of the times; whereas, participants from group 2 state to prefer, on average, the lower unit price option 86,43% of the times. Moreover, participants from group 1 are indifferent between options 6,43% of the times; while, participants from group 2 were indifferent between options 2,14% of the times – see table 4.
Table 4: Total preferences for the options
N %
Per 100g
Prefer lower unit price
option 21 60,00%
Indifferent 2,25 6,43%
Prefer higher unit price
option 10,75 30,71%
Per kg
Prefer lower unit price
option 30,25 86,43%
Indifferent 0,75 2,14%
Prefer higher unit price
Discussion
Experiment 1 indicated how the use of different measurement units to calculate unit price lead to variations in consumers’ preference, confirming H1. As past literature on the use of nominal values in judgments pointed out (Shafir et al.,1997; Raghubir and Srivastava, 2002; Raghubir, 2008), individuals incorrectly adapt nominal values to real values. We assert that, participants base their preferences focusing on unit price nominal value without adapting to the measurement unit used, and so misreading real values. In fact, the nominal difference between options’ unit price is enormously different when unit price is calculated in a grams basis than when in a kg basis. As example the nominal difference between Curd options’ unit price is of 0,16€ in a 100grams basis and of 1,6€, ten times bigger, in a kg basis.
As participants take the unit price to compare options, the attributes between the two options gain different weights in group 1 and in group 2. In line with preference reversals research (Mellers and Cooke, 1994 and Mellers and Cooke, 1996), this variation in attributes’ weights makes consumers’ preference to vary. In practice, group 2 participants based their preference more on unit price, since its nominal value was more evident. This explains why participants from group 2 preference was 26,43% of the times more on the lower unit price option than participants from group 1 preference. Additionally, respondents from group 1 indicated higher levels of indifference between the two options than respondents from group 2, illustrating that as unit price attribute has lower relevance for group 1 (unit price per 100g) participants are less confident in one of the two options’ superiority.
can distinguish the best unit price option and state to prefer it, but we are not sure that choice wouldn’t be based on other attributes, as size or price.
Experiment 2 Overview
34 and 28 students were randomly assigned to the two unit price conditions and were asked to answer an online questionnaire (group 1 – unit price per 100g and group 2 – unit price per kg).
From the online questionnaires sent: 22 (64,7%) for the unit price per 100g condition and 20 (71,4)% for the unit price per kg condition were answered. All the respondents were master students, participated on a voluntary basis and didn’t take part in experiment 1.
The two groups were faced with the same two UP scenarios of the previous experiment (app. A table 1 and 2), but in this experiment, after considering products’ information, participants were asked to choose one of two options for each product category. In practice, participants from group 2 (unit price per kg) are expected to attend more to the lower unit price option than respondents from group 1 (unit price per 100grams).
Results
As expected, for all product categories, preference reversals were identified with significant effect of unit price, as chi-square results evidence for Curd ( 2(1) = 4,11, p<0,05), for Smoked Ham ( 2(1) = 4,55, p<0,05), for Ham ( 2(1) = 5,18, p<0,05), and for Cereals ( 2(1) = 4,89, p<0,05).
group 2 participants, in average, have chose the lower unit price option more 29,55% of the times than group 1 – see table 5.
Table 5: Percentage of group participants that chose the lower unit price option.
Difference (2)-(1) unit price
per 100g (1)
unit price per kg
(2)
CURD 50,00% 80,00% 30,00%
S. HAM 54,55% 85,00% 30,45%
HAM 59,09% 90,00% 30,91%
CEREALS 68,18% 95,00% 26,82%
Average result 57,96% 87,50% 29,55%
Considering the results, it is also interesting to check how the percentage of individuals within the same group that chose the lower unit price option increases continually from the first to the last question. Taking group 1 as example, for the first product category – Curd - 50% of the participants chose the lower unit price option, then for Smoked Ham – 54,55% chose the lower unit price option; followed by 59,09% for Ham and finally 68,18% for Cereals.
Discussion
response formats is not clear (Tversky et al., 1988), and we provide evidence both in a judgment format (experiment 1) as in a choice format (experiment 2).
To understand, why the percentage of individuals, in the same group, that chose the lower unit price option increased continually from the first to the last question, it is important to mention that besides unit price displays formats, low educational level (Isakon and Maurizi, 1973), and low unit price awareness (Miyazaki et al., 2000; Russo et al., 1975) were pointed as limitations for its effective use. We believe that as far as educational level is concerned, all respondents are economics masters’ students and have the education in order to use unit price effectively. Additionally, one may state that results have been partially due to differential willingness to pay for the 4 categories used. Although, literature on the topic indicates that consumers’ price sensitivity is linked across product categories (Hoch et al., 1995), being more a reflex of psychological and demographic characteristics than of categories by itself (Kim et al., 1999). Accordingly, we believe that our participants (master students) aren’t regular shoppers of these kinds of products, and thus their habit to look for the lower unit price option seems to only emerge along the questionnaire.
General Discussion
with a higher measurement unit (per kg), unit price attribute turns to be the most important attribute to respondents’ judgment, given that dissimilarity between options’ unit price is more evident. In practice, the measurement unit of unit price can accentuates or diminish options’ price differences, and consequently induce consumers to have a strong or weak relative preference for the lower unit price option.
In addition, results obtained were in line with preference reversals research on trade-off options (Mellers and Cooke, 1994; Mellers and Cooke, 1996): since alterations in unit price attribute lead to variations in consumers’ choice. Choice has observed to shift more towards the lower unit price option when, due to the use of kg as measurement unit, difference between options’ unit price were accentuated. Moreover, preference reversals were found in the 1st (judgment response format) and 2nd (choice response format) experiment, despite literature is inconclusive on response format influence on preference reversals (Tversky, Sattah, & Slovic, 1988).
Together, the experiments verified the importance of measurement unit of unit price in influencing consumers’ preference and choice.
Pratical implications
As identified in the literature (Miyazaki et al., 2000), unit price is presented with different measurement units from store to store. As our findings evidence these variations have a direct effect on consumers’ preference and choice, since equivalent unit price information gains different psychological value as expressed in a 100g basis or in a kg basis.
the use of price tags stressing a product’s unit price benefit in comparison to other options. This, logistically, can be easily put into practice by retailers, emphasizing their store brand’s economic benefit compared to branded products.
Moreover, consumers’ knowledge of unit price system is crucial for its effective use (Miyazaki et. al, 2000; Russo et al., 1975); thus, besides highlighting nominal differences between options, brands should also improve unit price awareness. A claim like “Don’t take size as a reference, take unit price! Our brand is cheaper” could be used in marketing campaigns, turning unit price even more salient to consumers.
Besides unit price, this work project puts in evidence that all numerical information based on measurement units shouldn’t be made carelessly. As example, suppose how comparing goods’ nutritional information communicated per 100grams or comparing equivalent nutritional information per kg can affect consumers’ decision on which option to buy.
Limitations and future research
more and/or different attributes than the one used in this project. In addition, to understand further generalization of the effect, situations with more than two choice alternatives should be tested; and as well, situations where the products’ unit price is calculated with other measurement units, e.g.: unit of volume - price per 100 milliliters or price per liter.
A final consideration, concerns the importance of online stores in nowadays. Major retailers like continente online or el cortes ingles are posting unit price in all available products in their online stores. Hence, it’s crucial to understand how communicating unit price in categories that have never exhibited this attribute – e.g.: after-shaves, perfumes, or shampoos – will affect consumers’ decision. Specifically, it’s important to realize the more suitable, measurement unit and respective size (e.g.: milliliters; deciliters, liters, etc.) for each product category.
Conclusion
units have a direct effect on preference and choice. Moreover, preference reversals were found both in a judgment format as in a choice format.
References
Billings, R. S. and Scherer, L. L. (1988), “The effects of response mode and importance on decision making strategies – judgment versus choice”, Organization behaviour and human decision processes, 41(1): 1-19.
Capon, N. and Kuhn, D. (1982), “Can consumers calculate best buys?” Journal of Consumer Research, 8(4): 449-453.
Gamble, A. (2007), “The “Euro Illusion”: Illusion or Fact?” Journal of Consumer Policy, 30(4): 323-336.
Granger, C. W. J. and Billson, A. (1972), “Consumers' Attitudes Toward Package Size and Price”, Journal of Marketing Research, 9(3): 239-248.
Hoch, S. J.; Kim, B. D.; Montgomery, A. L. and Rossi, P. E. (1995), "Determinants of Store-Level Price Elasticity", Journal of Marketing Research, 32(1): 17-29.
Isakson, H. R. and Maurizi, A. R. (1973), “The consumer economics of unit pricing”, Journal of Marketing Research, 10(3): 277-285.
Kim B-D.; Spinivasan K. and Wilcox R. T. (1999), “Identifying Price Sensitive Consumers: The Relative Merits of Demographic vs. Purchase Pattern Information”, Journal of Retailing, 75(2): 173-193.
McGoldrick, P. J. (1985), “Price-size Relationships and Customer Reactions to a Limited Unit-pricing Programme”, European Journal of Marketing, 19(1): 47-64.
Mellers, B. A. and Cooke, A. D. J. (1994), “Tradeoffs depend on attribute range” Journal of Experimental Psychology: Human Perception and Performance, 20(5): 1055-1067.
Mellers, B. A., and Cooke, A. D. J. (1996), “The role of task and context in preference measurement”, Psychological Science, 7(2): 76-82.
Miyazaki, A. D.; Sprott, D. E. and Manning, K. C. (2000), “Unit Price on Retail Shelf Labels: An assessment of information prominence”, Journal of Retailing, Volume, 76(1): 93-112.
Monroe, K. B. and LaPlaca, P. J. (1972), “What Are the Benefits of Unit Pricing?" Journal of marketing, 36 (3): 16-22.
Quattrone, G. A. and Tversky, A. (1988), “Contrasting Rational and Psychological
Analyses of Political Choice”, The American Political Science Review, 82(3): 719-736.
Raghubir P. (2008), “Is 1/10 N 10/100? The effect of denominator salience on
perceptions of base rates of health risk”, International Journal of Research in
Marketing, 25(4): 327–334.
Russo, J. E.; Krieser, G. and Miyashita S. (1975), “An Effective Display of Unit Price Information”, Journal of Marketing, 39: 11-19.
Russo J. E (1977), “The Value of Unit Price Information”, Journal of Marketing Research, 14(2): 193-201
Shafir, E.; Diamond P. and Tversky A. (1997), "Money Illusion" Quarterly Journal of Economics, 112(2): 341-374.
Appendix 1: Products’ information
Table 1: products’ information – unit price per 100g – displayed to group 1 from experiment 1 and group 1 from experiment 2.
Question 1 - Curd Option A Price: 1,53€ Size: 260g
Unit Price: 0,59€/100g
Option B Price: 1,49 Size: 200g
Unit Price: 0,75€/100g Question 2 - Smoked
ham
Option A Price: 3,95€ Size: 200g
Unit Price: 1,98€/100g
Option B Price: 4,95€ Size: 300g
Unit Price: 1,65€/100g Question 3 – Ham Option A
Price: 2,29€ Size: 100g
Unit Price: 2,29€/100g
Option B Price:2,89€ Size: 150g
Unit Price: 1,93€/100g Question 4 – Cereals Option A
Price: 3,45€ Size: 375g
Unit Price: 0,92€/100g
Option B Price:2,85€ Size: 250g
Unit Price: 1,14€/100g Table 2: products’ information – unit price per kg – displayed to group 2 from experiment 1 and group 2 from experiment 2.
Question 1 – Curd Option A Price: 1,53€ Size: 260g
Unit Price: 5,9€/kg
Option B Price: 1,49€ Size: 200g
Unit Price: 7,50€/kg Question 2 - Smoked
ham
Option A Price: 3,95€ Size: 200g
Unit Price: 19,80€/kg
Option B Price: 4,95€ Size: 300g
Unit Price: 16,50/kg Question 3 – Ham Option A
Price: 2,29€ Size: 100g
Unit Price: 22,90€/kg
Option B Price:2,89€ Size: 150g
Unit Price: 19,30€/kg Question 4 – Cereals Option A
Price: 3,45€ Size: 375g
Unit Price: 9,2€/kg
Option B Price:2,85€ Size: 250g
Appendix 2: Experiments’ instructions
Instructions for Experiment 1:
The following questionnaire is intended to represent a real purchase scenario. Four categories are presented: Curd; Smoked ham; Ham; Cereals. For each category there are 2 options (A and B), the attributes of those options vary on price, size and unit price.
Please consider that all non referenced attributes are equal for the two options within the same category.
You’re asked to indicate your relative preference on the two options using a scale from -5 (you definitely prefer A) to -5 (you definitely prefer B).
Example:
Question X - MEAT
Option A Price: A Size: B Unit Price: C
Option B Price: D Size: E Unit Price: F
This questionnaire is anonymous. Thank you for your participation.
Definitely prefer
A
Indifferent
A or B
Definitely prefer
B
Instructions for Experiment 2:
The following questionnaire is intended to represent a real purchase scenario. Four categories are presented: Curd; Smoked ham; Ham; Cereals. For each category there are 2 options (A and B), the attributes of those options vary on price, size and unit price.
Please consider that all non referenced attributes are equal for the two options within the same category.
You’re asked to chose one of the options:
Example:
Question X - MEAT
Option A Price: A Size: B Unit Price: C
Option B Price: D Size: E Unit Price: F
Option A X
Option B
Appendix 3: Experiments’ results
Table 6: Experiment 1 results. Table 7: Experiments 2 results.
Experiment 1 Prefer
the: N % Experiment 2 Chose: N %
Curd
Per 100g
Lower UP 21 60,00%
Curd
Per 100g
Lower UP 11 50,00%
Indifferent 2 5,71% Higher UP 11 50,00%
Higher UP 11 31,43%
Per kg Lower UP 16 80,00%
Per kg
Lower UP 29 82,86% Higher UP 4 20,00%
Indifferent 1 2,86%
Higher UP 5 14,29%
S.Ham Per 100g
Lower UP 12 54,55%
Higher UP 10 45,45%
S.Ham
Lower UP 21 60,00%
Per
100g Indifferent 3 8,57% Per kg Lower UP 17 85,00%
Higher UP 10 28,57% Higher UP 3 15,00%
Lower UP 30 85,71%
Ham
Per 100g
Lower UP 13 59,09%
Per kg Indifferent 1 2,86% Higher UP 9 40,91%
Higher UP 4 11,43%
Per kg Lower UP 18 90,00%
Ham
Lower UP 22 62,86% Higher UP 2 10,00%
Per
100g Indifferent 1 2,86%
Higher UP 11 31,43%
Cereals Per 100g
Lower UP 15 68,18%
Higher UP 7 31,82%
Lower UP 31 88,57%
Per kg Indifferent 0 0,00%
Per kg Lower UP 19 95,00%
Higher UP 4 11,43% Higher UP 1 5,00%
Cereals
Lower UP 20 57,14%
Per
100g Indifferent 3 8,57% Higher UP 11 31,43%
Lower UP 31 88,57%
Per kg Indifferent 1 2,86%