Estimate of genetic parameters for carcass traits and visual scores in
meat sheep using Bayesian inference via threshold and linear models
Estimativa de parâmetros genéticos para características de carcaça e escore corporal em ovinos de corte usando Inferência Bayesiana e modelos de limiar e linear
Luiz Antonio Silva Figueiredo Filho1 José Lindenberg Rocha Sarmento2 Alan Oliveira do Ó2 Natanael Pereira da Silva Santos3 Luciano Silva Sena2 Antonio de Sousa Júnior2
ISSNe 1678-4596
INTRODUCTION
Accurate estimates of the variance components of economically important traits are important in animal production because the differences between real and estimated values cause increase in the random-effect prediction error. Genetic parameters obtained from these estimates are used in planning animal breeding programs. However, choosing an appropriate statistical method to obtain these estimates, with variance components that better
reflect the biological behavior of the study traits, is
essential (FARIA et al., 2007).
Both progress in the computational
field and development of new theories applied to
genetic component estimation methods increased the possibility of choosing among different procedures to estimate (co)variance components, especially of traits that indicated animal nutritional status. Body condition score (PIMENTEL et al., 2005) and intramuscular fat or marbling, which is responsible for succulence
and flavor of sheep meat (SUGUISAWA et al., 2009)
are examples of such traits since they are discrete distribution traits.
Threshold model method is based on the hypothesis that the observable data classes are related to the design of an underlying continuous normal variable (SANTOS et al., 2012). Thus, application of the Bayesian threshold models with view to data categorical nature may provide higher genetic gains when animals with 1Instituto Federal de Educação, Ciência e Tecnologia do Maranhão (IFMA), 65635-468, Timon, MA, Brasil. E-mail: [email protected].
Corresponding author.
2Universidade Federal do Piauí (UFPI), Teresina, PI, Brasil. 3Universidade Federal do Piauí (UFPI), Bom Jesus, PI, Brasil.
ABSTRACT: The aim of this study was to estimate the variance components and genetic parameters for marbling in the ribeye area (MRA) and body condition score (BCS) using Bayesian inference via mixed linear and threshold animal models. Data were obtained from Santa Ines breed sheep reared in the Brazilian Mid-North region. Analyses considering the Monte Carlo methods were performed with Markov chains from 500000 cycles onward. A 200000-cycle initial burn-in was considered with values taken at every 250 cycles, in a total of 1200 samples. The Monte Carlo Error deviations were low for the means heritability in all chains by both linear and threshold models. Additive variances estimated by threshold model were higher than those estimated by the linear model. Marble meat from the ribeye area and body condition score can be used as selection criteria to obtain genetic progress in Santa Inês sheep.
Key words: Gibbs sampling, categorical data, marble meat, ultrasound.
RESUMO: O objetivo deste estudo foi estimar componentes de variância e parâmetros genéticos para marmoreio na área de olho de lombo (MOL) e escore de condição corporal (ECC) usando Inferência Bayesiana por meio dos modelos animais linear misto e de limiar. Os dados foram obtidos em rebanhos de ovinos da raça Santa Inês criados no Meio-Norte do Brasil. As análises, considerando os métodos de Monte Carlo, foram realizadas com cadeias de Markov a partir de 500000 ciclos. Considerou-se burn-in inicial de 200000 ciclos com valores tomados a cada 250 ciclos, obtendo-se 1200 amostras. Os desvios do erro de Monte Carlo foram baixos para as herdabilidades médias em todas as cadeias, tanto pelo modelo linear quanto de limiar. As variâncias aditivas, estimadas pelo modelo de limiar, foram maiores que aquelas obtidas pelo modelo linear. O marmoreio na área de olho de lombo e o escore da condição corporal podem ser usados como critérios de seleção para obter progresso genético em ovinos da raça Santa Inês.
Palavras-chave: amostragem de Gibbs, dados categóricos, gordura de marmoreio, ultrassonografia.
higher genetic value are identified with a higher efficiency
(SANTOS et al., 2013; FERNANDES et al., 2014). Therefore, the aim of this study was to compare the estimates of the variance components and genetic parameters for traits of body condition score and marbling in the ribeye area using the threshold and linear animal models in Santa Inês breed sheep matrices reared in Mid-North region of Brazil. Such estimates are important in the selection of animals genetically higher for the traits studied.
MATERIALS AND METHODS
This study was conducted with information collected from adult female Santa Inês sheep (426), children of sire (76), and matrices (99) registered with the Brazilian Association of Sheep Breeders (ARCO, for Associação Brasileira de Criadores de
Ovinos), reared in the States of Piauí and Maranhão. Data were collected in the period Jan-Dec 2012.
Information was registered about the body condition score (BCS) obtained by visual assessment and palpation of the lumbar region, between the spinous and transverse processes. The assigned rating (1-5 scale) was based on the perception of muscle and fat deposition in the examined areas, in which body
condition five indicates excessive fat deposition in the
animal (MACHADO et al., 2008).
Information about marbling in the ribeye area (MRA) was also registered without slaughtering
the animals. Ultrasound images of the longitudinal cut
of the Longissimus dorsimuscle were measured taking the intercostal space between the 12th and 13th lumbar
vertebrae as anatomical reference. Measurements were performed using an ultrasound device (KX2000G VET; Chison; China) equipped with a 3.5MHz linear transducer. The ultrasound images were interpreted assigning rates (0-6 scale), which indicated from absence (0) to abundance (6) of intramuscular fat.
Statistical analyses of data consistence were performed using the SAS (Statistical Analysis System, v. 9.0. 2002) software. The MIXED procedure was used
in the analyses to identify the influence of fixes effects of
the collection month, farm, year of birth of the animal, type of kidding (simple, double, or triple), and age class of the animal (AG) at the moment of collection (AG=1: until two years old; AG=2: over two and under or equal
to four years old, and AG=3: over four years old). A file was generated containing identification of the animal, its
father and mother, contemporary groups, and the body condition and marbling in ribeye area scores, and only animals with known genealogical information remained, in a total of 426 animals.
The (co) variance components and genetic parameters were estimated using the linear mixed and threshold animal models, one-character Bayesian analysis, and applications for the linear (GIBBS1F90) and threshold (THRGIBBS1F90) models (MISZTAL et al., 2002). Animal Model, matrix notation, was: Y=Xb+Za+e
where: y is the observation vector for the trait measured in the animal; b is the “fixed” effect vector for the contemporary group; a is the effect vector for the direct additive genetic values in each animal; e is the residual random error vector; and x and z are the incidence matrices that relate the
observations to the fixed and direct additive random
effects, respectively. To clarify, b is considered a random-effect vector (Bayesian point of view). b is assumed a priori to be non-uninformative and thus: P (b) a constant.
In this animal model, and using the Bayesian approach, it is usually assumed that
sa2~N(0.A s a
2 ) and s e
2~N(0.R s e
2 ), where s a
2 and se2 are direct additive and residual genetic variance
components, respectively; A is the numerator matrix
of the Wrigth kinship coefficient, and R is the variance matrix of the residual vector.
In the threshold model, it was assumed that the underlying (Liability) scalehas a normal continuous distribution, being represented as: |q~N(Wq,Ise2), where is U the base scale vector
of order r; q=(b.a) is the location parameter vector of order s with b (defined as fixed effects from the frequency point of view), and order s with a (as random direct additive genetic effects); W is the known incidence matrix of order r x s; I is the identity matrix of order r x r and se2 is the
residual variance.
Since the categorical traits are determined by unobservable continuous variables in an underlying
scale, initial value were fixed for thresholds t, (tmin, t1,…,tj-1, tmax), t1 <t2…<tj-1, which divide the line of the contingency table into j response intervals, with e , where j is the number of categories (thresholds). Thus, the observable data depend on the underlying variable, which is limited by two unobservable thresholds. In order to understand the joint probability density function of the parameters, given the hyperparameters, it is necessary to know the observed values y distribution, which is conditioned by the continuous and threshold observations.
The y categories (body condition score and
marble meat from the ribeye area traits; defined by
1-5 and 1-6 scales, respectively) for each animal i
where, n is the number of observations for each category. After the t0 to t4 (BCS) and t0 to t5 (MRA)
thresholds were specified, one of the thresholds (t0 to t5 and t0 to t6) was adjusted to an arbitrary constant. In this case, it was assumed that t1=1 so that the vector
of estimable thresholds was defined as:
for BCS and for MRA.
Since the observations are conditionally
independent, the likelihood function is defined by
the product of contributions of each record. Thus, the conditional probability that yi falls into category j (j=1 to 5) or (j=1 to 6) for BCS and MRA, respectively, given the vectors b, a, and t, is presented as: Pr (yi=j| b, a, t)=Pr (tj-i<Ui<tj|b, a, t)=f (tj-X’i b-Z’i a)-f (tj-1-X’i b-Z’i a)=p (yi|b, a, t), where yi is the variable response to observation i taking values 1. 2. 3. 4. 5. or 6 if the
observation belongs to the first, second, third, fourth, fifth, or sixth category, respectively; t is the threshold
value for which an arbitrary value will be fixed since
it is not estimable; Ui is the subjacent variable value for the mentioned observation; f is the cumulative distribution function of a standard-normal variable (indicator of a function with value 1 if the expression is evaluated as true and 0in the opposite case).
In this study, the degree of freedom
corresponding to the inverse Wishart distribution, which
indicates the level of reliability of the initial distribution (v), was flat for all initial variances, i.e., it did not reflect the degree of knowledge about the parameters (v=0).
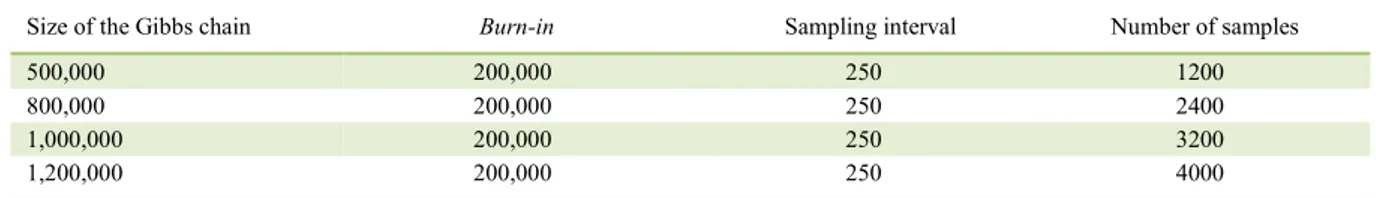
Analyses were carried out with initial chains of 500,000, 800,000,1,000,000, and 1,200,000 cycles:
the firsts 200,000 (burn-in) cycles were discarded and the samples were taken apart at each 250 cycles, in a total of 1200. 2400. 3200. and 4000 samples, respectively, for each initial chain (Table 1). Thus, the comparison between these chains was one of the criteria used to analyze their convergence (CARDOSO, 2008).
The burn-in dimension and the sample
interval for each chain size were defined through
preliminary analyses, with which the sample convergence and distribution were evaluated using the POSTGIBBSF90 program (MISZTAL et al., 2002),
which allows graphic analyses and uses the GEWEKE
diagnostic test (1992). In addition, the GIBANAL
(VAN KAAM, 1997) program, which applies the
RAFTERY & LEWIS (1992) method to monitor the
convergence, was also used.
The Monte Carlo error was obtained by calculation of variance of samples taken apart for each component and divided by the number of samples. Thus, the root square of this value is related to the approximation of the standard deviation to the error associated with the size of Gibbs chain.
RESULTS AND DISCUSSION
The convergence diagnosis by the RAFTERY
& LEWIS (1992) method suggested burn-in as well as sampling interval less than 4000 and 175 iterations for all parameters, respectively. However, higher values of burn-in and samplburn-ing burn-interval were used (Table 1) to avoid serial correlation problems, i.e., to avoid samples with the presence of autocorrection among the values. Serial correlation indicated the degree of information provided by each sample to the a posteriori means, such effect is less correlated when measurements are more spaced. Thus, the samples are expected to show the lowest correlation possible (MARCONDES et al., 2011).
A 5% convergence to the parameters was
observed in both models by the GEWEKE (1992) diagnosis. Therefore, the number of specified iterations
was appropriate and the a posteriori sample values
significantly represented valid estimates of the parameter
a posteriori distribution.
Another indication that the analyses reached convergence is given by the Monte Carlo error (MCE), since the values for the heritability means were low, by both the linear and the threshold model (Table 2). According to VAN TASSELL & VAN VLECK (1996), this occurs when the error value added to the mean estimate of the a posteriori
distribution of the heritability coefficient does not
change the estimate value.
Results ensured that the Gibbs chain achieved convergence and the Gibbs sampling was appropriate to generate a posteriori means of the marginal distributions of variance components. It is noteworthy that this measure is considered small when its value, added to the mean estimate of a posteriori
distribution of the heritability coefficients, does not
change the estimated value up to the second decimal place (VAN TASSELL & VAN VLECK, 1996).
The a posteriori distribution means of the variance components obtained using the threshold model were higher than those obtained by the linear model (Table 3). Thus, the categorical data analysis assuming normal distribution may produce inappropriate results. This means that inferences on the estimates may be wrong or underestimated (SANTOS et al., 2013). However, the fact that the heritability values for the analyzed traits thus obtained were close to each other in both models, which required a caveat.
Since the iteration number was high enough and the likelihood function overcame the a priori information, which began to have little importance in the interferences, the a posteriori distribution may become less symmetrical if the lack of information is assumed (Table 3). However, as the sample size increases, the a posteriori distribution becomes more symmetrical
and the influence of the a priori information decreases
(SANTOS et al., 2013). In addition, it is emphasized that symmetry is not required to ensure convergence,
since inverse Wishart distribution of the subsequent
marginal densities of (co)variance components is expected (VAN TASSELL & VAN VLECK, 1996).
The mean estimates of the random direct additive genetic and residual variance components obtained by both models were within the amplitude of the credibility interval for the traits (Table 3). Although the mean values are within the credibility intervals, it was noted that the median and mode did not behave in the same direction when the linear model is used, being outside this interval.
Results allowed us to conclude that the threshold model would be the most appropriate to estimate the genetic parameters for these traits, since they do not have normal distribution. Therefore, the mean, median, and mode are not equal. Estimates of the variance components showed to be considerably
Table 1 - Number of samples of the a posteriori distribution as a function of the chain size, burn-in values, and sampling interval.
Size of the Gibbs chain Burn-in Sampling interval Number of samples
500,000 200,000 250 1200
800,000 200,000 250 2400
1,000,000 200,000 250 3200
1,200,000 200,000 250 4000
Table 2 - Aposteriori means of the variance components and heritability for the traits of body condition score (BCS) and marbling from the ribeye area (MRA) in Santa Inês breed sheep obtained by using the linear and threshold models.
Models Traits Gibbs chains ---Variance components--- ℎ2 MCE
𝜎𝜎𝑎𝑎2 𝜎𝜎𝑒𝑒2 𝜎𝜎𝑝𝑝2
Linear
BCS
500,000 1.75 0.87 2.62 0.67 0.0080
800,000 1.58 0.79 2.37 0.67 0.0056
1,000,000 1.67 0.82 2.49 0.67 0.0049
1,200,000 1.66 0.81 2.48 0.67 0.0043
MRA
500,000 2.37 1.19 3.56 0.66 0.0080
800,000 2.17 1.09 3.26 0.66 0.0056
1,000,000 2.28 1.14 3.42 0.67 0.0049
1,200,000 2.28 1.13 3.40 0.67 0.0043
Threshold
BCS
500,000 142.48 61.07 203.55 0.70 0.0066
800,000 162.18 73.40 235.58 0.69 0.0048
1,000,000 183.90 85.06 268.96 0.68 0.0042
1,200,000 190.62 88.19 278.81 0.68 0.0038
MRA
500,000 158.68 71.64 230.32 0.68 0.0062
800,000 162.71 82.84 245.55 0.66 0.0046
1,000,000 164.06 83.82 247.88 0.66 0.0039
1,200,000 160.15 82.13 242.28 0.66 0.0035
different when the threshold and linear models were compared, since the credibility regions did not overlap. This characterizes the rejection of the statistical hypothesis of equality between the estimates generated by both models (FARIA et al., 2008).
The heritability estimated by the linear and threshold models for both (BCS and MRA) traits were high (Table 3). These results indicate that satisfactory genetic gains can be obtained when animals with these traits are selected. Moreover, it can be inferred that a high correlation exists between genotype and phenotype. Therefore, the phenotype may be a good indicator of the animal genotype.
The variance components were very different, although heritability of the traits obtained by the threshold and linear models behaved in a similar manner (Table 3). In other words, it is likely that the genetic gains would be very different due to the differences between the estimated variance
magnitudes although heritability indicated efficiency
in the response to selection by both models. This difference can be observed when a 60% increase was obtained in the additive variances estimated for the traits. Therefore, it can be concluded that the
threshold model best fitted to the genetic parameter
estimated for these traits.
The threshold model is more appropriate than the linear one to estimate genetic parameters of categorical data, because it takes into account the data
distribution. FARIA et al. (2008) studied morphological traits in beef cattle and stated that both models showed similar results in the estimation of genetic parameters because they had higher score values.
CONCLUSION
The threshold model showed to be appropriate to study the body condition score and marbling in the ribeye area in Santa Inês breed sheep. Marbling in the ribeye area and the body condition score traits can be used as selection criteria to obtain genetic progress in Santa Inês breed sheep.
BIOETHICS AND BIOSSECURITY COMMITTEE APPROVAL
The authors declare that the original project was not
submitted to approval by the Ethics Committee of the Universidade Federal do Piauí. However, they are aware of the content of the
resolution by the National Council for the Control of Animal Experimentation (CONCEA; <http://www.mct.gov.br/index.php/ content/view/310553.html>) about studies involving animals. Therefore, the authors take full responsibility for the data presented above and are available to answer any questions, if they are required by the regulatory authorities.
ACKNOWLEDGEMENTS
Thanks to the Universidade Federal do Piauí for the
support during the development of the research.
Table 3 - Aposteriori estimates of the variance components and genetic parameters for the traits of body condition score (BCS) and marbling in the ribeye area (MRA) in Santa Inês breed sheep, obtained using the linear and threshold models, generated with 500.000 cycle chains.
Models Traits Variance components Means Medians Modes ---CI-95%--- ℎ2
LCL UCL
Linear
BCS
𝜎𝜎𝑎𝑎2 1.75 1.15 1.46 1.63 1.86
0.6
𝜎𝜎𝑒𝑒2 0.87 0.56 1.01 0.80 0.93
𝜎𝜎𝑝𝑝2 2.62 1.86 0.63 2.47 6.64
𝜎𝜎𝑎𝑎2 2.37 1.55 1.45 2.21 2.53
0.6
MRA 𝜎𝜎𝑒𝑒2 1.19 0.77 1.18 1.10 1.27
𝜎𝜎𝑝𝑝2 3.56 2.46 1.59 3.36 3.75
Threshold BCS
𝜎𝜎𝑎𝑎2 142.48 106.95 138.20 102.25 149.71
0.7
𝜎𝜎𝑒𝑒2 61.06 42.50 23.94 20.96 69.17
𝜎𝜎𝑝𝑝2 203.55 161.38 287.00 145.49 211.61
MRA
𝜎𝜎𝑎𝑎2 158.68 112.50 126.90 109.65 167.71
0.6
𝜎𝜎𝑒𝑒2 71.63 51.82 31.16 38.16 75.10
𝜎𝜎𝑝𝑝2 230.32 176.32 110.42 190.24 240.40
CI-0.95 = Credibility Interval for 0.95 probability; LCL = Lower credibility limit; UCL = Upper credibility limit; 𝜎𝜎𝑎𝑎2 = direct additive
variance;𝜎𝜎𝑒𝑒2 = residual variance; 𝜎𝜎
REFERENCES
CARDOSO, F. F. Manual de utilização do programa INTERGEN: versão 1.0 em estudos de genética quantitativa animal. Bagé: Embrapa Pecuária Sul, 2008.74 p.
FARIA, C. U. et al. Bayesian Inference and its application in the genetic evaluation of the Nellore cattle: Bibliographic review. Ciência Animal Brasileira, v.8. n.1. p.75-86, 2007.
FARIA, C. U. et al. Genetic analysis for visual scores of bovines with the linear and threshold bayesian models. Pesquisa Agropecuária Brasileira, v.43. p.835-841. 2008.
FERNANDES, P. B. et al. Emprego de modelos de limiar e linear para a estimação de componentes de variância para probabilidade prenhes em búfalas da raça Murrah. In: CONGRESSO BRASILEIRO DE ZOOTECNIA, 24., 2014, Vitória. A Zootecnia Fazendo o Brasil Crescer... Vitória, 2014.
GEWEKE, J. Evaluating the accuracy of sampling- based approaches to
calculating posterior moments. BayesianStatistics, v.4. p. 1-31, 1992.
MACHADO, R. et al. Escore de condição corporal e sua aplicação no manejo reprodutivo de ruminantes. São Carlos, SP, EMBRAPA, 2008. 16 p. (Circular Técnica).
MARCONDES, C. R. et al. Bayesian analysis for the index scrotal circumference /weight on Nellore animals born in the Tocantins state, Brazil. Archivos de Zootecnia, v.60. n. 232. p. 871-882, 2011.
MISZTAL, L. et al. BLUPF90 and related programs (BGF90). In:
WORLD CONGRESS ON GNETICS APPLIED TO LIVERSTOCK
PRODUCTION, 7., 2002, Montpellier, France Proceedings…
Montpellier: INRA, 2002. [CD ROM].
PIMENTEL, M. A. et al. Milk production and postpartum performance of Hereford cows in different reproduction condictions in a range breeding system. Ciência Rural, v.35. n.1. p.150-156, 2005.
RAFTERY, A. L.; LEWIS, S. One long run with diagnostics:
implementation strategies 474 for Markov chain Monte Carlo.
Statistical Science, v.7. n. 4. p. 475 493-497, 1992.
SANTOS, N. P. S. et al. Application of threshold model using Bayesian Inference in animal breeding. Publicações em Medicina Veterinária e Zootecnia, v.6. n. 27, Art. 1427, 2012.
SANTOS, N. P. S. et al. Environmental and genetic aspects of litter size in goats using linear and threshold bayesian models. Arquivo Brasileiro de medicina Veterinária e Zootecnia, v.65. n. 3. p. 885-893, 2013.
SAS. User’s guide.Version 9.0.4. ed. Cary, 2002. V.2.
SUGUISAWA, L. et al. Utilization of ultrasonography as a tool for
standardization of commercial carcasses. Tecnologia & Ciência Agropecuária, v.3. n.4.p.55-65,2009.
VAN KAAM, J. B. C. H. M. GIBANAL: Analyzing program for Markov Chain Monte Carlo sequences version 2.3,1997.
VAN TASSELL, C. P.; VAN VLECK, L. D. Multiple-trait Gibbs
sampler for animal models: flexible programs for Bayesian and