Dynamic formation of SEBS copolymer submicrometric structures
Michele A. Salvador
a, Andrea G.C. Bianchi
a,*, Marcelo A. Pereira-da-Silva
b,c, Antonio J.F. Carvalho
d,
Roberto M. Faria
baPhysics Department, University Federal of Ouro Preto, Campus Morro do Cruzeiro, Ouro Preto
e35400-000, MG, Brazil bInstitute of Physics of São Carlos, University of São Paulo, Av. Trabalhador São-carlense, 400, São Carlos -1356-970, SP, Brazil cUNICEP
eCentro Universitário Central Paulista, R. Miguel Petroni, 5111, São Carlos -13563-470eSP, Brazil
dDepartment of Material Engineering, University of São Paulo, Av. Trabalhador São-carlense, 400, São Carlos 1356-970, SP, Brazil
a r t i c l e
i n f o
Article history:
Received 7 April 2010 Received in revised form 21 June 2010
Accepted 30 June 2010 Available online 7 July 2010
Keywords:
Block copolymer Thinfilms Phase separation
a b s t r a c t
Highly ordered AeBeA block copolymer arrangements in the submicrometric scale, resulting from
dewetting and solvent evaporation of thin films, have inspired a variety of new applications in the nanometric world. Despite the progress observed in the control of such structures, the intricate scientific phenomena related to regular patterns formation are still not completely elucidated. SEBS is a standard example of a triblock copolymer that forms spontaneously impressive pattern arrangements. From macroscopic thin liquidfilms of SEBS solution, several physical effects and phenomena act synergistically to achieve well-arranged patterns of stripes and/or droplets. That is, concomitant with dewetting, solvent evaporation, and Marangoni effect, Rayleigh instability and phase separation also play important role in the pattern formation. These two last effects are difficult to be followed experimentally in the nanoscale, which render difficulties to the comprehension of the whole phenomenon. In this paper, we use computational methods for image analysis, which provide quantitative morphometric data of the patterns, specifically comprising stripes fragmentation into droplets. With the help of these computa-tional techniques, we developed an explanation for thefinal part of the pattern formation, i.e. structural dynamics related to the stripes fragmentation.
Ó2010 Elsevier Ltd. All rights reserved.
1. Introduction
The patterned structures formed from dewetting thinfilms of block copolymer (BC) in solution are developing a promising branch on template technology at nanoscale, but the underlying science is still opened to be explored[1e3]. The application of such structures have been considered as a potential alternative for the soft lithography applied in nano and microelectronics as well as in other branches of contemporaneous technologies such as microfluidics and biotechnology [4,5]. It is widely known that symmetrical ABA triblock copolymers (TBC), depending on the A/B molar (volume fraction) ratio, derive different
thermody-namically stable microphases: from lamellae to gyroidal
morphologies[6e8]. More recently, the dewetting of thinfilms of poly(styrene)-b-poly(ethene-co-butene-1)-b-poly(styrene) (SEBS) solutions, under the influence of solvent evaporation, resulted in self-organized patterns formed by submicrometric droplets and/
or stripes arrangements. These structures were found for a rela-tively low concentration of SEBS in the solution; above a certain concentration value thefinal result was a uniformfilm covering the whole substrate[9]. The explanation for the stripes formation comes from a non-classical dewetting process in which each point at the three-phase contact line recedes towards the center of the liquid-drop, while a gradient of copolymer concentration gener-ates an undulation at the vicinity of the contact line (Marangoni effect)[10]. Thus, long and parallelfingers are formed as thefilm shrinks. This phenomenon, called “regularfingering formation”, can, in many cases, generate a well-arranged pattern of stripes.
However, following the formation of fingers, they can be
frag-mented into droplets due to a phenomenon called Rayleigh instability. It was also observed that, depending on the receding speed of the contact line, the formation of droplets can occur
directly from the contact line rupture, preventing the fingers
formation[10].
A similar sequence of events had also been observed for
homopolymer solutions[5], but for block copolymers impressive
self-organized arrangements have been reported, as the
regular patterns composed of stripes or droplets [9,11]. Such
*Corresponding author. Tel.:þ55 3559 1742; fax:þ55 3559 1667.
E-mail address:[email protected](A.G.C. Bianchi).
Contents lists available atScienceDirect
Polymer
j o u r n a l h o m e p a g e : w w w . e l s e v i e r . c o m / l o c a t e / p o l y m e r
0032-3861/$esee front matterÓ2010 Elsevier Ltd. All rights reserved.
self-organized patterns were certainly caused by the dewetting phenomenon with a contribution of the solvent evaporation, but should be strongly affected by antagonistic interactions between block-segments of the copolymer, interactions that increase progressively as the solvent evaporates. On the other hand, studies carried out with thinfilms of polystyreneebutadieneepolystyrene
copolymerea copolymer with very similar properties to those of
the SEBSedeposited on solid substrates found regular cylindrical
polystyrene structures oriented either parallel or perpendicularly to the substrate[12]. Depending on the thickness of thefilm and the evaporation rate of the solvent, the thermodynamic equilib-rium, that involves both internal interactions and the interaction between thefilm and the substrate, defines the orientation of the
PS-cylinders [13]. In very thin films, PS-cylinders become
perpendicularly arranged to the surface of the substrate, but as the number of degrees of freedom rises, what happens as the thick-ness increases, the system progresses to a parallel orientation. Despite the progress in the understanding of self-organized patterns of SEBS in submicrometric scales, the entire mechanism involved in such phenomenon, however, remains to be fully
elucidated. The most obscure point is the finger fragmentation
phenomenon that occurs just after the formation of thefingers,
effects that happens when the amount of solvent is very small. This paper intends to give a contribution to the study of SEBS patterns, focusing on the geometrical and morphological infor-mation of fingers (called stripes from now on) and droplets. For this, we make use of the potential of quantitative computer techniques.
Due to the versatility and accuracy of the current image processing techniques, they have emerged as promising tools for microscopy image analysis and have been used to enrich
investigations of patterned nanostructures [14], specially for
morphological and surface analysis of thin films [15e18]. For this reason, this technique is adequate for obtaining important quantitative data to help in the investigation of the dynamic evolution of submicrometric SEBS structures, and can replace with great advantage the traditional methods provided by the commercial microscope software. In addition, it can process a large volume of imaging data in a semi-automated way, which allows for the study of statistical behavior of the collected data.
2. Materials and methods
2.1. Materials
We use a commercial SEBS (KratonÒ
G 1560) with weight ratio of 15(S):70(EB):15(S). The following values were obtained by gel permeation chromatography (GPC) in THF solution with
poly-styrene standards: Mw ¼ 112.000 g mol 1 and Mw/Mn ¼ 1.15.
Toluene was used as solvent, and mica substrate as cleaved was used as solid substrate. The advantage of mica comes from its very low roughness and because its surface is relatively chemically inert[19].
2.2. Sample preparation
A layer of mica freshly cleaved twice was then plunged for few seconds in a SEBS/toluene solution (w0.10 g L 1); enough time to form a thin liquidfilm that covers the whole area of the substrate. This dip coating procedure was carried out at
envi-ronmental conditions with temperatures between 20 C and
25 C and relative humidity between 30% and 40%. The liquid
film is then left in the laboratory environment for several
minutes for evaporating the toluene. Toluene is an appropriate
solvent for both PS and PEB, mainly because it does not influence the initial molecular interactions, that is, when the solution is
still diluted. The dynamics of molecular actions and the final
structural arrangement depend on the specific interactions
between each of the components of the block copolymer and the substrate.
2.3. AFM
AFM height images of the dried sample were obtained by
tapping-mode atomic force microscopy (TMeAFM) (Nanoscope
III, Digital Instruments). AFM analysis was carried out in a MultiMode Nanoscope 3 from Digital Instruments using inter-mittent contact mode (tapping-mode) with a silicon tip at 330.000 Hz oscillating frequency and scan speed 10 mm/s. The images were captured in the retrace scan direction for both height and phase images.
2.4. Image processing
AFM images were analyzed by calculating a set of semi-automated morphometric measurements such as height, area, width and distance of stripes and droplets of the SEBS structures. The initial processing step is the segmentation of objects (stripes or droplets) to be investigated. By applying an adaptive threshold algorithm to the AFM images, different morphological objects have been separated from the background, generating black
(background) and white (objects) images [20]. The objects
recognition is then extracted using the connected components labeling. This labeling technique groups pixels (the smallest cell of the image) into elements that share pixels of similar intensities
[20]. The pattern recognition for objects and the labeling of
various disjoint and connected components are decisive to a reliable automated image analysis, for example, the area calculation results in the sum of pixels for each object as well as mean height measures. The distance between neighboring objects, on the other hand, is measured according to the AFM image patterns, i.e. for droplets it is calculated as the distance between the centers of two objects, while for stripes it is obtained by a semi-automated procedure. In this procedure a line orthogonal to the stripes is determined over a segmented image, and the distance is obtained by the extension of the black pixels. For this paper in particular, these techniques contribute greatly for the specific dynamics related to the fragmentation of stripes in droplets.
3. Results
3.1. AFM images
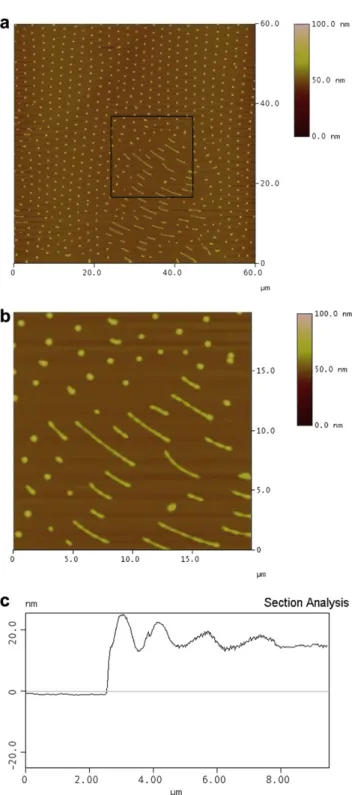
Fig. 1shows AFM images of self-organized structures found in different regions of the same sample. Fig. 1a exhibits a region patterned with parallel stripes, while in another region a quasi-perfect 2D hexagonal lattice constituted by submicrometric drop-lets was recorded (Fig. 1b)[9].Fig. 1c and dshow, using a section profile analysis (a height profile), how regular these structures are, as well as the uniformity of shapes of stripes and droplets. Those images are thefinal result after dewetting and solvent evaporation of a thin liquidfilm that was formed by dipping the mica substrate in a SEBS/toluene solution for few seconds[9]. SEBS stripes and droplets adhered to the mica surface after the complete evapora-tion of the solvent, and inside each stripe or droplet the phase separation is such that parallel cylindrical structures of polystyrene remain embedded in the poly(ethene-co-butene) matrix, as shown in the AFM phase image (Fig. 2). It is clear that some perpendicular cylinders also appear in the structure, mainly in the borders where the thickness is smaller. PS-cylinders reached hundreds of micrometers, and from the AFM images we can estimate an average diameter of about 12 nm for the cylinders, and a mean distance between two neighbouring cylinders also of 12 nm. However, we need to advise that it exists a certain imprecision in the lateral interaction between the tip and the surface in the phase mode, which can artificially enlarge the dimension of the cylinders[21]. Even so, this is in agreement with accurate measurements of Transmission Electron Microscopy technique (TEM) carried out in similar SEBSfilms that were deposited on liquid phosphoric acid substrate[7].
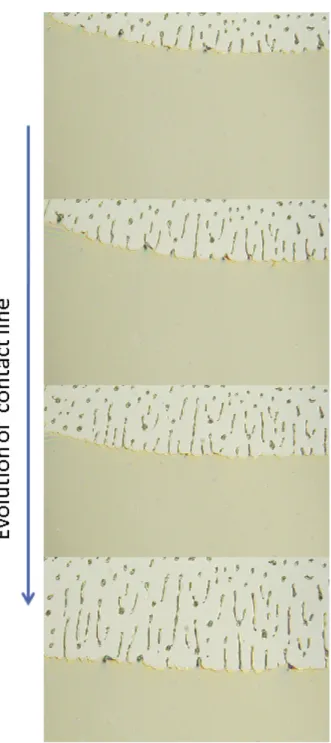
In other parts of the sample it is possible tofind mixed regions of stripes and droplets, in which it can be observed that the droplets are somehow germinated inside the stripes and then expelled from it (Fig. 3). This spontaneous segmentation of the stripes, probably related to the Rayleigh instability phenomenon, is still far of being completely elucidated. It is not possible to follow the dynamics of the stripe fragmentation because the resultant stripes and droplets are invisible to optical microscopy. However, when the procedure
described in Section 2.2 was repeated using smooth silicon as
substrate, similar and visible structures, but not well organized,
were formed.Fig. 3shows a sequence of optical images during the dewetting process of the SEBS: toluenefilm. The evolution of the system, as the contact line recedes, shows clearly the formation of
fingers and their fragmentation into droplets. This experiment
strengthens the hypothesis that the formation of stripes is an intermediate stage for afinal droplets pattern.
3.2. Image analysis
In possession of the computational tools described above we were able to obtain quantitative data for patterns of droplets and stripes shown inFig. 1, and also to contribute to the investigation of the stripes segmentation phenomenon (shown inFig. 4). Fig. 5a
shows a surface height picture extracted from Fig. 1c using the Matlab version 7.8, while inFigs. 5bed we present, respectively, graphs of height and width for the droplets. The colour gradient facilitates the visual analysis of the pattern. These results clearly show the regularity of the droplets pattern and the uniformity of their shape. Inserts inFig. 5b and cpresent the data displayed in the histograms, where we can verify the relatively narrow dispersions for these parameters. The average values for height, diameter and area were found to be 391 nm, 52020 nm and 0.200.09
m
m2, respectively.Fig. 6shows the stripe pattern by the same Matlab treatment (Fig. 1a), in which we can see a higher dispersion in the height distribution, therefore differently from the droplet pattern.The average value for the height of stripes is 23 2 nm. The
geometric measurements of typical structures formed on a mica substrate are compared inTable 1. However, this height value is slightly different from stripe to stripe because, as we discuss below, the droplets germination starts still inside the stripes. It is impor-tant to address here two imporimpor-tant points. First, the existence of a height gradient is clearly visible from one extremity of the picture to the other, as shown inFig. 6. This indicates that for any reason there is transport of mass along each stripe. Second, the height average for stripes is lower than that for droplets.
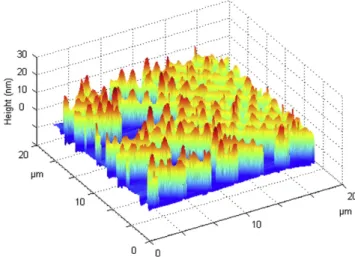
In order to gain more information about the morphometric parameters of these structures we applied the calculation given above to a transition region, i. e. a region that exhibits stripes and droplets. The pattern shown inFig. 7a (6060
m
m2) displays an example of such region. This analysis was carried out in the expanded region shown inFig. 7b and ca typical height profile of one stripe shows that it presents a height gradient. This gradient is more visible in the image built up by the computational manip-ulation of the structure shown in Fig. 7b (shown in Fig. 8), in agreement with what was already observed inFig. 6. This gradient is more visible in the image built up by the computational manipulation of the structure shown inFig. 7b (shown inFig. 8), in agreement with what was already observed inFig. 6. This gradient somehow continues along the droplets that were formed from the stripes segmentation, as shown in the graph ofFig. 8. These results reinforce the hypothesis that the morphology of droplets starts to be germinated inside the stripes, and that thefinal morphology of droplets ends after the segmentation process. In contrast with the values exhibited inTable 1, the height average values for stripes and droplets in the transition region are, respectively, 30 nm and 35 nm.Fig. 3.Optical image of the receding contact line of SEBS toluene thin liquidfilms onto silicon substrate. The interval between two subsequent pictures was 0.25 s.
4. Discussion
As described in the introduction, the formation of fingers
during the dewetting of SEBS/toluene thin films onto mica
substrates is caused by a Marangoni effect at the contact line.
There upon a periodic instability occurs along eachfinger (stripe), as can be seen inFigs. 3 and 4. This effect is similar to the Ray-leighePlateau phenomenon[22]. In a good approximation we can
consider aflat rectangular geometry for the stripes with a cross area defined by a widthlz400 nm and a thicknessdsz23nm.
The established wavy perturbation of wavelength
l
causes a masstransport from the troughs to the crests, which induced the fragmentation of the stripes into droplets (nanometric discs). Being
p
b2the area of each droplet, wherebis the radius, anddditsthickness, by the volume conservation condition,
l
is equal to(
p
b2/l)(dd/ds). The free energy per wavelength for stripes can be considered asl
l(g
sþg
g), and for the each dropletp
b2(g
sþg
g), whereg
sis the surface tension at the interface with the substrate, andg
gthat in contact with the air. Since the condition for thefragmentation is the reduction of the free energy,
l
should behigher than (
p
b2/l), ordd>ds. This condition is in agreement withthe data shown inTable 1.
The question now is: how are the modifications in the internal morphology when stripe segments evolve into droplets? First, we should consider that the internal morphology of such SEBS struc-tures (stripes and droplets) is formed by layers (terraces) in which spaced glassy cylinders of polystyrene, disposed in parallel to the substrate, are immersed in a rubbery matrix of poly(ethene-co-butene)[12,23], with an autophobic PS-layer beneath. This model is proposed by analogy with models for SEBS thinfilms and similar copolymers[12,21,23,24]. It has been extensively discussed in the
literature that depending on the surface field PS-cylinders lie
aligned perpendicular or parallel to the substrate surface. The images ofFig. 2indicate that for stripes and droplets the cylinders lie rather with their axis parallel to the substrate, despite the existence of some perpendicular cylinders. Therefore, we assume that the height of each stripe (droplet) can be defined by stacked terraces added to the bottom autophobic layer, as depicted inFig. 9. For a stripe that has an average height equal to 23 nm the height is
ds¼hþdt, wheredtis the top-terrace thickness, while each droplet Fig. 5.(a) 3D surface image of droplets ofFig. 1a, where colour gradient represents
height values. (b) Height and (c) width of droplets patterns, respectively. Insertions intoFig. 5b and c represent the data displayed in histograms.
Fig. 6.3D surface stripes image ofFig. 1c, the colour gradient represents height values.
Table 1
Geometrical parameters measurement of self-assembled copolymer, stripes and droplets: the mean height, width and area for objects.
Objects Mean height (nm)
Width (mm)
Area (mm2)
Stripes (Fig. 1a) 232 0.4060.005 e
has in addition an intermediate terrace with thicknessdi, having a total height given bydd¼hþdiþdt, whose experimental value is 39 nm.
Therefore, the thickness of the internal lamella diis 16 nm, which is lower than the distance between two cylinders at the surface (24 nm), but we need to make the projection since the cylinders packing form a triangular arrangement. To sustain this model we need to assume that along thez-direction the internal structure is under a compression caused by interfacial interactions.
Beingdtapproximately equal todi,hresults to be equal to 7 nm. However, based on the model ofFig. 9,dtis slightly lower thandi,
and h7 nm.
5. Conclusions andfinal remarks
A summary explanation of the structures formation shown in Figs. 1 and 2can be given in three steps. First, the Marangoni effect occurs in the vicinity of the contact line during the dewetting of the thin film liquid (still a film in solution), an effect that can be generated by a local gradient of the solute (SEBS molecules) with the contribution of the solvent evaporation[10]. In a second step, the undulations along the contact line triggers the formation of
fingers, and as thefilm shrinks thesefingers are stuck in a parallel arrangement on the mica surface composing the pattern of stripes (Fig. 1a); this was corroborated by the optical images presented in Fig. 3. The third step, which is the main contribution of this paper, is related to a particular sort of Rayleigh instability, in which the stripes break up in droplets[25]. It is also known that in thinfilms of SEBS and similar copolymers the phase separation forms a cylindrical domain structure, and for thinfilms the cylinders can be oriented in parallel to the solid surface [5,12]. Other studies showed that in very thinfilms the orientation of the cylinders is
perpendicular, while for thicker films (above 100 nm) they are
disposed in parallel to the substrate[12,23]. We proposed a model for the morphologies of the stripe and droplet structures, in which
Fig. 7.(a) AFM height image of SEBS copolymer illustrating a transition region, i.e. region that exhibits stripes and droplets, (b) zoomed image obtained from dark region ofFig. 7a, and (c) the illustration of a stripe section analysis in a transition region.
Fig. 8.3D surface of transition region presented inFig. 7b, the colour gradient represents height values.
Fig. 9.Illustration of formed SEBS thinfilm over mica substrate, h is the non structure layer, result of mica copolymer interaction. (a) Represents a transversal profile of a stripe in which lamelladtis the top-terrace thickness, and (b) the profile of a droplet
the only difference is in the number of terraces formed by PS-cylinders. This model was obtained from AFM of SEBS images that show parallel arrangement of PS-cylinders. Computational image processing was essential to elaborate the model because provided accurate quantitative values for the heights of stripes and droplets, as well as the height variation in transition regions that showed the stripe fragmentation into droplets.
Acknowledgment
This work was sponsored by CNPq, Fapemig, FAPESP (Proc. No. 02/07368-9), Capes, and the National Institute of Science and Technology of Organic Electronics (INEO).
References
[1] Hamley IW. Nanotechnology 2003;14:R39e45.
[2] Segalman RA. Mater Sci Eng R 2005;48:191e226.
[3] Lee G, Jo PS, Yoon B, Kim TH, Acharya H, Ito H, et al. Macromolecules 2008;41:9290e4.
[4] Xu C, Fu XF, Fryd M, Xu S, Wayland BB, Winey KI, et al. Nano Lett 2006;6: 282e7.
[5] Karthaus O, Koito T, Shimomura M. Mater Sci Eng C 1999;8e9:523e6.
[6] Liu Y, Li M, Bansil R, Steinhart M. Macromolecules 2007;40:9482e90.
[7] Wang Y, Shen JS, Long CF. Polymer 2001;42:8443e6.
[8] Sierra CA, Galán C, Fatou JG, Parellada MD, Barrio JA. Polymer 1997;38 (17):4325e35.
[9] Carvalho AJF, Pereira-da-Silva MA, Faria RM. Eur Phys J E 2006;20: 309e15.
[10] Karthaus O, Grasjö L, Maruyama N, Shimomura M. Chaos 1999;9:308e14.
[11] Han X, Hu J, Liu H, Hu Y. Langmuir 2006;22:3428e33.
[12] van Dijk MA, van der Berg R. Macromolecules 1995;28:6773e8.
[13] Kim G, Libera M. Macromolecules 1998;31:2569e77.
[14] Rehse S, Mecke K, Magerle R. Phys Rev E 2008;77:51805e13.
[15] Martín-Palma RJ, Pascual L, Herrero P, Martinez-Duart JM. Appl Phys Lett 2002;81:25e7.
[16] Mahadevan S, Casadent D. Ultramicroscopy 2003;96:153e62.
[17] Oh S, Hyon C, Sull S, Hwangb S, Park Y. Rev Sci Instrum 2003;74:4805e11.
[18] Israelachvili JN, Alcantar NA, Maeda N, Mates TE, Ruths M. Langmuir 2004;20: 3616e22.
[19] Gonzalez RC. In: Woods RE, editor. Digital image processing. 2nd ed. Addison-Wesley; 1992.
[20] Motomatsu M. Polymer 1997;38(8):1779e85.
[21] Wang Y, Song R, Li Y, Shen J. Surf Sci 2003;530:136e48.
[22] Rayleigh L. Proc London Math Soc 1878;10:4e12.
[23] Knoll A, Magerle R, Krausch G. J Chem Phys 2004;120:1105e15.
[24] Epps TH, DeLongchamp DM, Fasolka MJ, Fischer DA, Jablonski EL. Langmuir 2007;23:3355e62.