A MOLECULAR METHOD FOR A QUALITATIVE
ANALYSIS OF POTENTIALLY CODING
SEQUENCES OF DNA
CHRISTOFFERSEN, M. L.,1 ARAÚJO, M. E.2 and MOREIRA, M. A. M.3
1Departamento de Sistemática e Ecologia, Universidade Federal da Paraíba, CEP 58059-900, João Pessoa, PB, Brazil
2Departamento de Engenharia de Pesca, Universidade Federal do Ceará, Campus do Pici, Bloco 827, CEP 60455-760, Fortaleza, CE, Brazil
3Divisão de Genética, Instituto Nacional de Câncer, Praça da Cruz Vermelha, 23, CEP 20230-130, Rio de Janeiro, RJ, Brazil
Correspondence to: Martin Lindsey Christoffersen, Departamento de Sistemática e Ecologia, Universidade Federal da Paraíba, CEP 58059-900, João Pessoa, PB, Brazil, e-mail: [email protected]
Received February 4, 2003 – Accepted April 30, 2003 – Distributed August 31, 2004 (With 2 figures)
ABSTRACT
Total sequence phylogenies have low information content. Ordinary misconceptions are that character quality can be ignored and that relying on computer algorithms is enough. Despite widespread preference for a posteriori methods of character evaluation, a priori methods are necessary to produce
trans-formation series that are independent of tree topologies. We propose a stepwise qualitative method for analyzing protein sequences. Informative codons are selected, alternative amino acid transformation series are analyzed, and most parsimonious transformations are hypothesized. We conduct four phy-logenetic analyses of philodryanine snakes. The tree based on all nucleotides produces least resolution. Trees based on the exclusion of third positions, on an asymmetric step matrix, and on our protocol, produce similar results. Our method eliminates noise by hypothesizing explicit transformation series for each informative protein-coding amino acid. This approaches qualitative methods for morphological data, in which only characters successfully interpreted in a phylogenetic context are used in cladis-tic analyses. The method allows utilizing character information contained in the original sequence alignment and, therefore, has higher resolution in inferring a phylogenetic tree than some traditional methods (such as distance methods).
Key words: molecular cladistics, qualitative approach, a priori method, mitochondrial cytochrome
b gene, Serpentes.
RESUMO
Um método molecular para análises qualitativas de seqüências potencialmente codificadoras de DNA
Filogenias baseadas em seqüências totais têm baixo conteúdo informativo. Erros comuns são acreditar que a qualidade dos caracteres pode ser ignorada e que é suficiente confiar nos algoritmos computacionais.
Apesar de ampla preferência por métodos a posteriori para a avaliação de caracteres, métodos a priori
cada aminoácido informativo para a codificação de proteínas. Essa abordagem se aproxima de métodos qualitativos para dados morfológicos, nos quais apenas caracteres interpretados com sucesso num contexto filogenético são usados em análises cladísticas. O método permite utilizar informação de caracteres con-tidos no alinhamento original da seqüência e, portanto, tem maior poder de resolução para inferir árvores filogenéticas que alguns métodos tradicionais (como métodos de distância).
Palavras-chave: cladística molecular, abordagem qualitativa, método a priori, gene mitocondrial citocromo
b, Serpentes
INTRODUCTION
Phylogenetic systematics represents one of the fundamental branches of the biological sciences. We need stable and realistic biological systems based on the phylogeny of living organisms for effective communication among scientists, for teaching purposes, and for research (Wägele, 1999). Total sequence studies are known to produce phylogenies of low information content, although the signals may be sufficient to indicate relationships that are at least partly congruent with phylogenies based on mor-phological data (Dreyer & Wägele, 2001).
DNA and amino acid sequences have been used for phylogenetic studies since 1967, with algorithms based on distance and parsimony metho-dologies (e.g., Fitch & Margoliash, 1967; Fitch,
1971; Moore et al., 1973, 1976; Felsenstein, 1988;
Swofford et al., 1996a; Li, 1997). Particularly,
mitochondrial DNA sequences were largely used in phylogenetic approaches due to the development
of the PCR methodology (Mullis et al., 1986) using
"universal" primers (Kocher et al., 1989; Irwin et
al., 1991).
The higher nucleotide substitution rate of
mt-DNA (Brown et al., 1979) leads to the employment
of different methods aimed at reducing the noise present in data sets. These methods can be divided into two groups: (1) methods that eliminate characters or state changes (i.e., eliminating the third codon at all positions, considering only transversions at the third codon position, considering only transversions at all sites, or using the deduced amino acid sequences); and (2) methods that give different weights for state changes (weighted parsimony [Farris,
1969] and transversion parsimony [Swofford et al.,
1996b]). The use of amino acid sequences employs alternative approaches considering the amino acid substitutions, or the minimal number of nucleotide
substitutions necessary to change from one amino acid to another.
One of the logical mistakes common among cladists, particularly molecular systematists, is to believe that character quality can be ignored and that it is enough to rely on the algorithms of a computer program. So one of the important questions of molecular phylogeny involves exploring the information content of DNA sequences. Cladists
prefer a posteriori methods of character evaluation,
of which the most decisive test is overall congruence
with other homologies (Patterson, 1988). But a priori
methods of probability of homology that are not dependent on tree topology are also necessary for evaluating characters. The security for a hypothesis of homology increases with the degree of complexity and similarity of the compared structures (Remane, 1961). In molecular phylogeny, the analysis of larger portions of molecules than single nucleotides and amino acids may be interesting in this respect because they provide more complex characters more easily subject to quality assessments.
Several methods have been developed for the reconstruction of historical relationships among species and higher taxa (Li, 1997). In the last decade, cladistic analyses have been dominated by molecular data, but in practice conspicuous contradictions occur between morphological and molecular data, and also within each class of characters (Wägele & Wetzel, 1994; Dreyer & Wägele, 2001).
reasons: (1) ambiguous alignments (Lake, 1991; Wägele & Stanjek, 1995; Winnepenninckx & Backeljau, 1996); (2) lack of strong statistical support for important groupings; (3) results sensitive to and affected by the chosen representative groups for
analyses (Wheeler, 1990; Lecointre et al., 1993); (4)
statistical inconsistency (as the amount of data in-creases, so does the statistical support for an incorrect phylogenetic tree); (5) long branch attraction; (6) the symplesiomorphy trap (Wägele, 1999).
The amino acid sequences of proteins may be more immune to the problems of long branch attrac-tion. Furthermore, protein-coding genes constitute a much larger proportion of the genome than RNA-coding genes. Thus, it is likely that protein sequences will eventually become a major source of data for inferring phylum-level relationships (Goldman & Yang, 1994), especially with the growing number of
animal genome projects (Abouheif et al., 1998;
McHugh, 1998; Maley & Marshall, 1998; Giribet & Wheeler, 1999). Wägele (1999) has recognized that errors in phylogenetic inference can occur at three different levels: species sampling, character sampling, and selection of tree constructing algorithms.
Our aim in this paper is to provide a new qualitative method for phylogenetic analyses of sequence data. The proposed method considers those alterations in nucleotides that effectively result in corresponding changes in amino acids. To accomplish this, we analyse a priori transformation series that are considered to be most parsimonious within an evolutionary context.
MATERIAL AND METHODS
Phylogenetic analysis
The sequence data of DNA was analyzed using the program PAUP 4.0 (Phylogenetic Analysis Using Parsimony) (Swofford, 1998) with branch and bound to obtain the most parsimonious trees (Fig. 1a, b). A bootstrap analysis was conducted with 1,000 replications. These data were analyzed using two distinct treatments: complete sequences and sequences without third positions.
Our proposed method for a qualitative analysis of sequence data
The method presented herein compares protein sequences for the analysis of transformation series of amino acids (Table 1), starting with the analysis of their respective codons. In other words, beyond
the simple consideration of final DNA sequences as presented by many computerized cladistic pro-grams, our method considers possible transfor-mations and number of evolutionary steps that may occur in each series.
There are three main types of transformation series: (1) when a single substitution of a nucleotide is responsible for the direct passage from the plesiomorphic to the apomorphic character condition; (2) when the passage from the plesiomorphic to the apomorphic condition implies one or more interme-diate codons synonymous to one of these two ter-minal amino acids; (3) when the passage from a plesiomorphic to an apomorphic condition implies the formation of one or more intermediary amino acids that are distinct from terminal amino acids.
Criteria for tree construction using qualitative information from sequence data
Criteria used to construct our stepwise matrix (Table 1) and the asymmetric step matrix for non-synonymous nucleotide substitutions (Appendices 1, 2) are based on the vertebrate mitochondrial genetic code. To construct a cladogram based on the qualitative information contained in sequence data, we consider the following situations for the mitochondrial DNA genetic code:
(1) Nucleotide replacements that result in single amino acid substitutions were given priority. Synonymous replacements between homologous codons were not considered as producing extra steps in the analyses.
Example: Outgroup: ATTIle; ingroup: ACCThr.
Possible parsimonious transformation series: (1)
ATTIle→ ATCIle → ACCThr; (2) ATTIle→ ACTThr →
ACCThr. Both cases involve two transitions in the
second and third bases, passing by an intermediary codon.
(2) For Leucine and Serine, which were coded
by six different codons each, the codons UURLeu,
CUCLeu, AGYSer, and UCXSer were considered to be
different character states.
Example: All ingroups share Leucine, but some taxa have codon CTA and others TTA. We will obtain two different clades, based on the two distinct codons.
(3) Codons present or absent at homologous positions were considered to reduce the number of steps to explain a topology.
Example: Outgroups: ATCIle; ingroup: ATCIle,
transformation series: (1) ATCIle→ ATA/GMet → TTA/
GLeu, with two transversions in the first and third
positions; (2) ATCIle→ ATA/GMet and ATCIle → TTCPhe→
TTA/GLeu, with one transversion (in the third position)
for Methionine, and two transversions (in first and third positions) for Leucine. The first series is more parsimonious for not implying in the appearance of an extra amino acid that is not present among the studied groups.
(4) Stop codons were excluded as intermediary or terminal character states.
Example: (1) CGAArg→ AGA (Stop code) →
AGC/TSer. (2) CGAArg→ CGTArg→ AGC/TSer. Both
series have two transversions, in the first and third bases. We opt for the second series, because of the absence of a stop codon.
(5) Following the establishment of the most consistent synapomorphies, reversions will be considered if they reduce the total number of steps in a sequence.
The asymmetric step matrix for non-synonymous substitutions
In addition to this method, we constructed a matrix from an asymmetric step matrix (Appendices 1, 2) based on the known vertebrate mitochondrial genetic code. This step matrix was implemented in PAUP 4.0 for the construction of cladograms (Fig. 1c, d) to test the consistency of our method.
To construct this step matrix, codons for the same amino acid that differ by a third base transversion must be coded as different character states, and codons for the same amino acid differing by a third base transition must be coded as a same character state. The six codons for Serine and Leucine are coded by three different symbols each (see Appendix 1).
The use of an asymmetrical step matrix may
be justified by the following example: CAYHis →
GUXVal imply in two nucleotide substitutions, i.e.,
two steps. However, the reverse change, GUXVal
CAYHis, may involve two (GUYVal→ CAYHis) or three
nucleotide substitutions (GURVal→ CAYHis). This
matrix differs from previous symmetrical step matrices (Fitch & Margoliash, 1967), which are based on the minimal number of nucleotide replacements necessary to explain an amino acid substitution. These symmetrical matrices do not consider the DNA codon sequences. Consequently, the amino acid substitutions
Val → His or His → Val will involve only two
nucleotide substitutions, as the third codon position
is not taken into account. This step matrix was used in PAUP 4.0 with the option ALLSTATES, which considers all possible options for character states to be assigned to inner nodes (Swofford, 1998). The results obtained from the computerized analyses with PAUP 4.0 are compared with the cladogram constructed with the new qualitative method proposed herein (Fig. 2).
RESULTS
In this paper we have explored the quality of sequence data for phylogenetic inference. We pro-pose an alternative approach (using an asymmetric step matrix) that considers nucleotide replacements that effectively lead to amino acid substitutions for the construction of phylogenies. Initially, it is necessary to construct a data set considering the codons deduced from nucleotide sequences. Thus, codons for the same amino acid that differ by transitions in the third codon position are considered the same character state. Using the vertebrate mitochondrial genetic code, as in our example, codons for Phenylalanine, UUU and UUC, are represented in the data set by the same symbol; codons for Proline CCU and CCC, or CCA and CCG are represented by two different symbols. The asymmetric step matrix for character state changes takes into account only nucleotide replacements that lead to amino acid substitutions. Exemplifying, a
codon substitution from CCYPro to CCRPro, or
vice-versa, receives the value 0 (zero steps) as there is no amino acid substitution; a substitution from
CCYPro to UUYPhe and from UUYPhe to CCXPro
receives the value 2 (two steps); and a substitution
from CCRPro to UUYPhe receives the value 3 (three
steps).
Amino acids like Serine and Leucine, which are coded by six different codons (UCX/AGY and UUR/CUX, respectively) deserve special attention, as replacement of a codon by another could imply
an intermediate amino acid (UCXSer to AGYSer would
imply the intermediate codons UGYCys, UGRTrp,
AUYLeu, AURMet). Thus, the phylogenetic information
comprised in these substitutions could be used, given the number of nucleotide substitutions necessary
to change from one codon to another: from UCXSer
to AGYSer, two or three steps, and from AGYSer to
UCXSer, two steps; from UURLeu to CUXLeu , one step,
a) P . o . la ti ro s tr is P . o . o lf e rs i P . p a ta g o n ie n s is P . a e s ti v a P . n a tt e re ri P . v ir id is s im a T . s e rr a T . s tr ia ti c e p s O . g u ib e i X . n e u w ie d i P . b a ro n i N . fa s c ia ta T h . e rr a n s b) P . o . la ti ro s tr is P . o . o lf e rs i P . p a ta g o n ie n s is P . a e s ti v a P . n a tt e re ri P . v ir id is s im a T . s e rr a T . s tr ia ti c e p s O . g u ib e i X . n e u w ie d i P . b a ro n i N . fa s c ia ta T h . e rr a n s c) P . o . la ti ro s tr is P . o . o lf e rs i P . p a ta g o n ie n s is P . a e s ti v a P . n a tt e re ri P . v ir id is s im a T . s e rr a T . s tr ia ti c e p s O . g u ib e i X . n e u w ie d i P . b a ro n i N . fa s c ia ta T h . e rr a n s d) P . o . la ti ro s tr is P . o . o lf e rs i P . p a ta g o n ie n s is P . a e s ti v a P . n a tt e re ri P . v ir id is s im a T . s e rr a T . s tr ia ti c e p s O . g u ib e i X . n e u w ie d i P . b a ro n i N . fa s c ia ta T h . e rr a n s
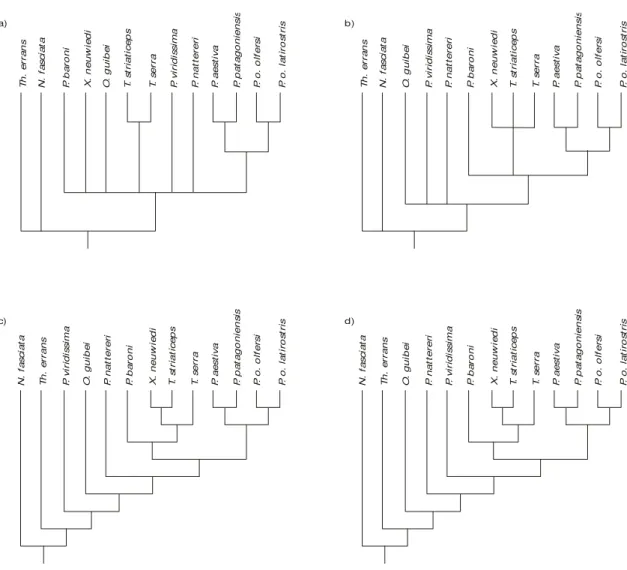
Fig. 1 — (a) Strict consensus of three equally parsimonious trees using complete sequences of nucleotides. Obtained with PAUP4.0 (length, 406, CI, 0.603); (b) strict consensus of four equally parsimonious trees using sequences of nucleotides without the third positions of codons. Obtained with PAUP 4.0 (length, 131, CI, 0.718). (c) and (d), the two most parsimonious trees obtained with the asymmetric step matrix (Appendix 3) in PAUP 4.0 (length 140). N, Nerodia; O, Oxyrhophus; o, olfersi; P, Philodryas; T,
Tropidodryas; Th, Thamnophys; X, Xenodon.
When the analyses conducted by us are com-pared, it is interesting to note that the phylogeny based on all nucleotide positions (306 bases) results in the tree of least resolution (Fig. 1a). On the other hand, the tree based on the exclusion of third positions (Fig. 1b) is similar to the phylogeny obtained with the application of our method (Fig. 2), but differs by its lesser resolution.
Philodryas viridissima is placed within the
ingroup based on the most parsimonious transformation series according to our analysis (Fig. 2). Codon in
sequence position number 10 (Table 1) was responsible for this relationship. The transformation series of codon 10 is also representative of our methodological approach. The outgroups have Alanine for codon 10, while the ingroups usually have Isoleucine, except
for Tyrosine in Philodryas viridissima, and Valine in
P. nattereri. The most parsimonious hypothesis for the
transformation from Alanine to Isoleucine is through
Valine. Consequently, P. nattereri must occupy a
P. p a ta g o n ie n s is P. o . la ti ro s tr is P. o . o lf e rs i P. a e s ti v a T. s e rr a T. s tr ia ti c e p s X . n e u w ie d i P. b a ro n i P. v ir id is s im a P. n a tt e re ri O . g u ib e i N . fa s c ia ta T h . e rr a n s
9 (S L) 11 (L I) 14 (M L) 17 (F L) 28 (D N) 32 (T S) 38 (T S) 41 (V I) 46 (I M ) 48 (Q R) 73 (G A) 82 (M T) 90 (I T)
→ → → → → → → → → → → → →
90 (T A)→
13 (I T)→
34 (V I) 9 (L2 L1)→
→
35 (I V)→
10 (V I)→
10 (A V) 32 (S T) 82 (L M ) 82 (L1 L2)
→ → → →
14 (I M ) 28 (N D) 34 (I V) 50 (T L) 53 (I T) 79 (E T)
→ → → → → →
90 (I T)→
28 (D Y) 53 (T I) 79 (T P)
→ → →
14 (M I)→ 50 (L1 L2)→
14 (M L2) 35 (V I)
→ →
14 (M T) 17 (L1 L2) 28 (D A) 35 (V A) 53 (T N) 79 (T K) 82 (M N) 9 (L1 L2) → → → → → → → → 5 (TTA) 6 (TTA) 19 (TTA) 29 (TTA) 82 (TTA) 88 (CTA) 91 (TTA)
Fig. 2 —Cladogram constructed step by step for complete sequences of amino acids. The numbers on the nodes of the cladogram
indicate the positions of amino acids in the DNA sequence, and the letters that follow represent the proposed transformations for each amino acid. Capital letters represent amino acids according to international convention for single letter abbreviations. See legend of Fig. 1 for full names of taxa.
series Alanine → Tyrosine (character 10 in Table 1),
a Serine would be the necessary intermediary amino acid, but it is absent in all sampled taxa. As the alternative transformation from Isoleucine to Tyrosine occurred in our studied sample and reduced one required step in the analysis, this transformation is preferred over the alternative that requires an amino acid that does not exist in our sample and necessitates an additional step.
To further extend the method proposed herein, it would be necessary to interpret the transformations in the molecular structure of the amino acids occurring in each mutation. Similarly to the asymmetry of the amino acid transformations in the step matrix, the sequence of mutations occurring within a codon is not regular. The probability of the first mutation
occurring in the first or second nitrogenated base may depend on their molecular structures.
Example of an application of our method
To illustrate our method, we present in this section a phylogenetic analysis of nine snake taxa
belonging to Philodryas and Tropidodryas
(Ser-pentes), included in the monophyletic taxon Philodryadini (Ferrarezzi, 1994). As outgroups we
used Xenodon neuwiedi and Oxyrhopus guibei,
both belonging to Xenodonthini, which is the sister
group of Philodryadini, and Thamnophys errans
and Nerodia fasciata, which belong to the tribe
Sequences of Thamnophys errans and Nerodia fasciata were obtained from GenBank (EMBL) (De
Queiroz & Lawson, 1994). The remaining taxa were sequenced (306 base pairs of cytochrome b) and deposited in the GenBank under the following numbers: AF236804 to AF236814.
The results of the alignments of nucleotides and amino acids appear in Appendices 3 and 4, respectively. Fig. 1a represents the strict consensus of three equally parsimonious trees obtained with PAUP 4.0 for the complete sequences of nucleotides. Fig. 1b shows the consensus analysis of the same data, but from which the third position of each codon was not considered.
Table 1 presents the analysis of transformation series of codon sequences that produced amino acids for more than one species and that were used as synapomorphies. Also shown in Table 1 are the transformation series for codons and amino acids, the kind of substitution (transition or transversion), and the total number of steps required for amino acid substitutions. The stepwise analysis presented in Table 1 served to construct the cladogram displayed in Fig. 2.
DISCUSSION
We are not the first to propose a priori
estima-tions of phylogenetic information conserved in aligned sequences. One indication that the quality of sequence data must be determined a priori is the observation that high bootstrap supports can result from chance
similarities or long branch effects (Otto et al., 1996).
The belief of many researchers that it is possible to
obtain monophyletic groups without establishing a
priori hypotheses of character transformation may
represent a dream (Wägele, 1994). The a posteriori
polarization of characters is based on circular argumentation, since the resulting hypotheses are then used to corroborate the hypothesis obtained in the cladogram (Wägele, 1994). We conclude that perfect methods of analysis do not exist. While some researchers perceive character polarizations as introducing apriorisms into the analysis, according to others avoiding such polarizations produce cir-cular arguments in the analysis.
Progress in the analysis of sequence data would thus seem to depend on the continued search for new methods to estimate the quality of the data used in
an analysis. Philippe et al. (1994) concluded that the
ssu rDNA molecule does not contain information
adequate for several nodes of the tree for the Cambrian radiation of metazoans. Wägele & Rödding (1998) show that in analyses of published 18S rDNA alignments the signal-to-noise relationship varies greatly in a way not detected by conventional cons-truction methods. Thus, not every seemingly "good" tree actually represents phylogeny. Unrelated species may share by chance alone one of the four possible nucleotides at a site (Maley & Marshall, 1998). The accumulation of these chance events between distantly related species will tend to overwhelm the similarities present due to the shared ancestry of more closely related taxa (Felsenstein, 1978). When biological knowledge is obtained about what is happening to characters during evolution, our initial biological hypotheses may eventually need to be reinterpreted. Consensus trees will not be sufficient to establish any definitive topology for these characters (Bremer, 1988). Consensus trees are not sufficient to establish phylogeny because of the high saturation level affec-ting nucleotides. Although amino acid sequences correct for saturation, they have been considered as being subject to convergence and as ignoring phyloge-netically informative variation (Simmons, 2000). We do not agree with this position, however. Our method attempts to avoid the high saturation level of nucleo-tides in synonymous positions (= noise), considering non-synonymous substitutions.
Comparing the consensus tree obtained with PAUP with the asymmetric step matrix (Fig. 1c, d) and with the tree constructed with our method (Fig. 2), a few interesting dedications may be made. One of the two most parsimonious trees found by PAUP is identical to the topology obtained with our method, with the exception of the relative positions of the two outgroups. The conflict occurs mainly due to different interpretations regarding position 57 of the sequence of amino acids. The PAUP program obtains Isoleucine,
an autapomorphy for Thamnophys errans, as
plesiomorphic. We gave priority to position 90 over 57, because it represents a synapomorphy that unites
Nerodia fasciata to the remaining taxa, excluding T. errans to a more basal position. The interpretation
of characters in positions 90, 32, and 28 is responsible for the variation in topology between the two trees found with PAUP (Fig. 1c, d), in which the positions of Philodryas natteri, P. viridissina, and P. baroni
TABLE 1
Transformation series analysis of amino acid sequences and their codons.
Seq.p os.
Sampled amino acids
Sampled
codons Transformation series (codons)
Transformation series (amino
acids)
Changes
9 2 steps, 2
AA
Ser, Leu TCPu, CTA (TCG→TCA)→TTA→CTA (Ser→Ser)→Leu1→
Leu2 1s, 2s, 3s
10 7 steps, 5
AA
Ala, Val GC(A,C,T), GTA GCPi→GCA→GTA (Ala→Val Ala)→ 2s, 3sv
Val, Ile GTA, ATPi GTA→GTPi→ATPi (Val→Val)→Ile 1s, 3v
Ile, Tyr
ATC, TAT (ATC→ATT)→AAT→TAT (ATC→ATT)→TTT→TAT
(Ile→Ile)→
Asn→Tyr (Ile→Ile)→
Phe→Tyr
1v, 2v, 3s 1v, 2v, 3s
11 2 steps, 2 AA
Leu, Ile CTA, ATT CTA→CTT→ATT Leu→Leu→Ile 1v, 3v
13 2 steps, 2 AA
Ile, Thr ATPi, ACC ATT→ATC→ACC Ile→Ile→Thr 2s, 3s
14 4 steps, 4
AA
Ile, Met ATPi, ATA ATPi⇔ATA Ile⇔Met 3v
Met, Leu ATA, CTA ATA→(CTA⇔TTA) Met→(Leu1⇔
Leu2) 1v
Met, Thr ATA, ACC ATA→ATC→ACC Met→Ile→Thr 2s, 3v
17 1 step, 2 AA
Ser, Leu TTN, CTA TTN→(TTA→CTA) Ser→(Leu1→
Leu2) 1s, 3v
28 3 steps, 3
AA Asn, Asp AAC, GAPi AAC⇔ (GAC→GAT) Asn⇔ (Asp→Asp) 1s, 3s
Asp, Tyr GAC, TAC GAC→TAC Asp→Tyr 1v
Asp, Ala GAC, GCC GAC→GCC Asp→Ala 2v
32 1 step, 2 AA
Ser, Thr TC(A,C), ACA (TCC→TCA) ⇔TCC (Ser→Ser) ⇔Thr 1v, 3v
34 2 steps, 2
AA
Ile, Val GT(A,C,T) ATPi, (ATT→ATC) ⇔ (GTC→GT(A,T) (Ile→Ile) ⇔
(Val→Val) 1s, 3sv
35 2 steps, 3
AA
Ile, Val ATPi, GTPi ATPi→GTPi Ile→Val 1s, 3s
TABLE 1 (Continued.)
Seq. pos.
Sampled amino acids
Sampled codons
Transformation series (codons)
Transformation series (amino
acids)
Changes
38 4 steps, 3
AA
Thr, Ser AC(A,C), TCA (ACC→ACA)→TCA (Thr→Ser Thr)→ 1v, 3v
Thr, Met AC(A,C), ATA (ACC→ACA)→ATA (Thr→Met Thr)→ 2s, 3v
41 1 step, 2
AA
Val, Ile GTN, ATC (GTPu→GTPi)→ATC (Val→Val)→Ile 1s, 3sv
46 1 step, 2
AA
Ile, Met ATPi, ATPu ATPi→ATPu Ile→Met 3sv
48 1 step, 2
AA
Gln, Arg CAA, CGA CAA→CGA Gln→Arg 2s
50 5 steps, 3
AA
Thr, Leu ACC, CTN ACC→ATC→(CTC→CTN) ACC→CCC→CTC→CTN)
Thr→Ile→(Leu→ Leu) Thr→Pro→ (Leu→Leu)
1v, 2s, 3sv 1v, 2s, 3sv
Leu CTN, TTA (CTN→CTA)→TTA Leu1→Leu2 1s, 3sv
53 3 steps, 3
AA
Ile, Thr ATC, ACPi ATC⇔ (ACC→ACT) Ile⇔ (Thr→Thr) 2s, 3s
Thr, Asn ACC, AAC ACC→AAC Thr→Asn 2v
73 1 step, 2
AA
Gly, Ala GGN, GCG (GGN→GGG)→GCG (Gly→Gly) →Ala 2v, 3sv
79 5 steps, 5
AA
Glu, Thr GAA, ACPu GAA→AAA→(ACA→ACA) GAA→GCA→(ACA→ACG)
Glu→Lys→ (Thr→Thr) Glu→Ala→ (Thr→Thr)
1s, 2s, 3s 1s, 2s, 3s
TABLE 1 (Continued.)
This tree has 13 steps (12 altering amino acids, and only one altering a codon of Leucine), while the alternative tree proposed by PAUP has only 12 steps (10 altering amino acids, and two altering codons of Leucine). We consider that nonsynonymous amino acid substitutions are biologically more informative than synonomous amino acid substitutions.
The above example leads us to consider several ways in which to reduce the large amount of noise that tends to confound molecular analyses. Ambiguous alignments may be excluded from the data matrix, different weights may be attributed to characters with distinct complexities, transitions or transversions may be excluded from consideration, or third codon
positions may be ignored (Gatesy et al., 1993;
Simmons et al., 1994; Wägele & Rödding, 1998).
If there are no transversions in an analysis, there will occur no signal. On the other hand, transition substitutions will decrease the phylogenetic signal
(Swofford et al., 1996a).
Of the 306 base pairs present in the studied gene, only 19 codons were considered informative
in a phylogenetic context (autapomorphies excluded) (Table 1). Our method separates noise from signal in a phylogenetic analysis of sequence data, by hypothesizing explicit transformation series for each informative codon. In this sense, our sequence analysis is very similar to qualitative cladistic analyses of morphological characters, in which only those characters that can be successfully interpreted in a phylogenetic context are introduced into the analysis.
Analysis of homology of sequence data is thus seen to have the same logical basis as in studies of comparative morphology. To identify phylo-genetic signal beyond the threshold defined by chance similarities it is necessary to consider the information content of characters. Thus, even though positions of nucleotides within a sequence are not complex and have low information content (Wägele & Wetzel, 1994), they can still be profi-tably included in a qualitative cladistic analysis when the evaluation of their phylogenetic infor-mation content is attempted.
Seq. pos.
Sampled amino acids
Sampled codons
Transformation series (codons)
Transformation series (amino
acids)
Changes
82 4 steps, 4
AA
Leu, Met CTPu, TTA, ATA (CTPu→TTA)→ATA (Leu1→Leu2)→
Met 1v, 3s
Met, Thr ATA, ACA ATA→ACA Met→Thr 2s
90 4 steps, 3
AA
Ile, Thr AT(C,T), ACC AT(C,T)→ACC Ile→Thr 2s
Thr, Ala GC(A,C) ACC, ACC→(GCC→GCA) Thr→(Ala→Ala) 1s, 3v
Amino
acid PHE LEU LEU ILE MET VAL SER PRO THR ALA TYR HIS GLNASN LYS ASP GLU CYS TRP ARG SER GLY Codon UUY UURCUY CURAUY AUR GUYGURUCYUCRCCYCCR ACYACR GCY GCRUAY CAYCARAAYAARGAYGARUGY UGRCGYCGR AGYGGY GGR
Symbol A B C D E F G H I J K L M N O P Q R S T U V W X Y Z 1 2 3 4 Amino acid Codon PHE UUY 0 1 1 1 1 2 1 1 1 1 2 2 2 2 2 2 1 2 3 2 3 2 3 1 2 2 2 2 2 2 LEU UUR 1 0 1 1 2 1 1 1 1 1 2 2 2 2 2 2 2 3 2 3 2 3 2 2 1 2 2 2 2 2
CUY 1 2 0 0 1 2 1 1 2 2 1 1 2 2 2 2 2 1 2 2 3 2 3 2 3 1 1 2 2 2
LEU CUR 2 1 0 0 2 1 1 1 2 2 1 1 2 2 2 2 3 2 1 3 2 3 2 3 2 1 1 3 2 2
ILE AUY 1 2 1 1 0 1 1 1 2 2 2 2 1 1 2 2 2 2 3 1 2 2 3 2 3 2 2 1 2 2 MET AUR 2 1 1 1 2 0 2 2 2 2 2 2 1 1 2 2 3 3 2 2 1 3 2 3 2 2 2 2 2 2
GUY 1 2 1 1 1 2 0 0 2 2 2 2 2 2 1 1 2 2 3 2 3 1 2 2 3 2 2 2 1 1
VLA GUR 2 1 1 1 2 1 0 0 2 2 2 2 2 2 1 1 3 3 2 3 2 2 2 3 2 2 2 3 1 1
UCY 1 2 2 2 2 3 2 2 0 0 1 1 1 1 1 1 1 2 3 2 3 2 3 1 2 2 2 2 2 2
SER
UCR 2 1 2 2 3 2 2 2 0 0 1 1 1 1 1 1 2 3 2 3 2 3 2 2 1 2 2 3 2 2
CCY 2 3 1 1 2 3 2 2 1 1 0 0 1 1 1 1 2 1 2 2 3 2 3 2 3 1 1 2 2 2
PRO CCR 3 2 1 1 3 2 2 2 1 1 0 0 1 1 1 1 3 2 1 3 2 3 2 3 2 1 1 3 2 2
ACY 2 3 2 2 1 2 2 2 1 1 1 1 0 0 1 1 2 2 3 1 2 2 3 2 3 2 2 1 2 2
THR
ACR 3 2 2 2 2 1 2 2 1 1 1 1 0 0 1 1 3 3 2 2 1 3 2 3 2 2 2 2 2 2
GCY 2 3 2 2 2 3 2 2 1 1 1 1 1 1 0 0 2 2 3 2 3 1 2 2 3 2 2 2 1 1
ALA GCR 3 2 2 2 3 2 1 1 1 1 1 1 1 1 0 0 3 3 2 3 2 2 1 3 2 2 2 3 1 1
TYR UAY 1 2 2 2 2 3 2 2 1 1 2 2 2 2 2 2 0 1 2 1 2 1 2 1 2 2 2 2 2 2 HIS CAY 2 3 1 1 2 3 2 2 2 2 1 1 2 2 2 2 1 0 1 1 2 1 2 2 3 1 1 2 2 2 GLN CAR 3 2 1 1 3 2 2 2 2 2 1 1 2 2 2 2 2 1 0 2 1 2 1 3 2 1 1 3 2 2 ASN AAY 2 3 2 2 1 2 2 2 2 2 2 2 1 1 2 2 1 1 2 0 1 1 2 2 3 2 2 1 2 2 LYS AAR 3 2 2 2 2 1 2 2 2 2 2 2 1 1 2 2 2 2 1 1 0 2 1 3 2 2 2 2 2 2 ASP GAY 2 3 2 2 2 3 1 1 2 2 2 2 2 2 1 1 1 1 2 1 2 0 1 2 3 2 3 2 1 1 GLU GAR 3 2 2 2 3 2 1 1 2 2 2 2 2 2 1 1 2 2 1 2 1 1 0 3 2 2 2 3 2 2 CYS UGY 1 2 2 2 2 3 2 2 1 1 2 2 2 2 2 2 1 2 3 2 3 2 3 0 1 1 1 1 1 1 TRP UGR 2 1 2 2 3 2 2 2 1 1 2 2 2 2 2 2 2 3 2 3 2 3 2 1 0 1 1 2 1 1
CGY 2 3 1 1 2 3 2 2 2 2 1 1 2 2 2 2 2 1 2 2 3 2 3 1 2 0 0 1 1 1
ARG CGR 3 2 1 1 3 2 2 2 2 2 1 1 2 2 2 2 3 2 1 3 2 3 2 2 1 0 0 2 1 1
SER AGY 2 3 2 2 1 2 2 2 2 2 2 2 1 1 2 2 2 2 3 1 2 2 3 1 2 1 1 0 1 1
GGY 2 3 2 2 2 3 1 1 2 2 2 2 2 2 1 1 2 2 3 2 3 1 3 1 2 1 1 1 0 0
GLY GGR 3 2 2 2 3 2 1 1 2 2 2 2 2 2 1 1 3 3 2 3 2 2 2 2 1 1 1 2 0 0
APPENDIX 1
Asymmetric step matrix for non-synonymous nucleotide substitutions based on vertebrate mitochondrial genetic code.
APPENDIX 2
Matrix for studied species according to the adopted coding from the asymmetric step matrix (Appendix 1). See legend of Fig. 1 for full names of taxa.
P. o. latirostris A3IFDBMXJEDSEFM3AADPERQNOTEVBOANIGGREJ1VGLQ3YEF1TBR
P. o. olfersi A3IFDDMXJEDSEFM3AABPERQNOTEVBOANIGGREJ1VGLQ3YEFSTBR
P. nattereri A3IFBDMXJHDSEDM3AADPERQNOTEVDOANIGEREN1VGLQ3YEFSTCR
P. viridissima A3IFDBMXJQESEFM3BADPERQNOTETDPANIHEREJ1VGLQ3YEFSTCR
P. patagoniensis A3JFBDMXJEDSEFM3BADPERQNOTEVDOANIHGREN1VELQ3YEFSTBR
P. aestiva A3JCD3MXDEESEMN3DADPFRQNLVNOJOAIJGOREM1VGTQ3YFE1QBR
T. serra A3IFDDMXBEDSMDM4AABPERQNOTEVDOAJIEGREN1VGLQ3YEFSTCR
T. striaticeps A3IFDDMXBEDSMBM3AABPERQNOTEVBOAJIEEREJ1VEKQ3YEFSTDR
O. guibei A3IFCDIXJODSEFN4AADOERQNOTEVDOAJIHEREFZVGLX3YEBSTDR
X. neuwiedi A3JFBDMXBEDSMBN3AABPERQNOTEQBOAJIEEREN1VGKDYYFFSTCR
P. baroni A3IFDDMXJEDSEEM3AADPERQNOTETBOANIEGREN1VGLQ3YEFSTCR
N. fasciata A4IFBDMXJPDS?EN4AADPERQNOTETDOAJIEEREMZVHLQ4YEFSTMR
Th. errans A4IFDBMXJODSEEN4AADPERQNOTETDOAJIEERENZVHKQ4YEFSTMR
P. o. latirostris PM3PIFAAEXEQEREPZ4DQQ3IQDTUNGYFI4MMCDEMBFPNOAA4QGDL
P. o. olfersi PM3PIFAAEXEQEREPK4DQQOIQDTUNGYFI4MMCDEMBFPNOAA4QGDL
P. nattereri PM3PIFAAEXEQEREPZ4CQQ3IQDTUPHYNI4NMCDEMDFPNOAA4QGDL
P. viridissima PM3PIFAAEXEQEREPZ4CQQOIQCTUN3YBJ4MMDBEMBFPNOAA4QGDL
P. patagoniensis PM3PIFAAEXEQEREPZ4CQQ4IQDTUNGYFI4NMCDEOBFPNOAA4QGDK
P. aestiva OT3PIFAAEXDACRE313BQQ4JACADUMYTE3NEDDCPMFONPAF3QHDL
T. serra PM3PIFAAEXEQEREPZ4CQQ3IQDTUNHYFI3OMCBEMBFPMOAA3QGDL
T. striaticeps PM3PIFAAEXEQEREPZ4CQQ3IQDTUNHYNI4MMCBGMBFPMOAA3QGDL
O. guibei PM3PIOAAEXEQMREPZ4CQQ4IQDTUNGYDJ4MMCDEECFPNOAA4QGCL
X. neuwiedi PE4OJFAAEXEQEREO?3CEQ3?QDTULGYBJ3E2DDEECFOMOAA4QECL
P. baroni PM3PIFAAEXEQEREPZYCQQ3IQDTUNGYFI4M?CBEEDFPNOAA4QODL
N. fasciata PE3PIEAAEXEQEREP14CQQ3IQCTUWHYDI4MMCBEMDFONOAA3QG??
APPENDIX 3
Aligned sequences of nucleotides from cytochrome b for the studied species of snakes. See legend of Fig. 1 for full names of taxa.
1 2 3 4 5 6 123 456 789 012 345 678 901 234 567 890 123 456 789 012 345 678 901 234 567 890
P o. latirostris TTT GGC TCC ATA CTA TTA ACC TGC TCA ATC CTA CAA ATC ATA ACC GGC TTC TTC CTA GCA
P o. olfersi ... ... ... ... ... C.. ... ... ... ... ... ... ... ... ... ... ... ... T.. ...
P. nattereri ..C ... ... ... T.. C.. ... ... ... G.A ... ... ... C.. ... ... ... ... ... ...
P. viridissima ..C ... ... ... ... ... ... ..T ... TAT A.T ... ... ... ... ... ..A ... ... ...
P. patagoniensis ... ..T ..A ... T.. C.. ... ... ... ... ... ... ... ... ... ... ..A ... ..G ...
P aestiva ... ... ..A C.C ... GGT ... ... CT. ... A.T ... ..T .CC ..A ... C.A ... ..G ...
T serra ... ... ... ... ... C.. ... ... .T. ... ... ... .C. C.. ... ..G ..T ... T.. ...
T. striaticeps ... ..T ... ... ... C.. ... ... .T. ..T ... ... .C. T.. ... ... ... ... T.. ...
O. guibei ..C ... ... ..G ..C C.. T.. ... ... GC. ... ... ... ... ..A ..G ... ... ... ..C
X. neuwiedi ... ... ..A ..G T.. C.. ... ..T .T. ... ... ... .C. T.. ..A ... ... ..T T.. ...
P. baroni ..C ... ... ... ... C.. ... ... ..G ... ... ... ... ..C ... ... ... ... ..G ...
N. fasciata ... ..G ..T ..G T.. C.. ... ..T ... GCA ... ... ?.. ..T ..A ..A ... ..T ... ...
Th. errans ... ..A ..T ... ... ... ... ... ... GCT ... ... ..T ..T ..A ..G ... ..T ... ...
1 111 1 7 8 9 9 0 001 2 123 456 789 012 345 678 901 234 567 890 123 456 789 012 345 678 901 234 567 890
P o. latirostris ATC CAC TAC ACA GCT AAT ATC GAC TTA GCT TTC ACA TCC GTT GTC CAC ATC TCA CGA GAC
P o. olfersi ... ... ... ... ... ..C ... ... ... ... ... ... ... ... ... ... ... ... ... ...
P. nattereri ..T ... ..T ... ..C ..C ... ..T C.G ... ..T ... ... ..C A.T ... ..T A.. ... ...
P. viridissima ..T ... ... ... ..C ..C ..T A.. C.G ..A ..T ... ... ..A A.T ..T ... ... ... ...
P. patagoniensis ... ... ... ... ..C ..C ... ... C.. ..C ... ... ... ..A ... ... ... A.. ... ...
P aestiva ..A ... ..T ... C.A G.C .CA .C. .C. ... ... T.C ..A ..C .C. ... ..T A.C ... ...
T serra ..T ... ..T ... ..C ..C ..T ... C.. ..C ..T T.. ..T A.. ..T ... ... A.. ... ..T
T. striaticeps ..T ... ... ... ..C ..C ..T ... ... ..C ..T T.. ... A.. A.T ... ... ... ... ..T
O. guibei ... ... ..T ... ... ..C ..T ... C.G ..C ..T T.. ... ..A A.T ... ..T AT. ..T ...
X. neuwiedi ... ... ..T ... ... ... ... T.. ... ... ... T.. ..T A.. A.. ... ... A.. ... ...
P. baroni ... ... ..T ... ..C ..C ... A.. ... ... ... ... ..T A.. ..T ... ... A.. ... ...
N. fasciata ... ... ... ... ... ..C ..T A.. C.. ..C ... T.. ..T A.C A.. ... ... A.C ..C ...
Th. errans ... ... ..T ... ... ..C ..T A.. C.. ..C ..T T.. ..T A.C A.T ... ..T A.. ..T ...
1 1 1 1 1 1 1 2 3 4 5 6 7 8 123 456 789 012 345 678 901 234 567 890 123 456 789 012 345 678 901 234 567 890
P o. latirostris GTT CCA TAC GGC TGA ATC ATA CGA AAT TTA CAT GCG ACC GGC GCA TCC ATA TTT TTT ATC
P o. olfersi ... ... ... ... ... ... ... .A. ... ... ... ..A ... ... ... ... ... ... ... ...
P. nattereri ..C ... ... ... ... ..T ... .A. ... C.T ... ..A ... ... ... ... ... ..C ..C ...
P. viridissima ..C ... ... ... ... ... ... .A. ... C.T ... ..A ... ... ... ..T ... ..C ..C ...
P. patagoniensis A.C ... ... ... ... ... ... .A. ... ... ... ..A ... ... ... ..T ..G ..C ... ...
P aestiva ... AAC ... ... ... ..G ..C ... T.C ... ... ..T .A. ... ... ... ... ..C ... ...
T serra ..C ... ... ... ... ... ... .A. ..C C.T ... ..A ... ... ... ..T ..G ... ... ...
T. striaticeps A.C ..T ... ... ... ..T ... .A. ..C C.. ... ..A ..T ... ... ..T ... ... ... ...
O. guibei ..C ..G .G. ..T ... ..T T.. .A. ..C C.G ..C ..A ... ..T ... ... GCC ..C ..C ...
X. neuwiedi ..C ..C CTA T.G ... ..A ... .A. ..C C.C ... ..A .T. ..A ..C ..A ... ... ... TAT
P. baroni ... ... ... ... ... ..T ... .A. ..C C.T ... ..A ... ... ... ..T ... ..C ... ..T
N. fasciata ..G ... ..T ..A ... ..T ... .A. ..C ACC ... ..A .T. ... ... ..T ..T ... ... ..T
APPENDIX 3 (Continued.)
1 1 2 2 2 2 2 8 9 0 1 2 3 4 123 456 789 012 345 678 901 234 567 890 123 456 789 012 345 678 901 234 567 890
P o. latirostris TGC ATC TAC ATC CAC ATC GCA CGC GGA CTA TAC TAC GGC TCC TAC CTA AAC AAA ACA GTC
P o. olfersi ... ... ... ... ... ... ... .C. ... ... ... ... .C. ..T ... ... ... ... ... ...
P. nattereri ..T ... ... ... ... ..T ... ..T ..G ..C ..T ... ..T ... ... ... ... ..G G.. ..A
P. viridissima ... ..T ... ..T ... ... ... ..T ... ..C ... ... .C. ..T ..T ..T ... ... ... .G.
P. patagoniensis ... ... ... ... ... ... ... ... ... ..C ... ... ..A ..T ... ... ... ... ..G ...
P aestiva ... C.A .TT C.. ... ... .GC ..A ..C T.. ..T ... ..G ..G .T. ..T TTT CTG .AG ACT
T serra ... ..T ..T ..T ... ... ... ..T ..G ..T ... ... ... ... ... ... ... ... ... ..G
T. striaticeps ..T ..T ..T ... ... ... ... ..T ... ..T ... ..T ... ... ... ... ... ..G ... ..G
O. guibei ... ... ... .C. ..T ... ... ..T ... ..C ... ... ..A ... ... ... ..T ... ... ...
X. neuwiedi CTG TAT .TA CAT TCA CAT TGC ... ..C ..C AT. ... ... ??? ... ... ... ... C.. ...
P. baroni ... ... ... ... ... ... ... ..T T.. ..C ... ... ... ... ... ... ... ... ... ...
N. fasciata ... ... ..T ..T ... ..T ... ..A ... ..T ..T ... ... ... ..T ..T ... ... GA. ..A
Th. errans ..T ..T ... ..T ... ..T ... ..G ... ..T ... ... ... ... ..T ... ... ... GA. ..G
2 2 2 2 2 3 5 6 7 8 9 0 123 456 789 012 345 678 901 234 567 890 123 456 789 012 345 678 901 234 567 890
P o. latirostris TGA ATA TCT GGA ACT ACC CTC CTA ATT ACC TTA ATG GCA ACA GCC TTC TTC GGA TAC GTC
P o. olfersi ... ... ..C ... ... ... ... ... ... ... ... ... ... ... ... ... ... ... ... ...
P. nattereri ..G .C. ..C ... ..G ... ... ... ... ... C.G ..A ... ... ... ... ..T ..G ..T ...
P. viridissima ... T.. ..A ... ..C ... ..A T.. ... ... ... ..A ... ... ... ... ..T ... ... ...
P. patagoniensis ... ... ... ... ..A ... ... ... ..C G.. ... ..A ... ... ... ... ... ... ... ...
P aestiva ... .AC ATC ..T ..A .T. ..A ... C.. G.A ACC ..A ..C ... ..A ..T A.A ..T ... ..A
T serra ..G ... ..C ..C G.C ... ... T.. ... ... ... ..A ... ..C ... ..T ... ..C ..T ..T
T. striaticeps ... .C. ..C ... ..C ... ..T T.. G.. ... ... ..A ... ..C ... ..T ..T ..C ..T ..T
O. guibei ... C.G ..A ... ..C ... ... ... ... .TT C.C ..A ... ... ..T ... ... ... ... ...
X. neuwiedi ... T.. ..A ..C .T. .G. ..A ... ... .TT C.C ..A ..C ..C ..T ... ... ..G ..T A.T
P. baroni ... ..G ... ... ..C ?TT ... T.. ... .TT C.. ..A ... ... ... ... ... ... ..T .CT
N. fasciata ... C.. ..C ... ..C ... ... T.. ..C ... C.. ..A ..C ... ... ... ..T ..C ... ...
Th. errans ... C.. ..C ... ..C ... ..T T.. ... .T. C.. ..A ..C ... ... ... ... ..C ... ...
3 0 123 456
P o. latirostris CTA CCA
P o. olfersi ... ...
P. nattereri ... ...
P. viridissima ... ...
P. patagoniensis ..G ..C
P aestiva ... ...
T serra ... ...
T. striaticeps ... ...
O. guibei ..T ...
X. neuwiedi ..T ...
P. baroni ... ...
N. fasciata .?? ???
,
64
(3A
):
383-398, 2004
CHRISTOFFERSEN, M. L., ARAÚJO, M. E. and MOREIRA, M. A. M.
APPENDIX 4
Aligned sequences of amino acids from cytochrome b for the studied species of snakes. See legend of Fig. 1 for full names of taxa.
1 0 1 2 L P . . . . . . . . . . . . . . . . . . . . ? ? . . 1 0
1 2 3 4 5 6 7 8 9 0
L M A T A F F G Y V
. . . .
. . . .
. . . .
. . . .
T . . . M . . .
. . . .
. . . .
. . . .
. . . I
. . . A
. . . .
. . . .
9
1 2 3 4 5 6 7 8 9 0
W M S C T T L L I T
. . . .
. T . . . .
. L . . . .
. . . A
. N I . . L A . . .
. . . . A . . . . .
. T . . . V .
L . . . I
L . . I S . . . . I
. . . ? . . . I
. L . . . .
. L . . . I
8
1 2 3 4 5 6 7 8 9 0
Y Y G S Y L N K T V
. . A . . . .
. . . A .
. . A . . . . G
. . . .
. . . . F . F L K T
. . . .
. . . .
. . . .
I . . ? . . . P
. . . .
. . . E .
. . . E .
7
1 2 3 4 5 6 7 8 9 0
C I Y I H I A R G L
. . . P . .
. . . .
. . . .
. . . .
. LF P . . G . . .
. . . .
. . . .
. . . T . . . .
L Y L H S H C . . .
. . . W .
. . . .
. . . .
6
1 2 3 4 5 6 7 8 9 0
H A T G A S M F F I
. . . .
. . . .
. . . .
. . . .
. . N . . . .
. . . .
. . . .
. . . A . . .
. . I . . . Y
. . . .
. . I . . . I . . .
. . I . . . .
5
1 2 3 4 5 6 7 8 9 0
V P Y G W I M R N L
. . . . . . . Q . .
. . . . . . . Q . .
. . . . . . . Q . .
I . . . . . . Q . .
. N . . . M I . Y .
. . . . . . . Q . .
I . . . . . . Q . .
. . C . . . L Q . .
. . L W . M . Q . .
. . . . . . . Q . .
. . . . . . . Q . T
. . . . . . . Q . T
4
1 2 3 4 5 6 7 8 9 0
F T S V V H T S R D
. . . .
. . . . I . . T . .
. . . . I . . . . .
. . . T
. S . . A . . T . .
. S . I . . . T . .
. S . I I . . . . .
. S . . I . . M . .
. S . I I . . T . .
. . . I . . . T . .
. S . I I . . T . .
. S . I I . . T . .
3
1 2 3 4 5 6 7 8 9 0
I H Y T A N I D D A
. . . .
. . . .
. . . N . .
. . . .
M . . . P D T A S .
. . . .
. . . .
. . . .
. . . Y . .
. . . N . .
. . . N . .
. . . N . .
2
1 2 3 4 5 6 7 8 9 0
L C I M T G F F L A
. . . .
. . . L . . . .
I . . . L . . .
. . . L . . .
I . . T . . L . . .
. . T L . . . .
. . T L . . . .
. . . .
. . T L . . . .
. . . I . . . . . .
. . ? I . . . .
. . . I . . . .
1
1 2 3 4 5 6 7 8 9 0
F G S M L L T C S I
. . . .
. . . . V
. . . . Y
. . . .
. . . L . G . . L
. . . L
. . . L
. . . S . . A
. . . L .
. . . .
. . . . A
. . . . A
P. o. olfersii
Acknowledgements — We are grateful for the help of Antônio
Mateo Solé-Cava, Ivan Sazima, and Hector Seuanez for the supervision of this work when it was part of a Ph. D. thesis by the second author. Douglas Zeppelini read and provided suggestions on one version of the manuscript. Financial support was provided by Coordenação de Aperfeiçoamento de Pessoal de Nível Superior (CAPES) and Conselho Nacional de Desen-volvimento Científico e Tecnológico (CNPq).
REFERENCES
ABOUHEIF, E., ZARDOYA, R. & MEYER, A., 1998, Limitations of metazoan 18S rRNA sequence data: Implications for reconstructing a phylogeny of the animal kingdom and inferring the reality of the Cambrian explosion.
J. Mol. Evol., 47: 394-405.
BREMER, K., 1988, The limits of amino acid sequence data in angiosperm phylogenetic reconstruction. Evolution, 42:
795-803.
BROWN, W. M., GEORGE, M. Jr. & WILSON, A. C., 1979, Rapid evolution of animal mitochondrial DNA. Proc. Natl. Acad. Sci. USA, 76: 1967-1971.
DE QUEIROZ, A. & LAWSON, R., 1994, Phylogenetic relationships of the garter snakes based on DNA sequence and allozyme variation. Biol. J. Linn. Soc., 53: 209-229. DREYER, H. & WÄGELE, J. W., 2001, Parasites of crustaceans
(Isopoda: Bopyridae) evolved from fish parasites; molecular and morphological evidence. Zoology, 103: 157-178.
FARRIS, J. S., 1969, A successive approximations approach to character weighting. Syst. Zool., 18: 374-385.
FELSENSTEIN, J., 1978, The number of evolutionary trees.
Syst. Zool., 27: 27-33.
FELSENSTEIN, J., 1988, Phylogenies from molecular sequences: inference and reliability. Annu. Rev. Gen., 22: 521-565. FERRAREZZI, H., 1994, Uma sinopse dos gêneros e classificação
das Serpentes (Squamata): II. Family Colubridae, pp. 81-91. In: L. B. Nascimento, A. Tristão & G. A. Cotta (eds.), Herpetologia do Brasil 1. Fundação Biodiversitas e Fundação Ezequiel Dias, Belo Horizonte, Minas Gerais.
FITCH, W. M., 1971, Toward defining the course of evolution: minimum change for a specific tree topology. Syst. Zool., 20: 406-416.
FITCH, W. M., & MARGOLIASH, E., 1967, Construction of phylogenetic trees. Science, 155: 279-284.
GATESY, J., DESALLE, R. & WHEELER, W., 1993, Alignment-ambiguous nucleotide sites and the exclusion of systematic data. Mol. Phylogenet. Evol., 2: 152-157.
GIRIBET, G. & WHEELER, W. C., 1999, On gaps. Mol. Phylogenet. Evol., 13: 132-143.
GOLDMAN, N. & YANG, Z., 1994, A codon-based model of nucleotide substitution for protein-coding DNA sequences.
Mol. Biol. Evol., 11: 725-736.
IRWIN, D. M., KOCHER, T. D. & WILSON, A. C., 1991, Evolution of the cytochrome b gene of mammals. J. Mol. Evol., 32: 128-144.
KOCHER, T. D., THOMAS, W. K., MEYER, A., EDWARDS, S. V., PAABO, S., VILLABLANCA, F. X. & WILSON, A. C., 1989, Dynamics of mitochondrial DNA evolution in animals: amplification and sequencing with conserved primers. Proc. Natl. Acad. Sci. USA, 86: 6196-6200. LAKE, J. A., 1991, The order of sequence alignment can bias
the selection of tree topology. Mol. Biol. Evol., 8: 378-385. LECOINTRE, G., PHILIPPE, H., VAN LÉ, H. L. & LE GUYADER, H., 1993, Species sampling has a major impact on phylogenetic inference. Mol. Phylogenet. Evol., 2:
205-224.
LI, W.-H.,1997, Molecular evolution. Sinauer, Sunderland, Massachusetts.
MALEY, L. E. & MARSHALL, C. R., 1998, The coming of age of molecular systematics. Science, 279: 505-506.
McHUGH, D., 1998, Deciphering metazoan phylogeny: the need for additional molecular data. Amer. Zool., 38: 859-866.
MOORE, G. W., BARNABAS, J. & GOODMAN, M., 1973, A method for constructing maximum parsimony ancestral amino acid sequences on a given network. J. Theor. Biol.,
38: 459-485.
MOORE, G. W., GOODMAN, M. & CALLAHAN, C., 1976, Stochastic versus augmented maximum parsimony method for estimating superimposed mutations in the divergent evolution of protein sequences. Methods tested on cytochrome c amino acid sequences. J. Mol. Biol., 105: 15-37. MULLIS, K., FALOONA, F., SCHARF, S., SAKAI, R., HORN,
G. & ERLICH, H., 1986, Specific enzymatic amplification of DNA in vitro: the polymerase chain reaction. Cold Spring Harbor Symp. Quant. Biol., 51: 263-273.
NAYLOR, G. J. & BROWN, W. M., 1998, Amphioxus mitochondrial DNA, chordate phylogeny, and the limits of inference based on comparisons of sequences. Syst. Biol., 47: 61-76.
NOWAK, R., 1994. Mining treasures from "junk DNA". Science, 363: 608-610.
OTTO, S. P., CUMMINGS, M. P. & WAKELEY, J., 1996, Inferring phylogenies from DNA sequence data: the effects of sampling, pp. 103-115. In: P. H. Harvey, A. J. L. Brown,
J. M. Smith & S. Nee (eds.), New uses for new phylogenies. Oxford Univ. Press, Oxford.
PATTERSON, C., 1988, Homology in classical and molecular biology. Mol. Biol. Evol., 5: 603-625.
PHILIPPE, H., CHENUIL, A. & ADOUTTE, A., 1994, Can the Cambrian explosion be inferred through molecular phylogeny? Development, Suppl.: 15-25.
REMANE, A., 1961, Gedanken zum problem: homologie und analogie, praeadaptation und parallelität. Zool. Anz., 166:
447-465.
SIMMONS, C., FRATI, F., BECKENBACH, A., CRESPI, B., LIU, H. & FLOOK, P., 1994, Evolution, weighting, and phylogenetic utility of mitochondrial gene sequences and a compilation of conserved polymerase chain reaction primers.
SIMMONS, M. P., 2000, A fundamental problem with amino-acid-sequence characters for phylogenetic analyses.
Cladistics, 16: 274-282.
SWOFFORD, D. L., 1998, PAUP*: Phylogenetic analysis using parsimony (*and other methods), version 4.0. Sinauer, Sunderland, Massachusetts.
SWOFFORD, D. L., OLSEN, G. J., WADDELL, P. T. & HILLIS, D. M., 1996a, Phylogenetic inference, pp. 441-501. In: D.
M. Hillis, M. Craig & Mable, B. K. (eds.), Molecular systematics. 2nd edition, Sinauer, Sunderland, Massachusetts.
SWOFFORD, D. L., THORNE, J. L., FELSENSTEIN, J. & WIEGMANN, B. M., 1996b, The topology-dependent permutation test for monophyly does not test for monophyly.
Syst. Biol., 45: 575-579.
WÄGELE, J. W., 1994, Review of methodological problems of 'computer cladistics' exemplified with a case study on isopod phylogeny (Crustacea: Isopoda). Z. Zool. Syst. Evol.-forsch.,
32: 81-107.
WÄGELE, J. W., 1999, Major sources of errors in phylogenetic systematics. Zool. Anz., 238: 329-337.
WÄGELE, J. W. & RÖDDING, F., 1998, A priori estimation of phylogenetic information conserved in aligned sequences.
Mol. Phylogen. Evol., 9: 358-365.
WÄGELE, J. W. & STANJEK, G., 1995, Arthropod phylogeny inferred from partial 12S rRNA revisited: monophyly of the Tracheata depends on sequence alignment. J. Zool. Evol. Res., 33: 75-80.
WÄGELE, J. W. & WETZEL, R., 1994, Nucleic acid sequence data are not per se reliable for inference of phylogenies. J. Nat. Hist., 28: 749-761.
WHEELER, W. C., 1990, Nucleic acid sequence phylogeny and random outgroups. Cladistics, 6: 363-367.