and the Amazonian várzea ecosystem
Hrbek, T.
a,b*, Crossa, M.
cand Farias, IP.
aaLaboratório de Evolução e Genética Animal, ICB, Universidade Federal do Amazonas,
Av. General Rodrigo Otavio Jordao Ramos 3000, CEP 69077-000, Manaus, AM, Brazil Manaus, AM, Brazil bBiology Department, University of Puerto Rico, Rio Piedras, San Juan, PR, Puerto Rico
cInstituto de Pesquisa Ambiental da Amazônia (IPAM), Santarém, Pará, Brazil *e-mail: [email protected]
Received July 3, 2007 – Accepted September 12, 2007 – Distributed December 1, 2007 (With 3 figures)
Abstract
In the present study we report a spatial autocorrelation analysis of molecular data obtained for Arapaima gigas, and the implication of this study for conservation and management. Arapaima is an important, but critically over-exploited gi-ant food fish of the Amazonian várzea. Analysis of 14 variable microsatellite loci and 2,347 bp of mtDNA from 126 in-dividuals sampled in seven localities within the Amazon basin suggests that Arapaima forms a continuous population with extensive genetic exchange among localities. Weak effect of isolation-by-distance is observed in microsatellite data, but not in mtDNA data. Spatial autocorrelation analysis of genetic and geographic data suggests that genetic exchange is significantly restricted at distances greater than 2,500 km. We recommend implementing a source-sink metapopulation management and conservation model by proposing replicate high quality várzea reserves in the upper, central, and lower Amazon basin. This conservation strategy would: 1) preserve all of the current genetic diversity of Arapaima; 2) create a set of reserves to supply immigrants for locally depleted populations; 3) preserve core várzea areas in the Amazon basin on which many other species depend. We stress that conservation strategies should not only preserve current genetic diversity, but also the evolutionary processes which have generated the observed patterns.
Keywords: pirarucu, gene flow, reserves, várzea, autocorrelation, microsatellites.
Estratégias de conservação para
Arapaima gigas
(Schinz, 1822)
e para o ecossistema Amazônico de várzea
Resumo
No presente estudo, é descrita uma análise de autocorrelação espacial de dados moleculares obtidos para Arapaima gigas e a implicação deste estudo para sua conservação e manejo. Arapaima é uma espécie de peixe gigante da várzea Amazônica de grande importância econômica, e criticamente sobre-explorada. A análise de 14 locos microssatélites e de 2.347 pb do DNAmt de 126 indivíduos amostrados em sete localidades na bacia Amazônica sugere que Arapaima forma uma população contínua com grande fluxo genético entre localidades. Um pequeno efeito de isolamento por distância é observado através dos dados de microssatélites, mas não através dos dados de DNAmt. A análise de au-tocorrelação espacial de dados genéticos e geográficos sugere que o fluxo gênico é significativamente restrito em distâncias maiores que 2.500 km. É recomendada a implementação de um modelo de manejo e conservação de meta-população no padrão doador-receptor, replicando as reservas de várzea na bacia Amazônica superior, central e inferior. Esta estratégia de conservação iria: 1) preservar toda a atual diversidade genética da Arapaima; 2) criar um conjunto de reservas para fornecer imigrantes para populações locais reduzidas; 3) preservar áreas centrais de várzea na bacia Amazônica das quais diversas outras espécies dependem. Estratégias de conservação não deveriam somente preservar a atual diversidade genética, mas também os processos evolutivos que têm gerado os padrões observados.
Palavras-chave: pirarucu, fluxo gênico, reservas, várzea, autocorrelação, microssatélites.
1. Introduction
Arapaima gigas is one of the largest freshwater fishes of South America, attaining up to three meters in length and weighing over 200 kg (Saint-Paul, 1986; Nelson, 1994). Arapaima gigas is the only member of its genus, and is the
ba-sin of Guyana (Lüling, 1964). Fossil record also indicates thatArapaima was present in the Magdalena River basin (Lundberg and Chernoff, 1992).
Historically Arapaima appears to have formed an important portion of the diet of Amerindians living in the Amazon River floodplain as evidenced from middens in the Monte Alegre, PA region (Roosevelt et al., 1996). Significant commercialization of Arapaima began in the late 18th century when salted and dried Arapaima began to be marketed as a substitute for bacalhau, the salted and dried cod (Gadus morhua). Arapaima was harvested, salt-ed and drisalt-ed, and then exportsalt-ed out of processing centers in Manaus, Santarém and Belém (Brazil). The commercial importance of Arapaima can be appreciated in the descrip-tions of Veríssimo (1895) who mendescrip-tions that between the years 1885 and 1893, 11,540 tons of the dry and salted form of Arapaima were sold in Belém (1,282 t/year). Menezes (1951) cites that between 1918 and 1924, 6,775 tons of pirarucu (968 t/year) were landed in the State of Amazonas, and between 1919 and 1921, 5,729 tons (1,920 t/year) were landed in Belém alone. In spite of an apparent extensive exploitation, Arapaima appears to have been very abundant near main Amazonian cities and cent-ers of export of bacalhau until the early 1960’s (Crossa and Petrere Jr., 1999). However, by the late 1970’s Arapaima became commercially extinct near larger Amazonian cities (Goulding, 1979, 1980; Bayley and Petrere Jr., 1989). All commercial fishing was banned in early 2001, but illegal fishery continues to this day. However, in 1999 limited ex-ploitation of Arapaima was allowed within the Mamirauá Sustainable Biological Reserve, and shortly thereafter oth-er regions in the Amazonas State woth-ere authorized for a lim-ited and sustainable exploitation of their Arapaima stock.
While many of these reserves and community man-aged regions have been able to locally preserve Arapaima and some areas have seen increases in census numbers (e.g. Queiroz, 1999; Crossa, 2003; Crossa and Del Aguila Chaves, 2005), the larger problem of long-term preserva-tion of a global scale still exists. To address the issue of long-term preservation, and specifically to answer how many reserves at what geographic scale are needed to maintain the current genetic diversity of Arapaima gigas within the Amazon basin, we use a spatial autocorrelation analysis. Spatial autocorrelation analysis can be applied to samples obtained from continuously or discretely distrib-uted populations, describing both actual genetic variation and the dynamics of evolutionary processes. It summarizes the spatial distribution of genetic variation and is therefore useful for delimiting geographic regions at which similar-ity between samples is high or low. Distances at which samples become significantly dissimilar delimit geneti-cally differentiated regions and biologigeneti-cally independent population even in continuously distributed species.
2. Material and Methods
2.1. Sampling design and microsatellite genotyping Individuals of Arapaima gigas were sampled from the extremes as well as central areas of its natural geographic
distribution (Figure 1); sampled locations included Iquitos/ Pacaya-Saimiria (N = 16), Leticia (N = 22), Mamirauá (N = 33), Manaus/Careiro (N = 13), Santarém/São Miguel (N = 15), Macapá (N = 14), and Marabá/Tucurui (N = 13). Tissue samples were preserved in 95% ethanol, and stored in a cool place till delivered to a laboratory. The total ge-nomic DNA was purified from the ethanol-reserved tis-sues using a standard Proteinase K/SDS dissolution, fol-lowed by phenol and chloroform extraction, and 5M NaCl plus 70% ethanol precipitation (Sambrook et al., 1989).
A total of 126 individuals sampled from seven popu-lations were typed for 14 polymorphic microsatellite loci (Farias et al., 2003); the forward primers were la-beled with the fluorescent dyes 6-FAM, HEX or TET. Polymerase Chain Reactions (PCRs) were performed in 10 µL reaction volumes containing 5.5 µL of ddH2O, 1.0 µL of 10x Buffer (100 mM Tris-HCl, 500 mM KCl,
15 mM MgCl2), 2.0 µL of primer mix (0.2 MM each for-ward and reverse primer), 0.8 µL of dNTP mix (200 MM each dNTP), 0.2 U of Sigma RedTaq® DNA Polymerase, and about 5 ng of DNA. PCRs were run on a Perkin Elmer GeneAmp PCR 9700 thermocycler. An initial denaturation step (94 ºC, 2 minutes) was followed by 35 cycles of 10 seconds at 94 ºC, 10 seconds at the lo-cus specific annealing temperature (see Table 1 in Farias et al., 2003), 30 seconds at 72 ºC, and a final extension step for 60 minutes at 72 ºC. PCR products generated with labeled primers were visualized on a Perkin Elmer ABI 3100 Genetic Analyzer. Allele sizes were scored against an internal GeneScan-500 (ROX) size standard. Individuals were genotyped using the GeneScan Analysis 3.7 and Genotyper 3.7 software from Perkin Elmer.
Mitochondrial gene sequence data were taken from Hrbek et al. (2005). Briefly, the authors PCR amplified the complete NADH dehydrogenase subunit 1 gene and its 5’ end flanking tRNA Leucine and the 3’ end of the 16S rRNA, and an ATPase segment which included the 3’ end of Cytochrome Oxidase subunit 2, tRNA Lysine, ATPase subunit 6, ATPase subunit 8, and the 5’ end of the Cytochrome Oxidase subunit 3. PCR reactions were puri-fied with Qiagen spin-columns, cycle sequencing reactions followed standard Perkin Elmer Big Dye sequencing pro-tocol for double-stranded cycle sequencing reactions, and resulting cycle sequencing product was resolved on an ABI 3100 automatic DNA sequencer. Electrophoregrams were aligned and edited in the program BioEdit (Hall, 1999).
2.2. Data analysis
To investigate genetic connectivity among our sam-pling localities, we used a multivariate correlogram (Mantel, 1967) to test for an association between genetic and geographic distances of samples. The Mantel’s Z statistic (Smouse et al., 1986) is given as
Z = ¤¤NijWij (1)
80° W 75° W 70° W 65° W 60° W 55° W 50° W 45° W 40° W 10° N
5° N
0°
5° S
10° S
15° S
20° S
Japurá Içã
Napo
Iquitos Letícia
Juruá
SolimõesMamirauá
Purus
Madeira
ManausAmazonasSantarém
Macapá
Marabá
Araguaia Tocantins
Tapajós
Xingú
Ucayali Marañon
0 200 400 Km
Figure 1.Distribution map and sampling localities of Arapaima gigas in the Amazon River basin. Area in grey represents the most heavily exploited region of the várzea and of Arapaima gigas stocks. Names in bold are major rivers.
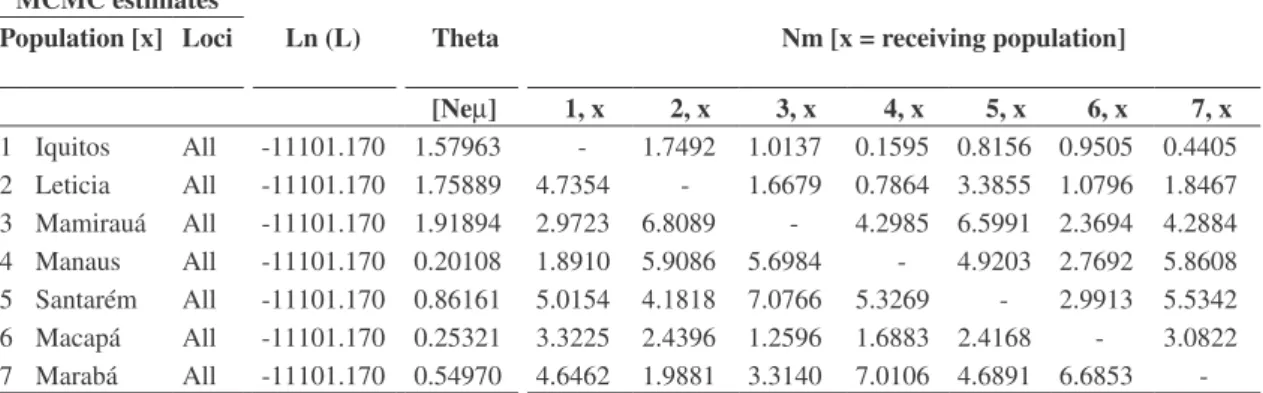
Table 1.MIGRATE analysis showing pair-wise estimates of gene flow. Populations can have different number of immigrating and emigrating individuals. (MCMC = Monte Carlo Markov Chain (a resampling strategy); Loci = number of loci analyzed (all = 14); Ln(L) = natural log of the likelihood of estimated parameters; Theta = population genetic parameter defined as NeM (effective population size times mutation rate); Nm = effective population size times migration rate)
MCMC estimates
Population [x] Loci Ln (L) Theta Nm [x = receiving population]
[NeM] 1, x 2, x 3, x 4, x 5, x 6, x 7, x
1 Iquitos All -11101.170 1.57963 - 1.7492 1.0137 0.1595 0.8156 0.9505 0.4405
2 Leticia All -11101.170 1.75889 4.7354 - 1.6679 0.7864 3.3855 1.0796 1.8467
3 Mamirauá All -11101.170 1.91894 2.9723 6.8089 - 4.2985 6.5991 2.3694 4.2884
4 Manaus All -11101.170 0.20108 1.8910 5.9086 5.6984 - 4.9203 2.7692 5.8608
5 Santarém All -11101.170 0.86161 5.0154 4.1818 7.0766 5.3269 - 2.9913 5.5342
6 Macapá All -11101.170 0.25321 3.3225 2.4396 1.2596 1.6883 2.4168 - 3.0822
7 Marabá All -11101.170 0.54970 4.6462 1.9881 3.3140 7.0106 4.6891 6.6853
-in a correlation coefficient. Connectivity is coded as 0 if geographic distance between sampling localities is within a given distance-class interval, otherwise it is coded as 1. Distance-class intervals were delimit-ed at increments of 500 km. The significance of the Z statistic is tested via the non-parametric bootstrap by randomly permuting the rows and columns of one of the matrices and repeatedly calculating the Z val-ues (Manly, 2006). The proportion of random valval-ues exceeding the observed Z value yields a Type I error
Geographic distances between localities were cal-culated in kilometers as shortest river-distance paths. Mitochondrial DNA genetic distances between sampling
localities were calculated &STwhich are analogues of
Cockerham and Weir’s FFST estimator (Cockerham and
Weir, 1993). Two generalized genetic distance metrics have been developed specially for microsatellites, the
RST(Slatkin, 1995), and the classicFFST(Wright, 1969).
TheRST uses the variance in repeat numbers (VRN) and
is in accordance with the stepwise mutation model. The
FST
F distance is based on the variance in allele
frequen-cies (VAF), and is compatible with the infinite alleles
mutation model. In the present work, the population dif-ff
ferentiation was analyzed using Wright’sFFST rather than
Slatkins’sRSTbecauseFFSTT-based estimates of differentia
-tion are considered better thanRSTT-based estimates when
less than 20 loci are analyzed (Gaggiotti et al., 1999). Additionally, microsatellite distances based on VAF are consistently more highly correlated to mtDNA genetic distances (Richard and Thorpe, 2001), and thus these two types of analyses are more readily comparable.
Among-locality gene flow was estimated from
the parameter Nm using the maximum-likelihood and
Bayesian inference methods implemented in the program MIGRATE (Beerli and Felsenstein, 1999; Beerli, 2006). MIGRATE default search strategy values were used, ex-cept that we ran 20 short chains and five long chains with moderate levels of heating.
3. Results
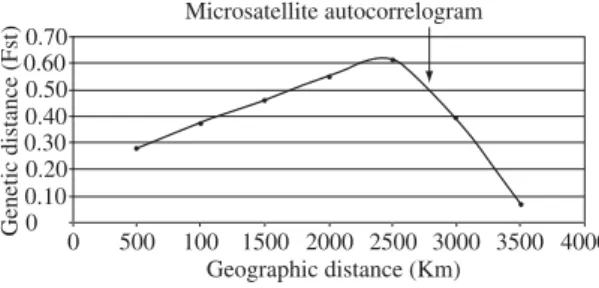
Based on the analysis of 126 individuals from seven geographic localities spanning the Amazon basin, we find a significant association of geographic and microsatellite genetic distances (Mantel test r = 0.619, P = 0.012); how-ever, there is no association of geographic and mtDNA genetic distances (Mantel test r = –0.042, P = 0.555). In the spatial autocorrelation analysis of microsatellite data where classes of connectivity were grouped at intervals of 500 km, i.e. 500, 1,000, 1,500, 2,000, 2,500, 3,000, and 3,500 km, one observes significant (P < 0.05) association between genetic and geographic distances at geographic distances of less than 2,500 km. At connectivity intervals of 3,000 and 3,500 km one no longer observes signifi-cant association between genetic and geographic
distanc-es (Figure 2). Within locality genetic diversity (ƨ) and
among locality genetic differentiation is negatively cor-related (r = –0.935, P < 0.002). Maximum-likelihood and Bayesian-inference estimates of gene flow (Beerli, 2006) among localities were very high (Table 1), while lack of differentiation among sampling localities could not be rejected (Raymond and Rousset, 1995; Goudet et al., 1996). For mitochondrial DNA data, within locality
ge-netic diversity (ƨ) and among locality genetic
differentia-tion is also negatively correlated (r = –0.796, P < 0.018). However, significant differentiation between certain pairs of sampling localities exists, but due to a lack of spatial and geographic pattern, Hrbek et al. (2005) viewed this result as largely an artifact of anthropogenic actions.
4. Discussion
Spatial autocorrelation analysis describes both actual genetic variation and the dynamics of evolutionary proc-esses; it can be applied to samples obtained from continu-ously or discretely distributed populations, but is particu-larly suited for continuously distributed species. Because the spatial autocorrelogram is a summary of the genetic variation in space, it can be used for delimiting geograph-ic regions with low and high genetgeograph-ic connectivity. The au-tocorrelogram profiles will also differ with accordance to variation in ongoing and historical processes involved in structuring of the species (e.g. Sokal and Jacquez, 1991; Epperson, 1993; Sokal et al., 1997). In all spatial autocor-relograms, however, the intercept is defined as the geo-graphic distance at which the autocorrelation becomes non-significant. Samples separated by larger distance than the intercept are genetically independent. In recently established species, this distance has been interpreted as the average distance of gene flow (Sokal and Wartenberg, 1983); however, older species – in the intraspecific coa-lescence sense – often possess a historical pattern of local differentiation, which is statistically confounded with re-cent gene flow in spatial autocorrelation analyses (Diniz-Filho and Telles, 2002). The estimate of average distance of gene flow may therefore be an overestimate of actual gene flow, and therefore the geographic distance inferred from the autocorrelogram intercept will represent an up-per bound limit for a genetically connected population.
Implicitly, the number and definition of the distance classes to be used in the autocorrelograms are arbitrary. However, the distance classes will always be defined by the spatial scale of the study, and a general methodological criterion for choosing distance classes is to try to maximize the similarity in the number of connections for the geo-graphic distance classes. Thus the inherent arbitrariness is not important in most cases because the purpose of the analysis is to describe continuous spatial processes rather than specific instance of geographic distance classes. Our 500 km spatial scale is appropriate for the data analyses.
4.1. Inference of conservation units from spatial Autocorrelograms
Diniz-Filho and Telles (2002) provide an excellent overview for interpreting spatial autocorrelograms for the
0 500 100 1500 2000 2500 3000 3500 4000 0
0.100.20 0.300.40 0.50 0.600.70
Genetic distance
(Fst
) Microsatellite autocorrelogram
Geographic distance (Km)
purpose of defining conservation units. The authors pro-pose three basic patterns: 1) a long-distance cline where one observes a continuous decrease in autocorrelation coefficients with increasing geographic distances; 2) a stabilizing profile where in the first distance classes one observes a continuous decrease in autocorrelation coef-ficients while the second set of classes varies randomly around the mean autocorrelation coefficient of zero; and 3) an absence of spatial pattern where the mean autocor-relation coefficient varies randomly around zero.
In the first instance of a long-distance cline there are no discrete patches of genetic variability or these patches are strongly structured across space. The intercept of the autocorrelogram can be interpreted as the limit of the geographic range of independent samples. Conservation and management units should be established at distances equal to or larger than this intercept, since this strategy will have the potential to preserve most of the intra spe-cific genetic diversity. Conservation units established at smaller distances than indicated by the intercept will be pseudoreplicates of each other, and their creation may not be necessary or justifiable.
In the second instance of a stabilizing profile, one clearly observes a spatial range of genetic similarity. Interpretation of the distance classes of continuous de-crease in autocorrelation coefficients is similar to that for long-distance cline. The second class where the mean autocorrelation varies randomly around the coefficient of zero signifies lack of correlations between geographic and genetic distances. The pattern observed in the second class is due to lack of association between genetic diver-gence and geographic distance among localities at larger geographic distances most often attributed to historical divergence among phylogeographic units. Under this sce-nario, simply choosing conservation units separated by geographic distances larger than those indicated by the intercept will not be sufficient to present current genetic diversity. Other criteria such as the identification of phy-logeographic units and the spatial distribution of genetic diversity will be necessary to the identification of the number and spatial distribution of conservation units.
In the third instance of an absence of spatial pattern in the autocorrelogram, the most important criterion for conservation is maximizing preserving genetic diversity. In the case of a significant among-locality divergence, each sampled locality could be considered a distinct con-servation unit. The absence of significant divergence in principle indicates that we are dealing with a panmictic population that can be viewed as a single conservation unit if no physical barriers to gene flow exist.
4.2. Definition of conservation units for Arapaima gigas Arapaima gigas has been exploited as a source of food in the Amazon basin for centuries (Roosevelt et al., 1996). It seemed to have been able to sustain moderate levels of exploitation until the 1960’s when the effects of overexploitation started to become evi-dent (Crossa and Petrere Jr., 1999). By the late 1970’s stocks near major Amazonian cities became
commer-cially extinct (Goulding, 1979, 1980), and fishermen had to move further and further from traditional grounds to catch Arapaima. A moratorium on Arapaima fishing spurred the recovery in certain protected areas such as the Mamirauá Sustainable Development Reserve, while illegal fishing continued in others. The question, how-ever, remains at which scale do reserves need to be cre-ated or management programs need to be developed in order to preserve the current population dynamics and genetic diversity of Arapaima gigas. It should be noted that there are a number of reserves within the Amazon basin; however, in majority of areas there is a lack of po-litical will and lack of resources to enforcement of exist-ing laws to ensure viable conservation. Further, there is a lack of management programs which in most areas will need to be implemented to ensure the long term survival and recovery of economically valuable species such as theArapaima gigas. Management programs will need to be applied even within reserves since these areas have permanent human settlements often whose only source of cash income is the exploitation of natural resources.
in-crease in correlation of geographic and genetic distances in the first set of distance classes, and the intercept re-mains around 2,500 km.
The spatial autocorrelation analysis of mitochondrial DNA data suggests an absence of spatial pattern where the mean autocorrelation coefficient varies randomly around zero (Figure 3). In this situation, Diniz-Filho and Teles (2002) point out that decision about how many re-serves should be proposed will depend on whether or not differentiation among sampled localities exists. In the
case of Arapaima, certain pairs of localities are
differ-entiated, however, the pattern of differentiation appears largely non-sensical (Hrbek et al., 2005). For example, the two geographically most distance sampling locali-ties – Iquito (Pacaya-Saimiria reserve) and from Marabá on the Tucurui dam (Araguaia-Tocantins system) – are not differentiated. However, they are differentiated from some but not all central Amazonian regions through which would be migrants must pass in order to maintain gene flow between these two localities. This is biologi-cally not realistic. The observed pattern of distribution of genetic diversity most likely reflects a pattern of his-torical gene flow seen as lack of differentiation among genetically diverse sampling localities, and a pattern of recent anthropogenic differentiation driven by genetic drift among genetically depauperate sampling localities (Hrbek et al., 2005). The observed pair-wise differen-tiation would appear largely artifactual, and historically
Arapaima has formed a nearly panmictic species
dis-tributed over a geographically very large area. Although non-significantly associated, Hrbek et al. (2005) noticed that one of the two most common haplotypes predomi-nates in the upper Amazon while the other most common haplotype predominates in the lower Amazon localities. This pattern lends credence to the isolation-by-distance pattern observed in microsatellite data.
Interpreting both autocorrelograms would lead us
to conclude that localities Arapaima gigas separated by
between 2,500 and 3,000 km, the distance at which the correlation between genetic and geographic distance is no longer significant in the microsatellite data (the in-tercept), should be treated as genetically independent populations. Preserving localities in the extremes of the spatial range of the species ensures that most of the among-population genetic divergence will be sampled (Diniz-Filho and Telles, 2002), while preserving areas near the species’ center ensures that most of the genetic
diversity and thus the species’ evolutionary potential is preserved (Crandall et al., 2000; Frankham et al., 2002). The initial increase in correlation (Figure 2) also sug-gests additional source(s) of population structuring unre-lated to isolation-by-distance.
The distance of 2,500-3,000 km inferred should thus act as a metric around which reserves should be
struc-tured. The extent of thevárzea ecosystem is
approximate-ly 4,000 km, thus at least two reserves need to be created to preserve majority of genetic diversity observed within
Arapaima gigas. Since geographic centers of a species’
distribution tend to be the oldest and most diverse areas, an additional reserve should be created near the
geograph-ic center of the distribution of Arapaima. The
Araguaia-Tocantins River system essentially forms a discontinuous
várzea system, thus at least another reserve should be
created in this river system. In all cases the areas chosen
should be those that have large areas of high qualityvárzea
habitat that are well connected to other regions and areas
which contain Arapaima populations with high genetic
variability. Localities with highest genetic variability are those upstream of Tefé, Brazil, and those away from the central and lower Amazon River mainstream (Table 1). These four areas are the minimum number of regions within which reserves should be designated. This number does not provide for replication within each region.
Although we have not conducted systematic study of suitable habitats, several potentially excellent areas ex-ist. In upper Amazon basin in the Ucayali region could
be the Pacaya-Samiria reserve (20,800 km2) and in the
middle Solimões the Mamirauá RDS (11,240 km2) and
Amanã RDS (23,130 km2), and in the middle Amazon
basin the extensive várzea system like the Nhamundá
APA reserve with 1,960 km2. Selecting an area in the
lower Amazon basin is more difficult sincevárzea in
this region is highly degraded, thevárzea is narrow and
the region is relatively densely settled. However, an area in this region should be designated, and may, perhaps in the lower Amazon the Tapará and Aritapera region
(180 km2), Mexiana Island (1,000 km2) and Piratuba
Rebio reserve (3,940 km2) in the Amapá state.
We suggest also the development of Arapaima
man-agement program in some reserves like the Araguaia
park and the Inàwébohona Indigenous Land (1,735 km2)
located in the Araguai-Tocantins River basin, and another area upstream of the Tucurui dam; the Resex of middle
Juruá River (2,513 km2); and in the Piagaçú RDS reserve
(10,081 km2) and the Abudafi Rebio reserve (2,248 km2)
both in the middle Purus River. Also the area of the Juami/Japurá Resex in the upper Japurá appears suitable. Further details on these regions are presented in Table 2. These are existing regions under formal federal or state protection that, based on our field experience, would ap-pear amiable for long terms conservation and
manage-ment of Arapaima. However, more informed choices
should be made through a more sophisticated analysis such as through the use of a Geographic Information System (GIS). Such areas of management and conserva-Figure 3.Spatial autocorrelogram of mitochondrial DNA
and geographic distances.
0 500 1000 1500 2000 2500 3000 3500 4000 0.20
0.15 0.10 0.05 0.00 -0.05 -0.10 -0.15 -0.20 -0.25
Genetic distance (Phist)
Ar
apaima
reserv
es
. Biol., 67(4, Suppl.): 909-917, 2007
Table 2. Areas potentially suitable for long-term conservation and management of Arapaima gigas.
Area Basin Locality Area (ha) Conservation Unit type1 Management of Arapaima gigas
Pacaya-Samiria Nacional Reserve Ucayali 04° 48’ 14” W and 75° 23’ 05” S 2,080,000 RDS Incipient / In development Mamirauá Solimões / Japurá 65° 06’ 53” W and 02° 38’ 52” S 1,124,000 RDS In development / Consolidated
Amana Japurá 64° 43’ 69” W and 02° 21’ 07” S 2,313,000 RDS Incipient / In development
Juami/Japurá Japurá 68° 02’ 25” W and 01° 56’ 22” S 809,238 Resex No
Piagaçú Purus 62° 20’ 06” W and 04° 25’ 38” S 1,008,167 RDS + TI No
Abufari Purus 63° 03’ 07” W and 05° 07’ 44” S 224,819 REBIO No
Nhamundá Amazonas / Nhamundá 56° 41’ 26” W and 02° 22’ 27” S 195,900 APA Incipient
Carauarí Middle Juruá 05° 09’ 10” W and 67° 20’ 37” S 251,289 Resex No
Tapará/Aritapera Amazonas 54° 34’ 28” W and 02° 09’ 36” S 17,348 Access regulated by fishing accords In development / Consolidated Ilha da Mexiana Amazonas 49° 34’ 40” W and 0° 0’ 18” S 100,000 Private Incipient / In development Piratuba Amazonas (Estuary) 50° 13’ 37” W and 01° 33’ 44” S 394,223 REBIO Incipient / In development
tion should not be restricted by political boundaries as Arapaima respects no political borders and large tracts of well preserved and ecologically suitable habitat exists in frontier regions of the western Amazon basin.
Independent of the final choice of areas of conserva-tion, it is important that the selected areas are sufficiently large and ecologically complex to not be overly sensitive to environmental stochasticity. Furthermore, these areas must be allowed to produce an excess of individuals that can act as sources of migrants to other less favorable areas, and areas with intense fishing pressure. Genetic estimates of movement suggest that large numbers of individuals are exchanged among regions every generation (Table 1), and animals have been observed to move up to 35 km per month (Crossa, 2003). Thus we believe that with proper management, and because of limited resources, these key protected várzea areas could act as source areas in a source-sink metapopulational system, ensuring and maintaining the long-term health of Arapaima gigas in the whole Amazon River basin. Upon the verification that there are no barriers to gene flow that would prevent the functioning of the proposed source-sink metapopulational system, this strategy will serve to preserve not only the species and its genetic diversity, but also the evolutionary processes responsible for the generation of these patterns. Preserving patterns of genetic diversity as well as the processes generating these patterns is the only way that long-term conservation strategies can succeed.
4.3. Implications for other várzea organisms
Arapaima gigas is an economically important and a conspicuous member of the várzea, but not the only one. Other economically very important fish groups include the tambaqui (Colossoma macroponum Cuvier, 1816), the pirapitinga (Piaractus brachypomus (Cuvier, 1818)), the matrinxã (Bryconspp. Müller and Troschel 1844), the aru-anã (Osteoglossum bicirrhosum (Cuvier, 1829)), the sardin-ha (Triportheus spp. Cope 1872), and various catfish and cichlid species for which very large commercial fisheries exist. The black caiman (Melanosuchus niger (Spix 1825)) and the spectacled caiman (Caiman crocodilus (Linnaeus 1758)), and the giant river turtles (Podocnemisspp. Wagler 1830) also form an important and conspicuous component of the várzea ecosystem as does the Amazonian manatee (Trichechus inunguis (Natterer, 1883)). As far as examined (Farias et al., 2004; Cantanhede et al., 2005; Pearse et al., 2006; Vasconcelos et al., 2006; Santos et al., 2007) all of these large and economically important species have a ge-netic structure similar to that of Arapaima gigas. Therefore the designation of várzea reserves on the scale suggested forArapaima is likely to benefit other important members of the várzea ecosystem of the Amazon basin.
Acknowledgments — This research was supported by Universidade Federal do Amazonas, FAPEAM/Projeto Temático (to IPF), the Várzea Project (IPAM, Brazil) which is funded by the World Wide Fund for Nature (WWF-UK) and the Overseas Development Administration (ODA) (to MC), the National Science Foundation (INT-0002213) and FAPEAM fellowship (to TH). Molecular markers were developed and data partially
collected in the laboratory of A. Meyer. Permission to conduct fieldwork and to collect tissue samples has been granted by IRENA, IBAMA and the Mamirauá Civic Society. Additional samples were provided by I. Sampaio and J. Porto.
References
BAYLEY, PB. and PETRERE JR., M., 1989. Amazon fisheries: Assessment methods, current status and management options. In DODGE, DP. (ed.). International Large River Symposium. Proceedings. Canadian Special Publication of the Fish Aquatic Sciences.
BEERLI, P., 2006. Comparison of Bayesian and maximum-likelihood inference of population genetic parameters. Bioinformatics, vol. 22, no. 3, p. 341-345.
BEERLI, P. and FELSENSTEIN, J., 1999. Maximum likelihood estimation of migration rates and effective population numbers in two populations using a coalescent approach. Genetics, vol. 152, no. 2, p. 763-773.
CANTANHEDE, AM., DA SILVA, VMF., FARIAS, IP., HRBEK, T., LAZZARINI, SM. and ALVES-GOMES, JA., 2005. Phylogeography and population genetics of the endangered Amazonian manatee, Trichechus inunguis Natterer, 1883 (Mammalia, Sirenia). Mol. Ecol., vol. 14, no. 2, p. 401-413. COCKERHAM, CC. and WEIR, BS., 1993. Estimation of gene flow from F-statistics. Evolution, vol. 47, no. 3, p. 855-863. CRANDALL, KA., BININDA-EMONDS, ORP., MACE, GM. and WAYNE, RK., 2000. Considering evolutionary processes in conservation biology. Trends Ecol. Evol., vol. 15, no. 7, p. 290-295.
CROSSA, M., 2003. Una experiencia promisora para el subsidio de programas de manejo del pirarucu (Arapaima gigas Cuvier) en el Bajo Amazonas. In IIAP - Taller Internacional de Manejo de Paiche o Pirarucu. Resumos. Iquitos, Perú.
CROSSA, M. and PETRERE JR., M., 1999. Morphometric relationships and indirect determination of the length frequency structure of the pirarucu, Arapaima gigas (Cuvier), in Brazilian Amazonia.Fish. Manage. Ecol., vol. 6, no. 3, p. 233-240. CROSSA, M. and DEL AGUILA CHAVES, J., 2005. The adaptive management of impacts as a strategy for the sustainable use of the pirarucu in the Amazon basin. In MARINI, MÂ. (ed.). XIX Annual Meeting of the Society for Conservation Biology. Proceedings. Universidade de Brasília, Brasília, Society for Conservation Biology.
DINIZ-FILHO, JAF. and TELLES, MPDC., 2002. Spatial autocorrelation analysis and the identification of operational units for conservation in continuous populations. Conserv. Biol., vol. 16, no. 4, p. 924-935.
EPPERSON, BK., 1993. Recent advances in correlation studies of spatial patterns of genetic variation. Evol. Biol., vol. 27, no. 1, p. 95-155.
EXCOFFIER, L., LAVAL, G. and SCHNEIDER, S., 2005. Arlequin ver. 3.0: An integrated software package for population genetics data analysis. Evol. Bioinform. Online, vol. 1, no. 1, p. 47-50.
FARIAS, IP., DA SILVEIRA, R., DE THOISY, B., MONJELÓ, LADS., THORBJARNARSON, J. and HRBEK, T., 2004. Genetic diversity and population structure of Amazonian crocodilians.Anim. Conserv., vol. 7, no. 3, p. 265-272. FRANKHAM, R., BALLOU, JR. and BRISCOE, DA., 2002. Introduction to Conservation Genetics. Cambridge, England, Cambridge University Press, 617p.
GAGGIOTTI, OE., LANGE, O., RASSMANN, K. and GLIDDON, C., 1999. A comparison of two indirect methods for estimating average levels of gene flow using microsatellite data.Mol. Ecol., vol. 8, no. 9, p. 1513-1520.
GOUDET, J., RAYMOND, M., DE MEEÜS, T. and ROUSSET, F., 1996. Testing differentiation in diploid populations. Genetics, vol. 144, no. 4, p. 1933-1940.
GOULDING, M., 1979. Ecologia de Pesca do Rio Madeira. Manaus, Brazil, INPA, 172p.
-, 1980. Fishes and the Forest: Explorations in Amazonian Natural History. Los Angeles, CA, University of California press. 250p.
HALL, T., 1999. BioEdit: a user-friendly biological sequence alignment editor and analysis program for Windows 95/98/NT. Nucleic Acids Symp. Ser., vol. 41, no. 1, p. 95-98.
HRBEK, T., FARIAS, IP., CROSSA, M., SAMPAIO, I., PORTO, JIR. and MEYER, A., 2005. Population genetic analysis of Arapaima gigas, one of the largest freshwater fishes of the Amazon basin: implications for its conservation. Anim. Conserv., vol. 8, no. 3, p. 297-308.
LAVOUÉ, S. and SULLIVAN, JP., 2004. Simultaneous analysis of five molecular markers provides a well-supported phylogenetic hypothesis for the living bony-tongue fishes (Osteoglossomorpha: Teleostei). Mol. Phylogenet. Evol., vol. 33, no. 1, p. 171-185.
LÜLING, V., 1964. Zur Biologie und Ökologie von Arapaima gigas (Pisces, Osteoglossidae). Z. Morph. Öko. Tiere, vol. 54, no. 3, p. 436-530.
LUNDBERG, JG. and CHERNOFF, B., 1992. A miocene fossil of the amazonian fish Arapaima (Teleostei: Arapaimidae) from the Magdalena River region of Colombia: biogeographic and evolutionary implications. Biotropica, vol. 24, no. 1, p. 2-14. MANLY, BFJ., 2006. Randomization, Bootstrap and Monte Carlo Methods in Biology. 3rd. edition. London, England,
Chapman and Hall, 455p.
MANTEL, N., 1967. The detection of disease clustering and a generalized regression approach. Cancer Res., vol. 27, no. 2, p. 209-220.
MENEZES, RS., 1951. Notas biológicas e econômicas sobre o pirarucu Arapaima gigas (Cuvier) (Actinopterygii, Arapaimidae).Serv. Inform. Agrí. / Minist. Agric. Ser. est. téc., vol. 3, p. 9-39.
NELSON, G., 1969. Infraorbital bones and their bearing on the phylogeny and geography of osteoglossomorph fishes. Amer. Mus. Novitates, vol. 2394, no. 1, p. 1-37.
NELSON, JS., 1994. Fishes of the World. 3rd. edition. New York, NY, John Wiley and Sons, Inc., 624p.
PEARSE, DE., ARNDT, AD., VALENZUELA, N., MILLER, BA., CANTARELLI, VH. and SITES JR., JW., 2006. Estimating population structure under nonequilibrium conditions in a
conservation context: continent-wide population genetics of the giant Amazon river turtle, Podocnemis expansa (Chelonia; Podocnemididae).Mol. Ecol., vol. 15, no. 4, p. 985-1006. QUEIROZ, HL., 1999. Artisanal fisheries of Pirarucu at the Mamirauá Ecological Station. In PADOCH, C., AYRES, JM., PINEDO-VASQUEZ, M. and HENDERSON, A. (eds.). Várzea: Diversity, Development, and conservation of Amazonia’s Whitewater Floodplains. Section 1: Fish and Fisheries. Bronx, NY, The New York Botanical Garden Press (NYBG), p. 83-99. RAYMOND, M. and ROUSSET, F., 1995. An exact test for population differentiation. Evolution, vol. 49, no. 6, p. 1280-1283.
RICHARD, M. and THORPE, RS., 2001. Can microsatellites be used to infer phylogenies? Evidence from population affinities of the western Canary Island lizard (Gallotia galloti). Mol. Phylogenet. Evol., vol. 20, no. 3, p. 351-360.
ROOSEVELT, AC., LIMA DA COSTA, M., LOPES MACHADO, C., MICHAB, M., MERCIER, N., VALLADAS, H., FEATHERS, J., BARNETT, W., IMAZIO DA SILVEIRA, M., HENDERSON, A., SLIVA, J., CHERNOFF, B., REESE, DS., HOLMAN, JA., TOTH, N. and SCHICK, K., 1996. Paleoindian cave dwellers in the Amazon: the peopling of the Americas.Science, vol. 272, no. 5260, p. 373-384.
SAINT-PAUL, U., 1986. Potential for aquaculture of South American freshwater fishes: a review. Aquaculture, vol. 54, no. 3, p. 205-240.
SAMBROOK, J., FRITSCH, EF. and MANIATIS, T., 1989. Molecular Cloning: A Laboratory Manual. Cold Springs Harbor, NY, Cold Springs Harbor Laboratory Press. 1659p. SANTOS, MDCF., RUFFINO, ML. and FARIAS, IP. High levels of genetic variability and panmixia of the tambaqui Colossoma macropomum (Cuvier, 1818) in the main channel of the Amazon River. J. Fish Biol., vol. 71a, no. 1, p. 33-44. SLATKIN, M., 1995. A measure of population subdivision based on microsatellite allele frequencies. Genetics, vol. 139, no. 1, p. 457-462.
SMOUSE, PE., LONG, JC. and SOKAL, RR., 1986. Multiple regression and correlation extensions of the Mantel test of matrix correspondence. Syst. Zool., vol. 35, no. 4, p. 627-632. SOKAL, RR. and JACQUEZ, GM., 1991. Testing inferences about microevolutionary processes by means of spatial autocorrelation analysis. Evolution, vol. 45, no. 1, p. 152-168. SOKAL, RR., ODEN, NL. and THOMSON, BA., 1997. A simulation study of microevolutionary inferences by spatial autocorrelation analysis. Biol. J. Linn. Soc., vol. 60, no. 11, p. 73-93.
SOKAL, RR. and WARTENBERG, D., 1983. A test of spatial autocorrelation using an isolation-by-distance model. Genetics, vol. 105, no. 1, p. 219-237.
VASCONCELOS, WR., HRBEK, T., DA SILVEIRA, R., DE THOISY, B., MARIONI, B. and FARIAS, IP., 2006. Population genetic analysis of Caiman crocodilus (Linnaeus, 1758) from South America. Genet. Mol. Biol., vol. 21, no. 2, p. 220-230. VERÍSSIMO, J., 1895. A Pesca na Amazônia. Rio de Janeiro, Brasil, Livraria Clássica, de Alves & C., 130p.