Applied nutritional investigation
Comparative proteomic analysis of human whole saliva of children
with protein
–
energy undernutrition
Cristiane S
a Roriz Fonteles Ph.D.
a,*, Cl
audia Ferreira dos Santos Ph.D.
b,
Karla Shangela da Silva Alves D.D.S.
c, Ana Catarina de Miranda Mota M.S.
c,
Juliana Ximenes Damasceno D.D.S.
c, Manass
es Claudino Fonteles Ph.D.
baLaboratory of Metabolic Pharmacology and Cell Physiology, Federal University of Ceara, Fortaleza, Cear a, Brazil bBiomedical Institute, Laboratory of Cardiorenal Pharmacology, State University of Ceara, Fortaleza, Ceara, Brazil cPostgraduate Program in Dentistry, Federal University of Ceara, Fortaleza, Ceara, Brazil
a r t i c l e
i n f o
Article history: Received 30 May 2011 Accepted 6 October 2011
Keywords: Saliva Protein
Two-dimensional electrophoresis Children
Undernutrition
a b s t r a c t
Objective:The aim of the present study was to investigate the protein profile of children with different levels of protein–energy undernutrition (PEU) through a proteomic approach of human whole saliva.
Methods:Initially, saliva samples of children with mild, moderate, and severe PEU were collected and lyophilized. Saliva samples of healthy children were used as controls. Samples were analyzed for total protein using the Bradford method. Saliva samples were analyzed by two-dimensional electrophoresis according to their isoelectric point (pI) and their molecular weights (MWs). Results:Comparisons of protein bands among the healthy and mildly, moderately, and severely undernourished children showed significant differences in the MWs (P¼0.001) and pI values (P¼ 0.03). In total 159 spots were identified in the healthy children; 156, 168, and 221 spots were observed in mildly, moderately, and severely undernourished children, respectively. Mildly undernourished children presented with the spot with the highest MW of 293 kDa (pI¼7.77) and the lowest MW of 5 kDa (pI¼4.83). Moderately undernourished children were the only ones who did not present with a protein band with an MW of 30 kDa. The presence of a protein band with an MW of 123 kDa (pI¼516), possibly a cyclin-dependent protein kinase, was also observed only in this group.
Conclusion:The protein profile in saliva varies according to the presence or absence of PEU, and these variations are specifically expressed in different grades of undernutrition. Thus, saliva may be an important diagnostic tool for the assessment of PEU.
Ó2012 Elsevier Inc. All rights reserved.
Introduction
Protein–energy undernutrition (PEU) is one of the most common and important nutritional deficiencies and is charac-terized by an inadequate caloric consumption coupled with a deficient protein intake. This pathology is worsened by frequent episodes of gastroenteritis and other infectious processes that, in addition to increasing the body’s nutritional requirements, may significantly impair its resorptive properties[1,2].
Saliva is an aqueous liquid produced and secreted by the major (parotid, submandibular, and sublingual) and minor sali-vary glands, which in conjunction with the gingival crevicular fluid constitutes whole saliva, afluid responsible for the main-tenance of oral homeostasis[3,4]. Water is the main constituent of salivaryfluid, representing 99% of its composition. The solid constituents of saliva consist of organic and inorganic molecules that vary greatly from one individual to another and throughout the day within the same individual[3].
Various proteins are found within whole saliva. These mole-cules participate in the protection of the oral tissues and include proline-rich proteins, amylases, albumin, immunoglobulins, lysozymes, lactoferrin, lactoperoxidase, histatins (with antimi-crobial properties), statherin (for calcium homeostasis), mucins (for lubrication), and cysteines[5]. The protein and peptides in This study was supported by the National Council for Scientific and
Techno-logical Development (CNPq).
*Corresponding author. Tel.:þ55-85-3366-8232; fax:þ55-85-3366-8232. E-mail address:[email protected](C. S. R. Fonteles).
0899-9007/$ - see front matterÓ2012 Elsevier Inc. All rights reserved. doi:10.1016/j.nut.2011.10.005
Contents lists available atScienceDirect
Nutrition
whole saliva are a product of a series of complex molecular processes that define the final structures of these molecules. These processes initiate at a biosynthetic, intraglandular level and arefinalized after intraoral secretion[6]. In addition, salivary proteins are subject to extensive ongoing changes that may affect the proteomics of whole saliva. In contrast to human serum, the proteomics of human whole saliva are highly susceptible to various biochemical and physiological processes, and a molecular approach toward its dynamics is needed[6]. Previous studies have demonstrated that the salivary protein profile is associated with various pathologic disorders, such as disorders of the conjunctive tissues, cysticfibrosis, diabetes mellitus[7], Sjögren’s syndrome[8], dental caries, and periodontal disease[9].
Although many have emphasized the synergistic relation among undernutrition, infectious diseases, and the immunologic system, very few studies have investigated proteins in the whole saliva of undernourished children [10,11]. We believe a better understanding of the salivary proteomics in children with PEU may allow further use of saliva as a diagnostic tool in this condition by the identification of salivary biomarkers. The technology of proteomics, including methods such as liquid chromatography/mass spectrometry and bidimensional electro-phoresis, constitutes the state of the art for the analysis of saliva and other biological materials[12]. However, the great challenge of identifying the functional significance and diagnostic value of whole saliva is in the ability to establish its composition in healthy patients and in those with specific pathologies. We aimed to investigate the protein profile of children with mild, moderate, and severe PEU and to compare thesefindings with the protein profile in a group of healthy children through the proteomic analysis of whole saliva.
Materials and methods
Population
Ninety-one boys and girls with PEU (12–72 mo old, 41.024.7 months-age) were selected from a low-income population who were admitted to the Institute for Prevention and Exceptionality (IPREDE), a reference center for the treatment of malnutrition in the State of Ceara (Brazil). Children were diagnosed as having mild or grade I (GI;n¼31;Zscores 1.01 to 2.00 standard deviation [SD]), moderate or grade II (GII;n¼30;Zscores 2.01 to 3.0 SD), or severe or grade III (GIII;n¼30;Zscores< 3.0 SD) undernutrition according to child growth standards adopted by the World Health Organization[13]. TheZscores (number of SDs below or above the reference mean or median value) were calculated using EpiInfo 6.0 (Centers for Disease Control, Atlanta, GA, USA) based on a child’s date of birth, gender, weight, and length/height. Thirty-one healthy girls and boys within the age range of the undernourished population who attended the Pediatric Dental Clinic at the Federal University of Ceara were recruited to participate in this study as a control group (G0). This study was approved by the ethics committee of the Federal University of Ceara Medical School (Brazil). Informed consent was signed by the parents or legal guardians before a child’s enrollment in the study.
Sample collection
For the sample collection, the children were individually placed at rest on their mother’s lap for 30 min. Subsequently, a total volume of 1.5 mL of unsti-mulated whole saliva was collected during 60 s by a disposable cannula, placed into plastic tubes, and immediately transported under ice to the laboratory. Saliva collection was always carried out from 09:00 to 11:00 after a 2-h fasting period. Oral hygiene procedures were performed 1 h before the collection. Saliva samples were clarified by centrifugation at 10 000gfor 10 min, and a volume of 200mL
of the supernatant was removed, lyophilized, and stored at 80C for posterior analysis[14]. This standardized protocol was used to control for circadian rhythms and environmental influences in salivary secretion.
Proteomic analysis of saliva: Determination of total proteins
Total protein concentration was determined by the Bradford method[15], with Coomassie blue G250 as the reagent and bovine serum albumin as the
standard protein (Sigma Chemical Co., St Louis, MO, USA). All samples were analyzed in duplicate. The lyophilized samples were reconstituted by adding 50
mL of Milli-Q water (Milli-Q Plus Ultrapure water system, Millipore Corp., MA,
USA) and homogenized with a mechanical agitator (Vortex AP-56, Phoenix, S~ao Paulo, Brazil). Subsequently, 5mL was withdrawn, and 1 mL of the Bradford
solution was added, rehomogenized, and left to rest for 10 min. Absorption was measured at 595 nm in a spectrophotometer (Ultraspec 1100, Pharmacia, Cam-bridge, UK).
Two-dimensional gel electrophoresis
Isoelectric focalization (first dimension)
Gel strips with immobilized pH gradient (IPG), pH 3-10 (Immobiline Dry Strip Gels, GE Healthcare Bio, NJ, USA) were rehydrated for 12 h with a sample buffer (urea 8 mol/L, 2% (3-[(3-Cholamidopropyl) dimethylammonio]-1 propane-sulfonate), dithiothreitol 18 mmol/L, 0.5% IPG buffer [GE Healthcare Bio-Sciences Corp., NJ, USA] containing 400 mg of protein). Each gel was subjected to a maximum electrical current of 50mA using the following program: 300 V for 30
min, 1000 V for 30 min, 5000 V for 1 h 20 min at 4.0 kV/h, and 5000 V for 25 min at 0.5 kV/h. Immediately after focalization, the gels were bathed in an equilibrium solution (Tris-HCl 50 mmol/L, pH 8.8, urea 6 mol/L, 30% glycerol, 2% sodium dodecylsulfate, dithiothreitol 64 mmol/L) for 15 min. Then, the second dimension was performed.
Sodium dodecylsulfate polyacrylamide gel electrophoresis (second dimension) After the isoelectric focalization, the gel lane was placed on a polyacrylamide gel (12 14 cm, 12.5%) and e proteins were separated according to their molecular weight (MW) horizontally within the electrophoresis apparatus (IPGphor and Hoefer SE 600; Amersham Pharmacia Biotech, Cambridge, UK). At the end of the running session, the gel wasfixed for 30 min in 10% trichloroacetic acid, stained with Coomassie blue for 1 h, and distained overnight with distaining solution containing 5% acetic acid (150 mL), 10% methanol (300 mL) and H2O
(2550 mL).
Gel analysis
The gels (in duplicate) were digitalized (FX; Bio-Rad, Hercules, CA, USA), and the images were processed with Image Master 2D (Amersham Pharmacia Biotech). The analysis allowed the detection and quantification of the protein points and the verification of the correspondence among the G0, GI, GII, and GIII gels. Salivary proteins were identified based on the MW and isoelectric point (pI) of the identified molecules by referring to the following databases: Swiis-Prot (http://expansy.org), EMBL (http://emblheidelberg.de), and NCBI (http://www. ncbi.nlm.nih.gov/entrez/query.fcgi).
Data analysis
The MW and pI values from each group were compared by the Kruskal-Wallis test. When variables demonstrated statistical differences, the Dunn test was applied to ascertain which groups differed. Data were reported as meanSD, median, minimum, and maximum values. The statistical significance was set at P<0.05.
Results
The highest total protein concentration in saliva was observed in G0 (0.699
m
g/mL), followed by GIII (0.661m
g/mL), GII (0.424m
g/mL), and GI (0.171m
g/mL).an absence of spots with an MW of 30 kDa, and the presence of a protein spot with an apparent mass of 123 kDa (pI¼5.16).
Group I presented with the highest mean MW, whereas GIII expressed the lowest (Table 1). Comparisons of the MWs between groups demonstrated significant differences between G0 and GI (P0.001), G0 and GII (P0.001), GI and GIII (P¼ 0.03), and GII and GIII (P¼0.05), with no differences observed between G0 and GIII (P¼0.096). The MW did not differ between GI and GII (P¼0.43;Fig. 3).
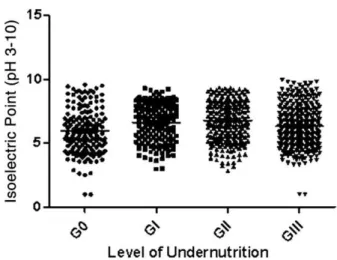
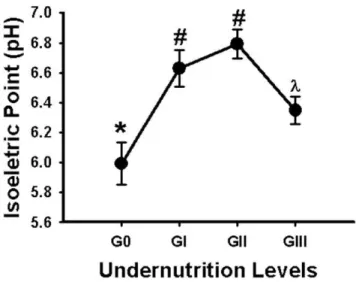
Plotting of the mean pI showed an increment among G0, GI, and GII and an pI decrease from GII to GIII (Fig. 4). In G0 a more acidic region was noted, with 64 spots focused at a mean pI of 5.9, whereas 60 protein spots from GI and 66 spots from GII concen-trated in a neutral region with mean pI values equal to 6.6 and 6.8, respectively. Comparisons of pI values between groups demonstrated differences between G0 and GI (P¼0.001), G0 and
GII (P¼0.01), G0 and GIII (P¼0.03), GI and GII (P¼0.29), GI and GIII (P¼0.04), and GII and GIII (P¼0.01;Fig. 5). Most spots were contained in the pI range of 6.521.63, with mean MWs of 26.22 16.25 kDa (G0), 17.782.41 kDa (GI), 23.637.09 kDa (GII), and 18.8012.82 kDa (GIII). Only G0 and GIII presented with protein spots within an acidic region focusing at an Ip equal to 3.94.
Discussion
All protein components resulting from tissue degeneration tend to accumulate within the oral cavity[1]in concentrations and/orfluctuations that may resemble those expressed in plasma [16–18], justifying the use of saliva as a diagnostic tool in the presence of PEU. The present study evaluated the proteomics of human whole saliva in children with different grades of under-nutrition to better understand the ongoing systemic activities associated with this type of metabolic imbalance. The compar-ative analysis of these electrophoretic results showed consider-able variations in the different groups and exhibited substantial differences in the frequency, number, and size of the spots. Different grades of undernutrition expressed the same MW on the strips, but with subtle differences in their pI values, sug-gesting the presence of protein isoforms. In agreement with our observations, Yao et al.[5]identified protein components within saliva and the acquired pellicle through proteomic analysis. They also observed the presence of stripes in their gels, which were considered protein isoforms.
The comparisons of the two-dimensional electrophoretic gels obtained from samples of healthy and mildly, moderately, and severely undernourished children showed a similar protein pattern, with considerable differences in the total number of spots. Severely undernourished children demonstrated the largest quantities of protein fragments (10–20 kDa) in saliva, possibly owing to an ongoing increase in proteolytic activity. Ibrahim et al.[19]studied the salivary constituents of healthy and undernourished Egyptian children and observed an increase in
Fig. 1.Distribution of protein spots in G0, GI, GII, and GIII within pH 3 to 10. G0,
healthy children; GI, children with mild undernutrition; GII, children with moderate undernutrition; GIII, children with severe undernutrition.
Fig. 2.Distribution of spots in G0 (A), GI (B), GII (C), and GIII (D) according to their MWs and number of spots. G0, healthy children; GI, children with mild undernutrition; GII,
protein components in the edematous cases and a decrease in these constituents in the non-edematous cases. The investigators suggested that the increase in protein concentration was the result of a severe impairment of the salivary glands. El-Shobaki et al.[20]performed an electrophoretic evaluation of the sali-vary protein profile of 104 undernourished children and sug-gested tissue degeneration as the possible cause of the increased protein concentration observed in the saliva of severely under-nourished individuals. However, Agarwal et al.[10]evaluated 42 healthy and 52 undernourished Indian children and found a progressive decrease in salivary proteins with an increased severity of undernutrition. The investigators justified theirfi nd-ings by stating that hypoaminoacidemia would be present in the most severe stages of undernutrition, generating a subsequent decrease in systemic amino acids and eventually affecting protein synthesis. Thus, although some have agreed with ourfindings by identifying higher protein levels in the saliva of severely under-nourished children [19,20], in other instances, similar results were not demonstrated [10,19]. These controversies may be explained by the fact that severely undernourished children may express different protein breakdown responses to food depriva-tion, depending on whether undernutrition is clinically man-ifested as marasmus (non-edematous PEU), kwashiorkor, or marasmic kwashiorkor (edematous PEU)[21]. In non-edematous cases, there may be higher rates of protein breakdown,
generating fewer proteins in plasma and possibly in saliva, whereas in edematous undernutrition proteolysis cannot be maintained, thus decreasing free amino acid supply, plasma and salivary protein levels[22]. The characterization of the different clinical syndromes of severe childhood undernutrition was beyond the scope of this study but will be required in future salivary evaluations of undernutrition for a better understanding of this phenomenon.
We separated proteins by their molecular masses and pI values, allowing a more accurate approach toward the salivary protein composition in the sampled population. Few studies have investigated undernutrition and salivary composition in children [10,11,19,23,24], and none have been able to use such technology, thus limiting their ability to interpret their findings. In the present study, significant differences were observed in the distribution of protein molecular masses from healthy and mildly, moderately, and severely undernourished children. Despite exhibiting a higher protein concentration, the protein profile of the severely undernourished children did not differ from the Table 1
Mean, SDM, minimum, median, and maximum molecular weights (kilodaltons) of children with different grades of undernutrition
Group n Mean SDM Minimum Median Maximum P
G0 31 26.10 32.40 7 11.00 142 0.001
GI 31 32.90 64.42 5 14.00 580 0.001
GII 30 23.95 22.05 8 13.50 123 0.001
GIII 30 18.82 22.00 8 12.00 139 0.096
G0, healthy children; GI, children with mild undernutrition; GII, children with moderate undernutrition; GIII, children with severe undernutrition; SDM, standard deviation of the mean
Comparisons of molecular weights between group 0 and groups I, II, and III were performed with the Kruskal-Wallis one-way analysis of variance on ranks.
Fig. 3.Mean molecular weights (kilodaltons) from healthy children and those with
mild, moderate, and severe undernutrition. Data are expressed as meanSEM.
*Kruskal-Wallis test followed by the Dunn test for comparisons (P<0.05). The
same symbols indicate no statistically significant differences between groups; different symbols indicate statistically significant differences between groups. G0, healthy children; GI, children with mild undernutrition; GII, children with moderate undernutrition; GIII, children with severe undernutrition.
Fig. 4.Distribution of molecular weights (kilodaltons) within the different groups.
G0, healthy children; GI, children with mild undernutrition; GII, children with moderate undernutrition; GIII, children with severe undernutrition; MW, molecular weight.
Fig. 5.Mean isoelectric points (pH) of the different groups. Data are expressed as
meanSEM.*Kruskal-Wallis test followed by the Dunn test for comparisons (P<
pattern observed in healthy children or from those with mild and moderate undernutrition. Few studies have reported differences in the salivary composition of children with different grades of undernutrition compared with healthy children[10,19,23].
In the present study, the protein spots focused predominantly within a mean pI gradient of 6.521.63. In addition, a trend toward an increase in the mean pI of healthy children and those with mild and moderate undernutrition was observed. A decrease in the mean pI range of the severely undernourished group was noted. Thus, salivary proteins from healthy and severely undernourished children were concentrated within a more acidic pI range. All proteins are electrically charged, and their distribution of charges may change as a function of pH. The lower the pH is, the greater the Hþconcentration in solution and,
hence, the more prevalent the positively charged molecule[25]. Nevertheless, in the mild and moderate PEU groups, there was a tendency toward a neutral pH and a prevalence of the nega-tively charged protein form[26].
Mildly undernourished children expressed the spot with the greatest (MW 293 kDa, pI¼7.77) and the least (5 kDa, pI¼4.83) molecular mass. In addition, only moderately undernourished children did not express the 30-kDa spot and showed a 123-kDa (pI¼5.16) spot. This protein may be a cyclin-dependent kinase, which is responsible for cell signaling. Cyclin-dependent kinases are a family of proteins that, depending on their role within the cell cycle and transcription regulation, may be subdivided in two major functional groups. They are present during the entire cycle, but when linked to cyclins, are activated only in specific phases[27]. The cyclin-dependent kinase/cyclin complex phos-phorylates specific proteins. Because of its essential role in the process of apoptosis, cellular proliferation, glycogen metabolism, neurotransmission, and oncogenesis, the deregulation or super-expression of protein kinases is associated with diseases such as asthma, cancer, cardiovascular disorders, undernutrition, dia-betes, and diseases of the central nervous system, among others [28,29]. Future studies in a larger population should focus on identifying proteins with molecular masses of 293 kDa (pI ¼ 7.77) and 5 kDa (pI¼4.83) in mildly undernourished children and 30 and 123 kDa (pI¼5.16) in moderately undernourished children. These proteins were specifically associated with undernutrition in the present population by their expression or lack thereof.
Conclusion
Our results suggest a unique proteomic expression in the saliva of children with different levels of undernutrition. This proteomic profile differs from that observed in healthy children, indicating that saliva is an important diagnostic tool in PEU, with the advantage of being less invasive and more cost effective.
Acknowledgments
The authors thank the Center of Genomics and Bioinformatics (NUGEN) of State University of Ceara for its assistance during the performance of this study.
References
[1] Shils ME, Olson JA, Moshe S. Modern nutrition in health and disease. Philadelphia: Lippincott Williams & Wilkins; 1999. p 903–21.
[2] Semba RD, Bloem MW. Nutrition in health in developing countries. Totowa: Humana Press; 2001. p 71–91.
[3] Edgar WM. Saliva: its secretion, composition and functions. Br Dent J 1992;172:305–12.
[4] Mandel ID. Oral infections: impact on human health, well-being, and health-care costs. Compendium Cont Educ Dent 2002;23:403–13. [5] Yao Y, Berg EA, Costello CE, Troxler RF, Oppenheim FG. Identification of
protein components in human acquired enamel pellicle and whole saliva using novel proteomics approaches. J Biol Chem 2003;278:5300–8. [6] Helmerhorst EJ, Oppenheim FG. Saliva: a dynamic proteome. J Dent Res
2007;86:680–93.
[7] Anil S, Remani P, Beena VT, Nair RG, Vijayakumar T. Immunoglobulins in the saliva of diabetic patients with periodontitis. Ann Dent 1995;54:30–3. [8] Giusti L, Baldini C, Bazzichi L, Bombardieri S, Lucacchini A. Proteomic
diagnosis of Sjögren’s syndrome. Expert Rev Proteomics 2007;4:757–67. [9] Tang X, Pan Y, Wang Z. Sodium dodecyl sulphate polyacrylamide gel
electrophoresis of whole salivary proteins from patients with adult periodontitis. Hua Xi Kou Qjang Yi Xue Za Zhi 2003;21:98–100. [10] Agarwal PK, Agarwal KN, Agarwal DK. Biochemical changes in saliva of
malnourished children. Am J Clin Nutr 1984;39:181–4.
[11] Johansson I, Lenander-Lumikari M, Saellström AK. Saliva composition in Indian children with chronic protein–energy malnutrition. J Dent Res 1994;73:11–9.
[12] Amado FM, Vitorino RM, Domingues PM, Lobo MJ, Duarte JA. Analysis of human saliva proteome. Expert Rev Proteomics 2005;2:521–39. [13] World Health Organization (WHO) Multicentre Growth Reference Study
Group. WHO child growth standards based on length/height, weight and age. Acta Paediatr 2006;(suppl 450):76–85.
[14] Fonteles CSR, Guerra MH, Ribeiro TR, Mendonc¸a DR, Carvalho CBM, Monteiro AJ, et al. Association of free amino acids with caries experience and mutans streptococci levels in whole saliva of children with early childhood caries. Arch Oral Biol 2009;54:80–5.
[15] Bradford MM. A rapid and sensitive method for the quantitation of microgram quantities of protein utilizing the principle of protein–dye binding. Anal Biochem 1976;72:248–54.
[16] Schneyer CA. Salivary gland changes after isoproterenol-induced enlarge-ment. Am J Physiol 1962;203:232–6.
[17] Bartual J. Fisiologıa y salivary ion a parotıdea. In: Clemente M, editor. Patologıde la parotida. Balencia: Fundaciooon Garcıa Mu~noz; 1980. p. 27– 40.
[18] Dawes C. Rhythms in salivaryflow rate and composition. Int J Chronobiol 1974;2:253–79.
[19] Ibrahim AM, El-Hawary MF, Sakr R. Protein–caloric salivary ion (PCM) in saliva immunological changes of salivary protein in PCM. Z Ernahrygswin 1978;1:145–52.
[20] El-Shobaki FA, Ibrahim A, El-Hawary MFS, Sakr R, Said A. Salivary amino acids and proteins in normal and malnourished Egyptian infants and young children. Z Ernahrungswiss 1978;17:19–25.
[21] Jahoor F, Badaloo A, Reid M, Forrester T. Protein metabolism in severe childhood malnutrition. Ann Trop Paediatr 2008;28:87–101.
[22] Manary MJ, Broadhead RL, Yarasheski KE. Whole-body protein kinetics in marasmus and kwashiorkor during acute infection. Am J Clin Nutr 1998;67:1205–9.
[23] Mcmurray DN, Rey H, Casazza LJ, Watson RR. Effect of moderate malnu-trition on concentrations of immunoglobulins and enzymes in tears and saliva of young Colombian children. Am J Clin Nutr 1977;30:1944–8. [24] Azzopadi D, Watson JG. Gambian children have less salivary secretory
immunoglobulin A than British children. J Trop Pediatr 1986;32:120–2. [25] Hawk PB, Oser BL, Summerson WH. Practical physiological chemistry. 13
ed. New York: The Blakiston Company; 1954. p 166–81.
[26] Robyt JF, White BJ. Biochemical techniques: theory and practice. Illinois: Waveland Press; 1987. p 2226–330.
[27] Draetta GF. Commentary on "A new cancer diagnostic system based on a CDK profiling technology.". Biochim Biophys Acta 2005;1741:226–33. [28] Narayana N, Diller TC, Koide K, Bunnage ME, Nicolaou KC, Brunton LL, et al.
Crystal structure of the potent natural product inhibitor balanol in complex with the catalytic subunit of cAMP-dependent protein kinase. Biochemistry 1999;38:2367–76.