Doctoral Program in Electrical and Computer Engineering
Faculty of Engineering of the University of Porto
Cell mobility and morphology joint
analysis in Biology assays
Tiago Esteves
Doctoral Program in Electrical and Computer Engineering
Faculty of Engineering of the University of Porto
Cell mobility and morphology joint analysis in Biology assays
Tiago Esteves
Supervisor:
Dr. Pedro Manuel da Silva Quelhas
Co-supervisor:Dr. Maria José Oliveira
Thesis submitted at the Faculty of Engineering of the Uni-versity of Porto - Electrical and Computer Engineering De-partment in order to obtain the PhD Degree in Electrical and Computer Engineering.
I would like to thank Pedro Quelhas, my advisor, for his academic guidance during my Ph.D. studies. His friendship, continuous help, guidance and support help me overcome the problems and enrich my knowledge and skills. Since my masters that I have been working under his su-pervision and he never let me down. I hope I have responded to his expectations as he answered mine.
Thanks to Maria Jose Oliveira, my co-supervisor, for her time and expertise and for provid-ing the images and videos used to validate the work developed. Thanks also to Maja Temerinac-Ott for her continuous support during the period that I have been in Freiburg, Germany. Maja was tireless in making sure that everything was perfect with me as well as all the people from FRIAS. I miss you all!
Thanks to my friends, classmates and to the lab members and staff I have worked with at Instituto de Engenharia Biomedica (INEB) for their friendship and periods of relaxation. Thanks also to Angela Carvalho for the images and the work we have performed together. We won the Best Poster Award with our work (twice!).
I also want to acknowledge my family for their help and encouragement in all the years of study and for their support and unconditional love.
Lastly, but certainly not in order of importance, I wish to express special acknowledgement to Raquel. We got married during this work period and without her love and presence and continuous encouragement I would not have finished this thesis. I am deeply grateful!
In conclusion, I recognize that this work would not have been possible without the finan-cial help of FCT (Fundacao para a Ciencia e a Tecnologia) and the facilities of Faculdade de Engenharia da Universidade do Porto and Instituto de Engenharia Biomedica.
"The work presented in this manuscript was developed in collaboration with Maria Jose Oliveira (Ipatimup) and funded by the Portuguese FCT (Fundacao para a Ciencia e a Tecnologia) in the framework of project UID/BIM/04293/2013. Tiago Esteves is recipient of SFRH/BD/80508/2011 by FCT. P. Quelhas is a Cien-cia2008 awardee."
O estudo da mobilidade de células cancerígenas, sob o efeito de diferentes meios/condições é fundamental para se proceder à validação de possíveis terapias para a sua regulação. Para avaliar a mobilidade das células cancerígenas, os investigadores desenvolvem geralmente ex-periências in vitro e a actividade celular é gravada em vídeos de microscopia. Neste proce-dimento, apenas através do uso de ferramentas quantitativas de análise automática é possível reunir provas científicas para com convicção apoiar os resultados biológicos. No entanto, a análise da mobilidade celular ainda é em grande parte um processo manual, o que se torna uma tarefa demorada e susceptível de ter um resultado diferente entre observadores. Desta forma a análise automática da mobilidade celular é essencial para a realização de estudos objetivos em grande escala.
Para se realizar a análise automática da mobilidade de células cancerígenas é necessário um método para estimar a posição das células ao longo do tempo. A posição das células é normalmente estimada através de técnicas de seguimento de objectos: seguimento por detecção-associação ou seguimento por modelação de um estado através do uso de técnicas como o Kalman filter ou o Particle filter. Na maioria dos casos as técnicas referidas baseiam-se na identificação das células antes do seu seguimento, utilizando para isso técnicas de segmentação de imagem, como binarização automática, segmentação por watershed, level sets e graph cuts. Actualmente também têm sido propostos detectores de pontos locais de interesse com bons resultados na identificação de células.
No âmbito da aplicação da análise da mobilidade de células cancerígenas em imagens de microscopia, foram testadas várias técnicas de visão computacional para a detecção e segui-mento automático de objectos, com o intuito de testar e comparar a viabilidade do seu uso em laboratório.
De forma a melhorar o desempenho do seguimento automático das células nós propomos incorporar a informação do aspecto/forma celular durante o processo de seguimento, com o objectivo de explorar a influência desta informação na direcionalidade do movimento celular. Com esta finalidade, desenvolvemos uma técnica de seguimento de objectos com o Particle filter, utilizando um modelo que incorpora a informação da forma e da mobilidade das células, explorando assim a relação entre estas duas propriedades. A metodologia proposta é explicada em detalhe nesta tese e comparada com as técnicas actualmente existentes no estado da arte.
Com o intuito de possibilitar aos investigadores a utilização do trabalho desenvolvido, nas suas tarefas de análise experimental, foi desenvolvido um programa informático (MobilityAna-lyser) para a detecção e seguimento celular. Este programa informático possibilita o seguimento de células de forma manual ou automática e analisa a mobilidade celular através do cálculo de
várias medidas de mobilidade. Esta análise da mobilidade é importante para caracterizar a mobilidade celular em cada experiência específica. Um outro programa informático (Bacteria-MobilityQuant) foi desenvolvido para o seguimento de bactérias com o intuito de classificar o seu comportamento sob diferentes condições de luz. Este programa informático quantifica automaticamente a mobilidade das bactérias em vídeos gravados ao longo do tempo. Por fim, também desenvolvemos um programa informático que identifica e remove padrões existentes no fundo de imagens microscópicas celulares. A existência destes padrões dificulta a detecção e seguimento das células. Esta ferramenta detecta automaticamente o padrão existente nas imagens e procede à sua remoção, possibilitando assim o seguimento das células e o estudo da sua mobilidade.
Por fim, participamos num desafio de seguimento celular, organizado no âmbito da con-ferência ISBI’15, onde tivemos a oportunidade de testar em vários tipos de imagens de micro-scopia algumas das metodologias propostas para a detecção e seguimento de celulas. Entre os vários participantes, a nossa equipa ficou classificada na 4aposição e fomos os únicos a apre-sentar resultados em todos os conjuntos de dados (tipos de células e modalidades de imagem diferentes).
Palavras-chave: Segmentação de células, seguimento automático de células, filtros locais de imagem, filtros de convergência local, modelação do estado de objectos.
The study of cancer cell mobility under different conditions is fundamental to dissect the associated molecular mechanisms and to validate possible therapies for its regulation. To evalu-ate cancer cell mobility, biologists established in vitro assays, recording time-lapse microscopy videos. In such procedure only through the use of quantitative automatic analysis tools is it possible to gather evidence to firmly support biological findings. However, cell mobility is still mostly analyzed by visual inspection alone, which is time consuming and prone to induce subjective bias. This makes automatic cell mobility analysis essential for large scale objective studies.
To perform the automatic analysis of cancer cell mobility assays a method to estimate the cell position through time is required. Cell’s positions are normally estimated using object tracking techniques: tracking by detection-association, state modeling tracking through the use of techniques such as the Kalman filter or through the use of Particle filters. In most cases the referred techniques are based on the identification of cells prior to tracking using image segmentation techniques such as automatic thresholding, watershed segmentation, level sets and graph cuts. More recently the use of local interest point detectors for this task has also been proposed with good results.
In the scope of the application of mobility analysis of cancer cells in brightfield microscopy, we applied several computer vision automatic object detection and tracking techniques with the aim of testing and comparing the viability of such methods for laboratory use.
In order to improve the performance of the automatic tracking of cells, we propose the incorporation of cell shape information during the tracking process, with the aim of exploring the influence of cell shape on the directionality of cell motion. With such aim, we developed a Particle Filter based joint tracker for cell shape and mobility, which uses the relationship between the two properties of cells. This proposed approach is explained in detail in this thesis and compared with the current techniques described in the state of the art.
In order to allow biology researchers to use our work in their experimental analysis tasks, we developed an easy to use software to perform cell detection and tracking called Mobility-Analyser. This software enables easy manual or fully automatic cell tracking and performs cell mobility analysis through the computation of several measures important to characterize the cell mobility in each specific in vitro assay. Another software called BacteriaMobilityQuant was developed for the tracking of bacteria in order to categorize their behaviour under different light conditions. This is also a user-friendly application that automatically quantifies bacteria mobility in recorded time lapse videos. We have also developed a software for background patterned surfaces removal from cell brightfield images. This tool automatically detects the
existing background pattern allowing for its removal from the original image, which enables tracking and mobility analysis of cells without background interference of the background.
Finally we have participated in the 3rd edition of the Cell tracking challenge organized in the scope of the ISBI’15 conference, where we had the opportunity to test some of the proposed cell detection and tracking approaches in multiple microscopy image types. Among several participants we ranked 4th and we were the only team to submit results for all the different datasets (different cell types and image modalities).
Keywords: Cell segmentation, shape estimation, local image filtering, local convergence fil-ters, cell tracking, object state modeling
2.1 Comparison between a brightfield and a phase contrast image of the same cell. 10 2.2 Example of DIC and fluorescence images: a) primary oocytes Spissula
solidis-simaof the surf clam where the gradients of shading in the image indicate re-gions of rapidly changing optical path length in the cell (Image from [68]), b) fluorescence image containing the root tip of Arabidopsis thaliana plant where in green it is visible the cell wall and in yellow it is visible the cell nuclei[28]. 11 2.3 Different time-lapse images from colon cancer cells obtained through
bright-field microscopy. 12
2.4 Image examples from the cell tracking challenge that includes: image on the left: fluorescence images of HeLa cells stably expressing H2b-GFP (2D), im-age in the center: DIC imim-ages of HeLa cells on a flat glass (2D), imim-age on the right: phase contrast images of Glioblastoma-astrocytoma U373 cells on a
polyacrylimide substrate (2D). 12
2.5 Brightfield images of cells on top of the three SiO2 thin films: a) Flat; b)
mi-cropatterned lines; c) mimi-cropatterned pillars. 13
2.6 Sample images used for the detection of immunogold particles. Each image has 4000x2600 pixels of dimension with particles diameter encompassing 8 to 20 pixels. In these samples it is possible to depict how the different structures can interfere in the detection of the immunogold particles due to: cellular
overlap-ping, tissues and background noise. 14
2.7 Example image with cyanobacterium Synechocystis sp. PCC 6803 on top.
Bac-teria are expected to move directly towards a light source. 14
3.1 Segmentation of drosophila cells in RNAi fluorescence images by using Otsu method. a) Original channel of the image; b) segmentation result by using Otsu
method [97]. 16
3.2 Image segmentation of neural stem cells using level sets. a) Original image; b)
Segmentation result [21]. 17
3.3 Image segmentation by watershed method. a) Original image; b) segmentation result using the classical watershed; c) segmentation result by using
marker-controlled watershed [96]. 18
4.1 Brightfield microscopy image of cancer cells (left) and corresponding manual
annotation done by an expert (right). 26
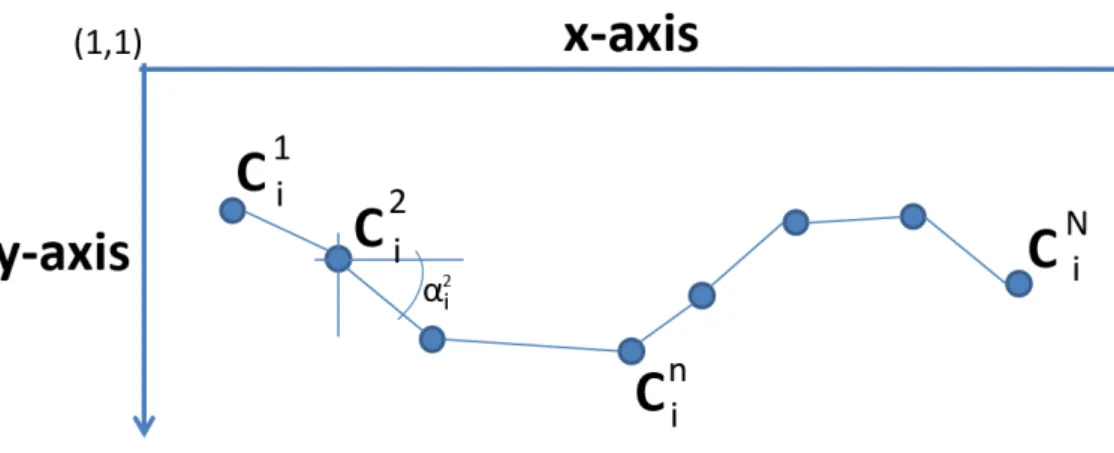
4.2 Sample trajectory of a cell i consisting of N time points where Cin= (xni, yni) are
the spatial position of the object in each frame n. 29
4.3 Persistence analysis of cell mobility: on the left it is visible three typical 10 hr cell trajectories. On the right it is displayed the mean-squared displacement divided by τ plotted as a function of τ. Random walk would give rise to a line with zero slope. Cyan lines represent data from the 3 trajectories on the top of
the image [54]. 30
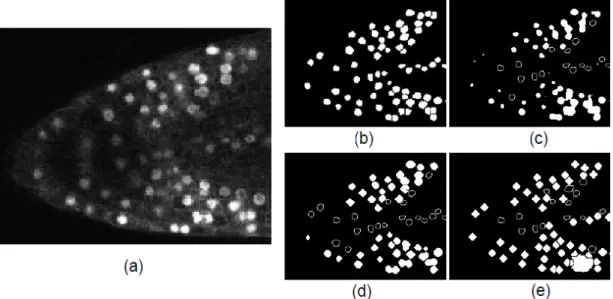
5.1 Segmentation results for the baseline methods applied to the problem of in vivo cell nuclei detection: (a) input image of the Arabidopsis thaliana plants root tip, (b) expert hand annotation, (c) Otsu thresholding, (d) level sets segmentation
and (e) watershed segmentation. 34
5.2 LoG based cell detection: a) Brightfield input image; b) LoG response from the input image; c) Detections overlaid in the image; d) Cells detections shown as
ellipses based on Hessian estimated eccentricity. 37
5.3 Ring filter matching: a) ring pattern similar to cell shapes, b) Ring filter bank where rc is the radius and w is the width of the ring, c) Ring filter response,
d) Detections overlaid in the original image. 38
5.4 Coin filter support region schematics (a) with N = 8 half-lines (support region can be seen in grey); filter image response (b) and obtained detections (c) [28]. 40 5.5 Iris filter support region schematics (a) with N = 8 half-lines (support region
can be seen in grey); filter image response (b) and obtained detections (c) [28]. 40 5.6 ARF filter support region schematics (a) with N = 8 half-lines (support region
can be seen in grey); filter image response (b) and obtained detections (c) [28]. 42 5.7 SBF filter support region schematics (a) with N = 8 half-lines (support region
can be seen in grey); filter image response (b) and obtained detections (c) [28]. 43 5.8 Example of cell segmentation by using local filters: a) Original brightfield
im-age with cancer cells, b) original imim-age manually annotated, c) segmentation result by applying the LoG filter, segmentation result by applying the adapta-tive ring filter (d), coin filter (e), LoG filter and Hessian matrix analysis for eccentricity estimation (f), iris filter (g), sliding band filter (h) and the ring filter
template matching (i). 45
5.9 Example results of the cell segmentation from the cell tracking challenge: orig-inal fluorescence image containing HeLa Cells (a) and fluorescence synthetic images with generated synthetic cells (d), b,e) manual segmentation results, c,f)
automatic segmentation results. 47
6.1 Example of detecting a pattern in an image given by a template: (a) original image, (b) template patch used to search in the image and (c) cross correlation response. The white rectangular on top of image (a) identifies the position of
high response location on image (c). 51
6.2 The SIFT local image descriptor: a) 8x8 set of image gradient samples, b)
6.3 Keypoint descriptors computed for each cell under analysis. 52 6.4 Differences between the random and the constant velocity state model: a) the
next state (yellow dot) is given by the previous state, b) the next state is given by the previous state plus an addition of the cell velocity in the previous frame. Red dots identify previous positions for the cell being tracked, the blue circles identify the detected cells in the current frame, and the green dot identifies the
closest detection from the predicted state. 54
6.5 Example of the Kalman filter loop: a) image showing the Kalman filter loop where the prediction is first performed (blue circle), followed by the measure-ment based on the prediction (green circle) and finally the measuremeasure-ment is used to correct the initial prediction based on the Kalman gain; b) video example of
a cell tracked by the Kalman filter. 55
6.6 A complete picture of the operation of the Kalman filter. 56
6.7 Description of the posterior probability density function 58
6.8 Example tracking results: a) tracking result of one cell considering the tracking by association approach (red continuous line) and the respective manual annota-tion (white dash line), b) tracking result for one dataset (Fluo-N2DH-GOWT1)
from the Cell Tracking Challenge. 60
6.9 Cell mobility analysis of unicellular cyanobacterium Synechocystis sp. on top of a culture without a light source (a) having a light source (lamp) on the up-per side of the cell culture (b), on the right side of the cell culture (c), and two light sources on both upper and right sides of the cell culture (d). The tracking results were obtained considering a detection-association approach and are dis-played in different colours where it is visible that all cyanobacteria travel in the
direction of the light source. 63
6.10 Cell mobility analysis of cyanobacteria tracking results: persistence results for cyanobacteria without a light source (a) and having a light source (b); cell dis-placement for cyanobacteria without a light source (c) and having a light source
(d). 64
6.11 Result of the tracking process considering detection-association with cell de-scriptors information: a) Track of several cells (presented in different colours) together with the GT track visible in white continuous line; b) Cropped images detailing the track of two cells (GT track presented in white continuous light
and our tracking result presented in colour dash line). 66
6.12 Result of the state estimation process for the particle filter: particle (green colour) weight is represented by the different circle sizes and the final state estimation (red circle) is obtained by the weighted sum of the particles. 68 6.13 Result of the tracking process using state modeling through the use of Kalman
7.1 Example of a typical cancer cell time-lapse movie frame (cropped), with detec-tion of final motility phenotypes overlaying the initial brightfield image.
Dif-ferent colors indicate difDif-ferent morphologies (eccentricity). 72
7.2 Cell persistence clusters (7 clusters). 73
7.3 Cell shape from one persistence cluster in consecutive frames. 73
7.4 Example of a cell persistence cluster from figure 7.2: left: we can observe that the persistence lines are strait with an high score indicating that cells are moving always with the same directionality; right: most frequent cell shape examples
that have the referred persistence. 74
7.5 Example of cells with the same cell morphology. In this case, elongated cells are displayed on the top images and the displacement of each cell morphology is displayed on the images from below, where it is visible that displacements are performed mainly according to the main axis of eccentricity of the cell. In the images from the right side, it is visible one example of elongated cell shapes with the main axis of eccentricity disposed horizontally, for which horizontal displacements are preferred (according to the information of the main axis of
eccentricity of each cell). 74
7.6 Example of a cell persistence cluster from figure 7.2: left: we can observe that the persistence lines have a low slope and are not straight which indicates that cells tend to stay in the same position and not to move, or at least move around its own position not moving to distant places; right: most frequent cell
morphology examples that have the referred persistence. 75
7.7 Example of mainly circular cell morphologies are displayed on the top images and the next displacement for each cell with this type of shape is displayed below. It is visible that displacements are performed randomly and to all the
possible directions. 76
7.8 Steps during cell detection: a) Brightfield frame with cells; b) LoG response; c) Detections overlaid in the image; d) Cells detection revealed as ellipses based
on Hessian estimated eccentricity. 77
7.9 Initial cell morphology acquisition of the cell to be tracked (burn in process of particle filter): a) Original image with the cell shape; b) Burn in process where several particles in different positions, with different sizes and shapes are created; c) Initial cell shape acquisition result as a mean of the different
weighted particles (considering position, size and shape). 80
7.10 Tracking process focused on the estimation of the cell position: a) Shape distri-bution according to the previously estimated cell shape (figure 7.9) from which particles are sampled and diffused; b) Particles diffused on top of the cell be-ing tracked; c) Measured particle weights (different circle sizes means different weights) where it is visible that higher weight is given to the particles in the cen-ter of the cell where the SIFT descriptor is probably more similar to the SIFT
7.11 Tracking process focused on the estimation of the cell size: a) Different cell sizes are considered (through the diffusion process); b) Estimated cell scale
according to particle weights. 81
7.12 Tracking process focused on the estimation of the cell shape: a) Different cell shapes are considered(through the diffusion process); b) Estimated cell shape
according to particle weights. 82
7.13 Close insight into the particles from cell A (blue up triangle) and the particles from the neighbor cells (different colours and shapes). It is visible that 2 par-ticles from cell A (blue up triangle) are very close to other parpar-ticles (red star particle and green circle particle). In this case, these particles weight is penal-ized. On the left it is visible the identification of the neighbor cells from cell A
and B (dash line) based on spatial proximity. 84
7.14 Tracking result of one cell considering the tracking by detection-association approach: top) tracking result by using Euclidean distance based association; down) tracking result by using our local eccentricity based distance. It is pos-sible to observe that in the final frame (min: 00:01:54:59:609) the Euclidean distance based association fails while the eccentricity based distance correctly
identifies the cell being tracked. 86
7.15 ROC curves for the evaluation of the cell detection task considering different methods: PF - particle filter during burn in; LoG Hessian - LoG filter considering the Hessian matrix of the image gradient on each detection location; LoG -LoG filter; IF - iris filter; CF - coin filter; ARF - adaptive ring filter; SBF - slid-ing band filter; RF - rslid-ing filter matchslid-ing. The results are available in percentage values and were obtained by varying the threshold value. For the case of the particle filter the results were obtained for different number of particles. 87 7.16 Segmentation fitness measure according to F1-score for cell shape estimation
for different detection methods: PF - particle filter during burn in; LoG Hes-sian - LoG filter considering the HesHes-sian matrix of the image gradient on each detection location; LoG - LoG filter; IF - iris filter; CF - coin filter; ARF - adap-tive ring filter; SBF - sliding band filter; RF - ring filter matching. Details on
section 5.3.2. 88
7.17 Execution times comparison between the particle filter and the LoG filter for the task of colon cancer cell detection in 1 brightfield image. The LoG filter results are presented in blue color line. For the particle filter different number of par-ticles were tested as well as different amount of cells to be detected (randomly selected): detection of all the cells in the entire image (red line); detection of only 20 cells (yellow line), 11 cells (black line), 5 cells (green line) and finally
only 1 cell (dashed black line). 89
8.1 Graphical user interface of the developed MobilityAnalyser software that allows for manual and automatic tracking of cells and mobility analysis and quatification. 92
8.2 Left - developed BacteriaMobilityQuant software. Right - cyanobacteria mo-bility analysis: schematic overview of the experimental set-up, followed by movement of cells with oblique illumination from two orthogonal directions, and then from both directions simultaneously. In each experimental example, the raw video data is followed by the same movie clip with the tracks of cells
superimposed. Time in minutes is indicated. Video from [81]. 94
8.3 Bacteria detection using the LoG filter. 94
8.4 Different micropatterned surfaces with cells on top (brightfield images): a) Flat
surface; b) Pillar pattern surface; c) Line pattern surface. 95
8.5 Background reconstruction and subtraction from the original image: a,d) origi-nal images; b,e) periodic background pattern detection and reconstruction; c,f) final result obtained from the subtraction of the reconstructed background
pat-tern from the initial original image. 96
8.6 Cell trajectory (a, b and c), travelled distance (d, e, f) and persistence analy-sis (g, h and i) of the MSCs on top of the silica thin films: a,d,g) flat; b,e,h)
5.1 Comparison between nuclei detection performance for all discussed methods. Results for all cells in the 32 fluorescence images of Arabidopsis thaliana plants.
All numbers are averaged results obtained over all images [28]. 44
5.2 Cancer cell detection and shape fit performance evaluation on 90 brightfield
images from one time lapse video. 44
5.3 2D Cell/nuclei segmentation results of each team. Missing values means that the specific team did not participated in the specific dataset. Our results are
presented in the bottom of the table (INEB-PT team). 46
5.4 3D Cell/nuclei segmentation results of each team. Missing values means that the specific team did not participated in the specific dataset. Our results are
presented in the bottom of the table (INEB-PT team). 46
6.1 Performance evaluation of the tracking results (percentage values), considering a detection-association approach using only the spatial distance. The results were obtained for 30 cells randomly chosen that were tracked on 156 brightfield
images from one time lapse video. 60
6.2 2D Cell/nuclei tracking results of each team. Missing values means that the specific team did not participate in the specific dataset. Our results are presented
in the bottom of the table (INEB-PT team). 61
6.3 3D Cell/nuclei tracking results of each team. Missing values means that the specific team did not participate in the specific dataset. Our results are presented
in the bottom of the table (INEB-PT team). 62
6.4 Cancer cell detection using a detection-association approach where k controls the influence of the distance between feature descriptors (Dccc and DSIFT) ac-cording to equation 6.3. The result values are presented in percentage. 65 6.5 Cancer cell detection using Kalman filter where k controls the influence of the
distance between feature descriptors (Dcccand DSIFT). The values are presented
in percentage. Higher values are presented in bold. 67
6.6 Cancer cell detection using Particle filter where k controls the particle weight estimation by considering the distance between feature descriptors (Dccc and DSIFT). The values are presented in percentage. Higher values are presented in
bold. 67
7.1 Performance evaluation of the tracking results (percentage values), considering a detection-association approach using only the spatial Euclidean distance and considering associations using eccentricity and LoG response information. The kparameter controls the influence of the LoG response information. The results were obtained on 21 brightfield images containing 81 colon cancer cells. 86
7.2 Tracking results obtained by the particle filter considering the motion and shape joint tracking approach. The results were obtained for 156 brightfield images of one time-lapse video where 30 cells were automatically tracked. The use of partitioned sampling was compared with the use of the classical particle filter and also the performance of using or not the interaction model was obtained. The total processing time was annotated for comparison (seconds). 90
Acknowledgements v
Resumo vii
Abstract ix
List of Figures xvi
List of Tables xviii
1 Introduction 1
1.1 Motivation 1
1.2 Cell Detection and Tracking in Microscopy Images 1
1.3 Objectives 2
1.4 Contributions 3
1.5 Thesis Organization 6
2 Cell Image Data 9
2.1 Brightfield Microscopy Images 9
2.2 Phase Contrast Microscopy Images 9
2.3 DIC Microscopy Images 10
2.4 Fluorescence Microscopy Images 10
2.5 Data used in this Thesis 12
3 State-of-the-art 15
3.1 Cell Detection 15
3.1.1 Baseline Segmentation Methods 15
3.1.2 Local Interest Point Detectors 19
3.2 Cell Tracking 20
3.2.1 Tracking by Association 20
3.2.2 Tracking Through State Estimation 21
3.3 Cell Lineage Estimation 22
4 Performance Evaluation and Metrics 25
4.1 Detection Evaluation 25 4.2 Tracking Evaluation 27 4.2.1 Tracking Accuracy 27 4.2.2 Coverage 27 4.2.3 Correct 28 4.3 Mobility Measures 28 4.3.1 Distance Travelled 28 xix
4.3.2 Velocity 29
4.3.3 Directionality 29
4.3.4 Persistence 30
5 Automatic Cell Detection 33
5.1 Segmentation Based Cell Detection 33
5.1.1 Otsu Automatic Thresholding 33
5.1.2 Watershed Segmentation 33
5.1.3 LevelSets Method 34
5.1.4 Graph Cuts 35
5.2 Local Interest Point Detectors 36
5.2.1 Laplacian of Gaussians 36
5.2.2 Ring Matched Filter 37
5.2.3 Local Convergence Filters 38
5.3 Results 42
5.3.1 Baseline Cell Detection 43
5.3.2 Local Interest Point Cell Detection 44
6 Automatic Cell Tracking 49
6.1 Tracking by Association Based on Spatial Distances 49
6.2 Tracking by Association Based on Local Descriptors 50
6.2.1 Cell Appearance Descriptors 50
6.2.2 Tracking Process 52
6.3 State Modeling Tracking 53
6.3.1 Kalman Filter 53
6.3.2 Particle Filter 56
6.4 Cell Tracking Results 59
6.4.1 Data 59
6.4.2 Tracking by Detection-Association Results 60
6.4.3 Tracking by Association Results - Local Descriptors 65
6.4.4 Tracking Using State Modeling Results 66
7 Joint Cell Shape and Mobility Model for Cell Tracking 71
7.1 Correlation between cell shape and dynamics 71
7.1.1 Tracking by Association Using Shape Information 76
7.1.2 Motion and Shape Joint Tracking 78
7.1.3 Cell Interaction 82
7.2 Cell Tracking Results 85
7.2.1 Tracking based on Spatial and Shape Information 85
8 Developed Software 91
8.1 MobilityAnalyser software 92
8.2 BacteriaMobilityQuant tracking software 93
8.3 Background pattern removal 95
9 Conclusion 99
A Cell Tracking Challenge methodology description 103
B MobilityAnalyser manual 107
C CyanoBacteriaQuant tracking manual 117
1.1
Motivation
The analysis of cell mobility is fundamental in order to achieve a better understanding of com-plex cellular responses such as cell invasion and for the development of possible therapies for its regulation. Usually, for studying cell mobility, cells are placed on top of native surfaces or of extracellular matrix-coated surfaces and a time lapse video is collected along their motion and interaction with the substrate.
Given the large amount of images resulting from such mobility assays there is a need to de-velop automatic analysis methods to aid researchers cope with the amount of data and increase the objectivity of the resulting analysis. Manual image interpretation, while still widely used, is only possible for a limited number of images and is constrained by user subjectivity, therefore automatic methods for cell segmentation and tracking are needed.
1.2
Cell Detection and Tracking in Microscopy Images
In the last decade, improvements in automated microscopy have enabled researchers to conduct new types of experiments, such as high throughput time-lapse microscopy. This tool is used to image hundreds of cells over many days and has been successfully applied in the research of biological findings related with the regulation of cancer cells.
The automatic analysis of cancer cell mobility has gained increasing relevance given the amount of data that biology researchers have to analyze. Cell mobility analysis is fundamental for the understanding of cancer cell migration, animal tissue development and for the quantifi-cation of biomaterials’ cell compatibility performance. Additionally, cell morphology analysis is fundamental for cell identification and characterization. In this analysis only through the use of quantitative automatic analysis tools is it possible to gather evidence to firmly support biolog-ical findings. However, most biology researchers still analyze cell mobility by visual inspection alone, which is time consuming and prone to induce subjective bias. This makes automatic cell accurate detection and tracking essential for large scale, objective studies of cells.
In this work we are specifically interested in analysing cells from images captured in bright-field microscopy. In general, using a brightbright-field microscopy has several benefits such as not being subject to any toxicity effect which is present when acquiring long-term time-lapse fluo-rescence images and the possibility to measure more descriptive features like texture and shape simultaneously. However, the development of automatic image processing methods for bright-field experiments holds several challenges because cell images by brightbright-field microscopy have heterogeneous intensity levels and are badly contrasted [11]. Also differences in illumination over time and across cell culture plates, associated with the mentioned image issues, makes the development of cell detection and tracking algorithms not an easy task. To handle illumination
changes, techniques such as background subtraction can be used where the difference between an image frame and a reference frame is computed focusing only on the moving objects. The reference frame can be obtained by different techniques such as background modeling or a-daptive median filtering. The use of local filters can also handle the problem of differences in illumination, since these filters are robust to this effect.
In this thesis we start by addressing the problem of cell detection in brightfield images since the available automatic image processing frameworks are mostly developed for fluorescence images that do not work properly with brightfield microscopy images. For this task we propose the use of local interest point detectors such as local convergence filters, ring filter template matching approaches and the use of the Laplacian of Gaussian filter. We demonstrate the ro-bustness in cell detection and computational efficiency of these methods.
Given a method to estimate the cell position in an image it is possible to analyse cell mo-bility by following each cell position through time. When dealing with large amounts of data, such analysis must be performed through automatic image tracking. This can be performed by association after cell detection or by state modeling. We tested and compared both techniques showing advantages and limitations of each. We started by testing tracking by detection asso-ciation and by including similarity measures between cells to aid the tracking process. We also tested the use of state modeling based tracking through the use of Kalman and Particle filters.
Finally, it is known that cell morphology plays an important role on cell mobility more precisely in the directionality and randomness of the cell movement. Based on that, we propose an approach that is capable of modeling cell morphology and cell mobility jointly. By modeling cell motion together with cell morphology, and applying it to cell tracking, we are able to improve the tracking process. In this approach we explore the correlation between cell shape and cell mobility constructing a model used by the Particle Filter that obtains better automatic tracking results.
1.3
Objectives
The aim of this work is to achieve results that exceeded the current state of the art in automated cell mobility analysis. The adoption of object detection, tracking and recognition techniques, based on state-of-the-art computer vision and machine learning approaches, is aimed at higher robustness and performance. Techniques for cell detection such as local interest point detectors are studied and analyzed. The analysis of cell shape is performed either by cell shape estimation in the detection process or cell shape characterization using image descriptors. For cell tracking, techniques based on detection-association and motion modeling approaches are considered. As our main goal we aim at a joint shape and motion model of cells which can better handle motion variability and cell interaction.
The following constitute the main scientific and technical objectives of the thesis:
• Collection and organization of data from cancer cell mobility assays using brightfield microscopy;
• Study of the state-of-the-art in: cell detection, including traditional segmentation methods and local interest point detectors; tracking, performed considering a detection-association approach or motion modeling; cell shape characterization through the use of cross corre-lation and SIFT descriptors and cell shape estimation based on the detection methodolo-gies;
• Implementation and evaluation of different cell detection and tracking approaches: cell detection in brightfield images, based on local interest point detectors (local convergence filters, ring filter template matching and Laplacian of Gaussian filter), where the detec-tion and shape estimadetec-tion is performed together; cell tracking, performed considering a detection-association approach with and without the addition of cell shape information, in specific cell eccentricity and also cell shape descriptors; cell tracking by state modeling by assuming two different motion models (random and constant velocity) and comparing the performance of considering cell shape and appearance characterization;
• Identify cell behaviors such as alterations of cell morphology in order to improve the performance of the tracking process and be able of following automatically any cell at any time point of the time-lapse videos under analysis;
• Model changes in cell shape together with mobility to get knowledge that can be used in the tracking process;
• Perform cell mobility studies including measurements on main trajectories, persistence analysis, distance and velocity of migration and other measures that are considered fun-damental for mobility analysis by the biologist researchers and correlate it with the assays; • Implement new cancer cell tracking and analysis tools using local filter based detection jointly with cell shape characterization and modeling of cell interactions; develop new tools that could be easily used by biologist researchers to perform analysis of their assays and obtain mobility analysis through different quantifications.
We anticipate that this effort will result in a set of methodologies with impact in microscopy image analysis system performance in the area of bioimaging.
1.4
Contributions
The developed work meets the objectives and resulted in the next summarized contributions: Comparison of cell detection and shape estimation methods: We compared and analysed several classical segmentation techniques and the use of local interest point filters, such as local convergence filters, a ring filter matching approach and the scale-normalized Laplacian of Gaussians filter for the task of cell detection and segmentation. The work performed is
described in this thesis and was published in related journals and international and national conference proceedings:
• R. Gamelas Sousa, T. Esteves, S. Rocha, F. Figueiredo, P. Quelhas, and L. M. Silva, Automatic Detection of Immunogold Particles from Electron Microscopy Images, ICIAR, LNCS Volume 9164, pages 377-384, 2015.
• T. Esteves, Maja Temerinac-Ott, P. Quelhas, 4th place on the Cell Tracking Challenge organized on the scope of the ISBI 2015. Publication on journal is on progress.
• R. Gamelas Sousa, T. Esteves, S. Rocha, F. Figueiredo, Joaquim M. de Sa, Luis A. Alexandre, Jorge M. Santos, Luis M. Silva, Transfer Learning for the Recognition of Immunogold Particles in TEM imaging, IWANN, LNCS Volume 9094, Springer Verlag, 2015.
• T. Esteves, M. Jose Oliveira, P. Quelhas. Cancer Cell Detection and Morphology Analysis Based on Local Interest Point Detectors. IbPRIA, LNCS Volume 7887, Springer Verlag, pages 624-631, 2013.
• T. Esteves, M. Jose Oliveira, P. Quelhas, Local interest detector based cancer cell mobility and morphology joint analysis, RecPad, 2012.
• T. Esteves, M. Jose Oliveira, P. Quelhas, Local interest detector based cancer cell mobility and morphology joint analysis , International Symposium in Applied BioImaging, 2012. • T. Esteves, P. Quelhas, Ana M. Mendonça, A. Campilho. Gradient convergence filters
and a phase congruency approach for in vivo cell nuclei detection. Machine Vision and Applications, Volume 23, Issue 4, pages 623-638, 2012.
Comparison of methods for cell tracking: We started with the implementation of the cell tracking method based on the detection-association technique, which makes use of the spatial location information of cells. We then tested the addition of similarity measures between cells, through the use of cell appearance descriptors (image pixel information and SIFT descriptors). Next, we started focusing on performing tracking of cells considering state modeling based tracking approaches through the use of Kalman and Particle filters. We also tested the use of cell descriptors in order to perform similarity measures between cells and add this information to the tracking process. With these techniques we also tested different dynamics for the state. The work performed is also presented in this thesis and it was published in the following publications and conference proceedings:
• T. Esteves, Maja Temerinac-Ott, P. Quelhas, 4th place on the Cell Tracking Challenge organized on the scope of the ISBI 2015. Publication on journal is on progress.
• T. Esteves, M. Jose Oliveira, P. Quelhas, Cancer cell tracking using a Kalman filter, Rec-Pad, 2013. =>(Received the Best Poster Award)<=
• T. Esteves, M. Jose Oliveira, P. Quelhas, Cancer cell mobility analysis based on local interest point detectors, 2nd International Symposium in Applied BioImaging, 2013. • T. Esteves, M. Jose Oliveira, P. Quelhas. Cancer Cell Detection and Tracking Based
on Local Interest Point Detectors, ICIAR, LNCS Volume 7950, Springer Verlag, pages 434-441, 2013.
Automatic approach for background pattern removal: We proposed a novel approach to detect and extract the existing periodic background pattern in brightfield images. The approach is based on the analysis of keypoints periodicity obtained from each image. The removal of an existing background pattern improves the task of cell detection and tracking. The work is described in this thesis and also in the next publications and proceedings:
• T. Esteves, Angela Carvalho, Fernando Jorge Monteiro, P. Quelhas, Detection and removal of periodic background patterns for improving of cell tracking analysis, DCE -2015 Symposium on Electrical and Computer Engineering, FEUP, Porto, Portugal, -2015. =>(Received the Best Poster Award)<=
• T. Esteves, Angela Carvalho, Fernando Jorge Monteiro, P. Quelhas, Periodic background pattern detection and removal for cell tracking, LNCS ICIAR, Volume 8815, Springer Verlag, pages 123-131, 2014.
Joint shape and mobility model for cell tracking: We performed the study of the correlation between cell morphology and cell mobility in experimental in vitro assays performed by biolo-gical researchers. We have found evidences to support that cell morphology plays an important role on the directionality and randomness of the cell movement. We have manually annotated several datasets (both cell position and cell shape) in order to experimentally identify this rela-tionship between cell morphology and cell mobility. Through this study, we identified that for a specific type of cell movement there is a frequent type of cell morphology. Given this informa-tion, we worked on the construction of a model that related cell motion with cell morphology changes, in order to improve the cell tracking process. The work is explained in detail in this thesis and it was submitted to an international related journal:
• T. Esteves, A. Pinto, M. José Oliveira and P. Quelhas, Cell mobility and morphology joint analysis in Biology assays, Bioinformatics (under review) 2016.
Software for cell tracking: We developed an easy to use software to perform cell detection and tracking to allow biology researchers to use our work in their experimental analysis tasks. It allows the user to choose between two possible operation modes: manual and automatic.
Different versions of the software include different tracking approaches that were developed throughout the thesis work period. We developed one version considering a simple detection-association tracking approach, a version where the use of cell descriptors was included to im-prove the tracking process and a version with the use of state modeling approaches for cell tracking with the use of the Kalman filter and the use of the Particle filter. Finally, a version that uses the particle filter with the developed joint shape and mobility model for cell tracking was also developed. In all the developed softwares, the mobility analysis includes measurements on main trajectories, persistence analysis, distance and velocity of migration and an excel file is created having this information, as well as a video file containing the tracks of each cell. The developed software was submitted for publication and published in national proceedings:
• A. Carvalho, T. Esteves, P. Quelhas, Fernando Jorge Monteiro, CellTracking: quantifica-tion of mesenchymal stem cells migraquantifica-tion on different micropatterned surfaces, Bioinfor-matics (under review), 2016.
• A. Carvalho, T. Esteves, P. Quelhas, F.J. Monteiro, An automated Matlab tool to quantify cell migration on micropatterned surfaces, 4th I3S Annual Meeting, 2014.
Software for bacteria mobility analysis: We also developed a specific tool for the task of bacteria automatic tracking and mobility analysis named BacteriaMobilityQuant software. This software is now being used to perform the automatic quantification of cyanobacteria mobility in time-lapse videos. The developed software was published in the next international journal:
• N.Schuergers, T. Lenn, R. Kampmann, M. Meissner, T. Esteves, M. Temerinac-Ott, J. Korvink, A. Lowe, C. Mullineaux, and A. Wilde, Cyanobacteria use micro-optics to sense light direction. eLife, 5:e12620, 2016.
1.5
Thesis Organization
The next chapter introduces the cell image data used in this study while chapter 3 presents the existing techniques from the state-of-the-art applied to the images.
Chapter 4 introduces both the performance evaluation measures used in the evaluation of the techniques tested and the mobility measures used to quantify and characterize cell displacement. Chapter 5 includes the cell detection techniques applied for the segmentation and shape estimation of cells. Each method is explained and the results are presented.
Chapter 6 presents the tracking methodology. Tracking by detection-association and track-ing by object state modeltrack-ing techniques are explored and tested and the results are presented and compared.
In chapter 7 a new methodology to perform cell tracking is proposed where the correlation between cell shape and cell mobility is explored. The method is fully described and tested and the results are presented and compared with the existing techniques results.
In Chapter 8 the developed tools are presented and described in detail. The first is the MobilityAnalyser software that allows to perform cell tracking and cell mobility analysis and the second is the CyanoBacteriaQuant software to perform tracking of bacteria and mobility analysis in videos with different light conditions.
Cells and substructures of cells can be observed using many different forms of light microscopy varying from brightfield microscopy [26, 18] to phase contrast images [19, 9, 4], differential interference contrast (DIC) [19, 68] or fluorescence images [68]. The applicability of this wide range of techniques differs from one situation to another depending on specific objectives, the type of detail wanted and also the availability of the techniques.
In this work we are mainly interested in data obtained by light microscopy techniques such as brightfield, phase contrast and DIC microscopy. These techniques are often used for live cells and long-term biological experiments because of the possibility to observe cells without fixing and staining [68]. Currently, such observations can be performed using fully automated micro-scopes, which implies the generation of large amounts of data. Next we will briefly introduce the data obtained from the microscope techniques considered in this work.
2.1
Brightfield Microscopy Images
A brightfield microscope forms images of a given sample by light transmission. Only the spe-cimens that have some property that affects the amount of light that passes through them, can be visualized using these type of microscopes [19, 20].
If live cells need to be imaged as a time sequence, and imaging is performed on several parts of the specimen, the best approach is to use an automated microscopy system. This will minimize the errors that can be made by manually changing between the different locations of the specimen. A system performing live cell imaging, needs a specially controlled atmosphere that mimics the cells’ environment to assure cell viability and to guarantee cell natural behavior. A practical system also requires the ability to perform auto-focusing in a suitable manner. If such an auto-focus mechanism is not used, another option is to acquire a stack of images from different focal planes for each section. This stack can then be used later, to obtain the best focused slice [19, 20, 21].
On the brightfield microscopy, samples are illuminated by white light. Contrast in the sam-ple is caused by absorbance of some of the transmitted light in dense areas of the samsam-ple. The typical appearance of a brightfield microscopy image is presented in figure 2.1 where a dark sample is visible on a bright background.
2.2
Phase Contrast Microscopy Images
Phase contrast microscopy works in a similar way as brightfield microscopy. The difference is that it adds a conjugate pair of condenser annulus placed in front of the source light and a phase plate at the rear focal plane of the objective lens into its optical system. It enables the separation between the illuminating background light from the foreground light resulting in a high image
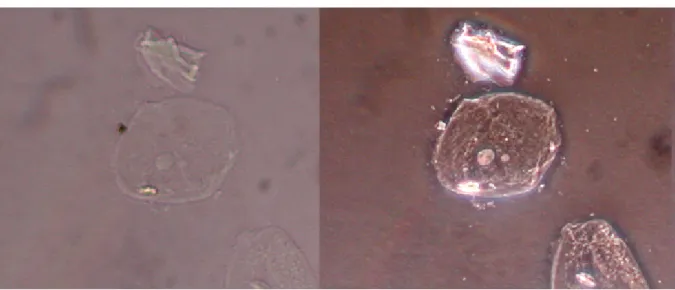
Figure 2.1 Comparison between a brightfield and a phase contrast image of the same cell.
contrast [97]. Phase contrast microscopy images are obtained by transforming changes in the phase of waves (diffracted by objects) to differences in the image. This makes objects to appear as if they were optically stained [68]. In figure 2.1 is visible the difference between brightfield and phase contrast images.
2.3
DIC Microscopy Images
Differential interference contrast (DIC) microscopy images are obtained through a beam-shearing interference system that transforms the gradient of optical paths in an object into regions of contrast in the object image. In the DIC microscope, an object is intersected by two optically distinct wavefronts that become deformed in their optical path length. Those differences in the optical path are translated in changes in the image amplitude 2.2 - a. The specimen (object) regions where an increase in the optical path is verified appear as brighter or darker regions in the image. In the other hand, regions where the optical path decrease appear in reverse contrast. Checking the behavior and form of wavefronts, it is clear that the image contrast and definition are affected by the phase displacement amount introduced by the operator [68].
2.4
Fluorescence Microscopy Images
Fluorescence microscopy is based on the atoms or molecules emission of photons whose elec-trons are stimulated to a higher state of excitation by energy from an outside source [68]. Molecules that have the ability of fluorescing are known as fluorescent molecules or fluo-rochromes. When the conjugation between a fluorochrome and a large macromolecule occurs
(a) (b)
Figure 2.2 Example of DIC and fluorescence images: a) primary oocytes Spissula solidissima of the surf clam where the gradients of shading in the image indicate regions of rapidly changing optical path length in the cell (Image from [68]), b) fluorescence image containing the root tip of Arabidopsis thaliana plant where in green it is visible the cell wall and in yellow it is visible the cell nuclei[28].
(through a simple adsorption or a chemical reaction), the macromolecule is said to have a fluo-rophore, the chemical portion able of fluorescence production. Fluorochromes have distinct excitation and emission spectra which is only dependent on their electron resonance properties and atomic structure [68].
Fluorescence microscopy uses special filters and employs a unique method of image illumi-nation in order to obtain images of fluorescent light that is emitted from excited molecules in a specimen. The filters are design to isolate and manipulate two distinct sets of excitation and emission fluorescent wavelengths. One band, having shorter excitation wavelengths is directed from the illuminator and filters to the specimen. Other band, with longer fluorescence wave-lengths emitted from the specimen, forms an image of the specimen in the image plane. To perform fluorescence microscopy effectively, the researcher must select properly the adequate fluorochrome, as well as filters and the right illuminator for the specific application. The evalu-ation of the quality of fluorescence signals is also essential [68]. An example of a fluorescence microscopy image, containing the root tip of Arabidopsis thaliana plant, where the cell wall is visible in green and nuclei are visible in yellow, is available on figure 2.2 - b.
Figure 2.3 Different time-lapse images from colon cancer cells obtained through brightfield microscopy.
Figure 2.4 Image examples from the cell tracking challenge that includes: image on the left: fluores-cence images of HeLa cells stably expressing H2b-GFP (2D), image in the center: DIC images of HeLa cells on a flat glass (2D), image on the right: phase contrast images of Glioblastoma-astrocytoma U373 cells on a polyacrylimide substrate (2D). Images from the Cell tracking challenge website.
2.5
Data used in this Thesis
Despite concerted efforts to develop cell segmentation methods for the aforementioned image types in recent years, cell detection and tracking still remains a challenging problem that we plan to address. In order to assess the performance of the cell detection and shape estimation methods tested as well as the proposed cell tracking methods applied we use different microscopy image types from different problems where cell mobility analysis was required.
Our main focus in this work was the analysis of brightfield images of cancer cells that were seeded on native surfaces or on surfaces coated with extracellular matrix components, where we tested both cell detection and tracking methodologies. In this in vitro assays the analysis of the cancer cells mobility is very important in order to gather evidences that firmly support biological findings. The used brightfield images are presented in figure 2.3 where we automatically performed the study of cell mobility.
We have also explored additional types of data as a result of participating in the Cell tracking challenge organized in the scope of ISBI international conference that was held in Brooklyn, New York. Several examples of the images used are presented in figure 2.4. In this problem the
Figure 2.5 Brightfield images of cells on top of the three SiO2 thin films: a) Flat; b) micropatterned lines; c) micropatterned pillars.
analysis of cell mobility is fundamental for understanding the mechanobiology of cell migration and its multiple implications in both normal tissue development and many diseases. The ability of cells to exert forces on their environment and alter their shape as they move is also essential to various biological processes, such as the immune response, embryonic development or tu-morigenesis1. This organized challenge is an effort to evaluate and compare the state of the art of tracking methods in both cell and nucleus cases. The data used is both real and synthetic and considering 2D and 3D images of time-lapse microscopy videos of nuclei and cells. The com-puter generated video sequences simulate nuclei moving in realistic environments. The datasets are based on sequences of nuclei or cells, fluorescently stained, moving on top of substrates and microscopy videos of Phase Contrast and Differential Interference Contrast images of cells moving on a flat substrate of varying rigidity. We were among the four winning teams of the Third Cell Tracking Challenge Bitplane attendance awards.
We have also performed the analysis of brightfield images of Human Bone Marrow Stromal Cells (hBMSCs) grown on top of patterned substrates (figure 2.5) [13]. The analysis of cell be-haviour when interacting with different micropatterned surfaces has gained increasing interest in the last years. Biologist researchers started producing micropatterned surfaces on bioma-terials to study the possibility to modulate cell behaviour only through topography stimulus of biomaterials. Those cell/surface interactions are analyzed in order to access cell metabolic activity, adhesion morphology, proliferation and lineage differentiation. Measurements of cell alignment, elongation and guided mobility on the surface are essential to confirm these interac-tions.
Electron microscopy images were also evaluated where we applied our cell detection meth-ods for the detection of immunogold particles. The immunogold labeling technique is used to permit the study of different types of cell wall growth and to understand if there are relevant
1http://www.codesolorzano.com/celltrackingchallenge/Cell_Tracking_
Figure 2.6 Sample images used for the detection of immunogold particles. Each image has 4000x2600 pixels of dimension with particles diameter encompassing 8 to 20 pixels. In these samples it is possible to depict how the different structures can interfere in the detection of the immunogold particles due to: cellular overlapping, tissues and background noise.
Figure 2.7 Example image with cyanobacterium Synechocystis sp. PCC 6803 on top. Bacteria are expected to move directly towards a light source.
differences on their composition and if their transport capabilities are similar. Immunogold particle detection is an extreme time-consuming task and therefore, we tried to perform that automatically on images as the ones presented in figure 2.6 [84].
For the aforementioned cell detection and tracking problems we have developed a tool to facilitate the use of our proposed methodologies by the biologist researchers. This tool is pre-sented on Chapter 8.
Finally we have also analysed with brightfield images of cyanobacteria (cyanobacterium Synechocystis). This work was performed in collaboration with the Freiburg Institute for Ad-vanced Studies (FRIAS2) on the automatic tracking of cyanobacteria in brightfield images (ex-ample images used in this study is presented in figure 2.7). Our main objective was to study the bacteria mobility in response to a light in order to understand how cells sense the position of a unidirectional light source. We performed automatic tracking of bacteria by using a developed tool that will be presented in this thesis (Chapter 8).
The automatic analysis of cell mobility based on time-lapse microscopy images has gained relevance due to the increase in data amount that biology researchers analyze [1, 5, 39, 41, 52, 82]. Manual cell tracking by an expert can take weeks of tedious work, while the results can be imprecise and subject to interobserver variability [53]. Through the automated tracking of cell populations in digital images, it is possible to obtain quantitative, systematic and high-throughput spatiotemporal measurements of a range of cell behaviors: migration [1, 39, 41, 43, 82], mitosis [5, 16, 39], apoptosis [39, 52], and cell lineage [1, 16, 39, 52]. This capability is highly valuable for research in genomics, proteomics, stem cell biology, immunology, cell biology and tissue engineering.
3.1
Cell Detection
The vast majority of state-of-the-art cell tracking approaches rely on segmentation for cell de-tection. Several image segmentation approaches have been applied to detection of live cells in microscopy images [39, 43, 82]. Automatic thresholding segmentation [28], active con-tours [92], level sets [94, 15, 51], region growing [85] and watershed [28, 63] are some of the most used segmentation techniques applied to perform cell detection. Alternative approaches for cell detection have recently been proposed such as local interest point filters that can de-tect characteristic locations of interest in the image [28]. Based on the general convexity of cells’ shape, the use of local filters for cell detection and analysis has been applied through the use of automatic scale detection methods [12, 33, 77, 88] and also local convergence fil-ters [16, 28, 62, 75].
3.1.1 Baseline Segmentation Methods
Automatic image segmentation is a fundamental problem in computer vision [65]. The specific methods for segmentation applied to cell detection range from image thresholding [28], in the case of high contrast between cells and background, to more advanced methods such as level sets [94]. In the case of touching cells, where cells are spatially close, watershed transform is widely used, considering the image intensity levels [28, 63].
In automatic thresholding segmentation, an adequate threshold of gray level is selected to extracting objects from their background. The basis for this segmentation algorithm is the assumption that the image has a bimodal greylevel distribution, that is, its histogram has a valley between two peaks. Assuming that one peak is related to the objects and the other to the background, objects of interest are detected. The main drawbacks of this technique are that it cannot handle touching/overlapping objects and that results are too tightly coupled with the thresholds used. This results in the frequent need to redefine optimal parameters for specific image conditions, making this method semi-supervised at best. One example of the use of
(a) (b)
Figure 3.1 Segmentation of drosophila cells in RNAi fluorescence images by using Otsu method. a) Original channel of the image; b) segmentation result by using Otsu method [97].
this method in cell segmentation is presented in figure 3.1 where drosophila cells in RNAi fluorescence images are segmented. Even after attenuating image noise and regulating image intensity variations, results are usually not directly usable in real imaging applications [28].
Ali et al. improved cell detection on adherent eukaryotic cells from brightfield microscopy images by performing a cell boundary segmentation after cell detection [2]. In their work, cells are first identified using a thresholding based on defocused images, where cells are represented by blurred regions. Finally, the cell boundary is segmented by first computing the local phase and local orientation images that are afterwards used to guide the evolution of a level set-based active contour, which produces the final cell boundary segmentation.
Kong et al. presented a technique based on adaptive threshold for the automatic segmenta-tion of human brain tumor cells of fluorescence microscopic images for the quantitative analysis of cell biological properties [47]. First the image gradient field is regulated by gradient vector flow and next the gradient modes are identified, which are the places where the gradient vec-tors points to. Given this, image regions in which the gradient points to the same mode are finally grouped. Since not all of these regions represent the foreground of the cell, the adaptive Otsu thesholding technique is used to find the optimal threshold maximizing the between-class variance. In this way, the obtained regions are only related to cell regions.
Kaakinen et al. proposed the automatic detection of different cell types in phase contrast images based on maximally stable extremal regions (MSER) [42]. This technique identifies re-gions in an image that remain stable over a range of threshold levels. After that, a morphological erosion is applied from which the centers of the obtained regions are identified.
Xing et al. present an automatic cell segmentation method of neuroendocrine tumor (NET) images based on active contours [92]. A voting-based seed detection algorithm was employed to localize cell centers on each image and initialize one contour per seed. An active contour model was then applied to achieve the segmentation of cells where an unsupervised shape prior
(a) (b)
Figure 3.2 Image segmentation of neural stem cells using level sets. a) Original image; b) Segmentation result [21].
constrain is incorporated to reduce local variations but preserve global changes among different shapes in order to handle weak or misleading cell boundaries.
Xiong et. al. proposed the use of level sets for the nuclei and cytoplasm segmentation of drosophila cells in RNAi fluorescence images [94]. Nuclei are first extracted, labeled and used as starting points for the segmentation of the cytoplasm. Based on a rough segmentation, the authors have introduced a new force into the classical level set curve evolution to improve the performance for odd shapes, such as spiky or ruffly cells. Deformable models based on level sets do not require explicit parametrization nor suffer from topology constraints [15, 51]. However, these methods require an initial contour from which is possible to start the evolution of the contour curve [93]. As in the case of finding seed points in the watershed method, finding an initial segmentation is usually as difficult as the initial segmentation problem. Level sets contour evolution is capable of adapting to a variable number of objects while preserving spatial coherence. However, it is unable to solve the problem of touching cells which exhibit weak or no edges across their touching boundaries. In figure 3.2 the result of neural stem cells segmentation, using this method, is presented. The level set is initialized by using a multi-scale Laplacian of Gaussian to find cell locations [21].
Nosrati et al. also presented a level set technique with star-shape prior, applied in the seg-mentation of overlapping cervical cells, in Pap smear images [69]. A Voronoy energy term was introduced which controls how much neighbouring cells can overlap.
Tscherepanow et al. proposed the use of active contours for the segmentation of cells in brightfield microscope images [87]. First the background was separated from the foreground based on a top-hat morphological operator and a threshold technique. Afterwards, morpholog-ical operators were used to find the cell membrane pixels considering the gradient magnitude image. Given these two steps, cell markers are afterwards detected as points that maximize the distance to the image background and membrane pixels. Finally an active contour is applied to obtain the final cell segmentation result.
(a) (b) (c)
Figure 3.3 Image segmentation by watershed method. a) Original image; b) segmentation result using the classical watershed; c) segmentation result by using marker-controlled watershed [96].
However, the application of the aforementioned methods to cell segmentation is not trivial as it relies on the separation of individual cells that can be overlapping or touching each other [67]. To address the problem of touching cells the distance transform algorithm and the watershed transform can be applied.
The watershed transform addresses the problem of separating touching objects through an immersion simulation approach. The input image is considered as a topographic surface which is flooded by water starting from regional minima. Watershed lines are formed on the meeting points of water coming from distinct minima. All pixels associated with the same catchment basin are assigned to the same label [7, 63]. Since real digitized images present many regional minima in their gradients, this approach typically results in oversegmentation. One way to reduce this problem is through the use of seeds or markers. In this case, topographic flooding originates only from seed locations, which limits the final number of regions. In figure 3.3 it is possible to observe results of cancer cell segmentation in time-lapse fluorescence image sequence using the classical watershed and watershed with markers [96]. While this makes for a robust solution, the search for the number and location of such seeds is usually a problem of difficulty similar to that of the original segmentation problem.
Graph cuts also have been applied in the segmentation of cells in phase contrast images by Bensch et al. [3]. Considering that in phase contrast microscopy the cell borders appear as a dark-to-bright transition in outwards transition, the use of asymmetric boundary costs were proposed in order to promote low costs at cells boundaries. A min-cut segmentation algorithm is applied considering the asymmetric boundary costs, resulting in the segmentation of the cells. Stoklasa et al. used the region growing technique for the segmentation of tightly packed cells in phase-contrast images [85]. Markers are first detected and classified as superpixels within the cell (cell nucleoli), which are used to simplify the image in classes (cell, border-inside, border-outside and background). Finally, for each detected marker, a region growing method is used to grow it until reaching the surrounding marker borders. Borders that adjoin
![Figure 2.2 Example of DIC and fluorescence images: a) primary oocytes Spissula solidissima of the surf clam where the gradients of shading in the image indicate regions of rapidly changing optical path length in the cell (Image from [68]), b) fluorescence](https://thumb-eu.123doks.com/thumbv2/123dok_br/15131616.1010854/33.892.152.749.216.564/example-fluorescence-spissula-solidissima-gradients-indicate-changing-fluorescence.webp)


![Figure 3.2 Image segmentation of neural stem cells using level sets. a) Original image; b) Segmentation result [21].](https://thumb-eu.123doks.com/thumbv2/123dok_br/15131616.1010854/39.892.144.758.212.446/figure-image-segmentation-neural-cells-original-segmentation-result.webp)
![Figure 3.3 Image segmentation by watershed method. a) Original image; b) segmentation result using the classical watershed; c) segmentation result by using marker-controlled watershed [96].](https://thumb-eu.123doks.com/thumbv2/123dok_br/15131616.1010854/40.892.121.786.213.451/segmentation-watershed-original-segmentation-classical-watershed-segmentation-controlled.webp)