ALI
BAGHI ZADEH
Acoplamento da deformação e dos campos
magnético e de polarização elétrica em materiais
multiferróicos
Coupling of magnetic, strain and electric
polarization fields in the structure of multiferroic
materials
ALI
BAGHI ZADEH
Acoplamento da deformação e dos campos
magnético e de polarização elétrica em materiais
multiferróicos
Coupling of magnetic, strain and electric polarization
fields in the structure of multiferroic material
Tese apresentada à Universidade de Aveiro para cumprimento dos requisitos necessários à obtenção do grau de Doutor em Ciência e Engenharia de Materiais ALI BAGHIZADEH, realizada sob a orientação científica do Doutor Joaquim Manuel Vieira, Professor Catedrático do Departamento de Engenharia de Materiais e Cerâmica da Universidade de Aveiro e co-orientação do Doutor Vitor Brás de Sequeira Amaral Professor Catedrático do Departamento de Física da Universidade de Aveiro.
Apoio financeiro da FCT no âmbito da Bolsa de Doutoramento: SRRH/BD/51140/2010
o júri
presidente Professor Doutor Artur da Rosa Pires
Professor Catedrático da Universidade de Aveiro
Professor Doutor Vitor Brás de Sequeira Amaral
Professor Catedrático da Universidade de Aveiro, Co-orientador
Professor Doutor Joaquim Manuel Vieira
Professor Catedrático da Universidade de Aveiro, Orientador
Professor Doutor Pedro Manuel de Melo Bandeira Tavares
Professor Associado da Universidade de Trás-os-Montes e Alto Douro
Professor Doutor Marc-Georg Willinger
Coordenador do Group of Electron Microscopy, Fritz Haber Institute of the Max-Planck-Society, Berlin
Professor Doutor João Pedro Esteves de Araújo
Professor Auxiliar da Faculdade de Ciências da Universidade do Porto
Professor Doutor Bernardo Gonçalves Almeida
Professor Auxiliar da Escola de Ciências da Universidade do Minho
Doutor Manuel Pedro Fernandes Graça
acknowledgments This PhD work which has mainly an experimental focus, demanded participation of many people who either did teach me techniques or software, or with whom I did take parts of the research work. I would like to acknowledge FCT – SESAME program on giving me four years grant to carry out research of my PhD (SRRH/BD/51140/2010), also supporting my staying in Firtz Haber Institute, Berlin for a while in two successive years. I appreciate RNME-UA national network of electron microscopy project (REDE/1509/RME/2005) for access to equipment and extension of the grant for the FCT project. I acknowledge CICECO Institute in Aveiro University for providing me access to many facilities in the Institute and funding of attending workshops or conferences. Also this work was supported by following projects:PTDC/FIS/105416/2008, co-financed by FEDER, QREN reference COMPETE:FCOMP-01-0124-FEDER-010470 and RECI/CTM-CER/0336/2012 co-financed by FEDER, QREN reference COMPETE: FCOMP-01-0124-FEDER-027465 and was developed within the scope of the project CICECO-Aveiro Institute of Materials, POCI-01-0145-FEDER-007679 (FCT Ref. UID /CTM /50011/2013), financed by national funds through the FCT/MEC and when appropriate co-financed by FEDER under the PT2020 Partnership Agreement
Very special thanks to my wife and my family, mostly to my wife for standing all difficulties during PhD work, for her great support and motivation and for her fruitful helps on helping in parts of my PhD work on AFM/PFM analysis and in making the Thesis ready for submission.
Also, especial thank to my Supervisor, Prof. Joaquim Manuel Vieira who have tried kindly to train me and teach materials science, to fill my lack of knowledge in relevant topics, for spending lots of time and energy on progressing our research. I acknowledge deeply my co-supervisor, Prof. Vitor Brás de Sequeira Amaral who is so patient on teaching physical concepts of magnetism, magnetic measurements, frequent discussions and coordinating this PhD research. My special thanks to Porf. Augusto Lopez, Marta Ferro and Bruno Almeida in Electron Microscopy for their training and support, and more often discussions on techniques and results, also to the technicians and secretaries of the Department of Materials and Ceramic Engineering, to my colleagues in Physics Department, technicians and secretaries, particularly my colleagues in the Lab for VSM magnetometers. I am deeply grateful to my colleagues in the group of Prof. Vitor Amaral in Physics Department and SQUID lab, for their helpful training and discussions on the magnetic studies and first-principles calculations, particularly Joao Amaral, Joao Nuno Gonçalves and Nuno Joao Silva. Also thanks to Prof. Manuel Graça for his help on performing dielectric measurements in Physics Department. I would like to acknowledge the collaboration of Dr. Rosario Soares in XRD labs of CICECO, for always being helpful and performing XRD analysis. My heartfelt appreciation to Prof. Marc Willinger for the hospitality in Fritz Haber Institute, Berlin, Germany for few months, for teaching advanced microscopy and techniques of preparing the samples while I was there, and to the members of his department who were always kind and helpful on whatever I was asking. I give my sincere gratitude to Mr. Achim Klein-Hoffmann, the technician for TEM sample preparation in Fritz Haber Institute, who taught me different techniques and details of relevant equipment for the needs of sample preparation. I would like to acknowledge Dr. Daniel Stroppa in INL, Braga for the opportunity to do TEM/STEM experiments using aberration corrected Microscope and initiate new directions in my research. My appreciation to Prof.Rui Silva and Dr.Filipe Oliveira and my colleagues in their laboratories in the Department of Ceramics and Materials Engineering where we shared some facilities and I spent most of my time there. Also I acknowledge Daniel Mota in IFIMUP, Department of Physics, University of Porto.
palavras-chave multiferróicos, desvio estequiométrico, LuMnO3, acoplamento
magneto-dielétrico, defeitos topológicos, microscopia.
resumo
No trabalho de investigação para o doutoramento foi realizado um estudo abrangente dos efeitos do desvio estequiométrico sobre o comportamento magnético e o acoplamento do magnetismo com a polarização elétrica e a rede cristalina do óxido cerâmico multiferróico de rede hexagonal do LuMnxO3±δ auto-dopado no intervalo de composição (0.92≤x≤1.12). Existe
um acoplamento complexo dos diferentes ordenamentos ferróicos. O cancelamento dos momentos magnéticos dos iões Mn no sistema antiferromagnético, a polarização elétrica com topologia específica de vórtice/antivórtice conduziram os investigadores a propor modelos para a física e química subjacentes ao acoplamento elétrico e magneto-elásticas dos materiais multiferróicos de h- RMnO3. Neste trabalho optou-se
pela auto-dopagem das posições R e do Mn da rede cristalina dos cerâmicos h-LuMnxO3±δ preparados por reacção no estado sólido como
caminho para uma compreensão mais completa da transição antiferromagnética, do ferromagnetismo fraco frequentemente observado nas mesmas redes cristalinas e das propriedades dieléctricas e ferroeléctricas associadas a alterações impostas à rede pela auto-dopagem. Em linha com o propósito traçado para a tese de doutoramento, foram dois os objectivos definidos para o estudo de sinterização no primeiro capítulo sobre resultados experimentais. Primeiro foi feito o estudo de sinterização das amostras com desvio de estequiometria em correspondência com condições do processamento relatadas na bibliografia e conformes com os diagramas de fases do LuMnO3, tendo-se optado por diversas etapas de
reacção a temperatura elevada terminando com um último passo a 1300ºC durante 24 horas. Numa segunda parte, explorou-se o efeito do aumento do tempo de recozimento até às 240 horas à mesma temperatura fixa de 1300 ºC para melhorar as propriedades sob estudo da solução sólida. Caracterizaram-se todas as séries para cada tempo de recozimento dos cerâmicos de h-LuMnxO3±δ na tentativa de construir um referencial que
permitisse a comparação das propriedades medidas nas composições com desvio de estequiometria com os resultados de outros estudos da bibliografia. A difracção de raios-X (DRX) e o refinamento de Rietveld dão a evolução dos parâmetros de rede em função de x tendo-se observado uma retracção nos parâmetros de rede com o aumento dos valores de x e identificado em primeira aproximação o limite de estabilidade da solução sólida pela análise dos mesmos parâmetros de rede. As evoluções do tamanho do grão e a da quantidade de fases residuais detectadas foram investigadas por técnicas de TEM, SEM, EDS e EBSD. Foram ainda caracterizadas as dependências do crescimento de grão e da diminuição de teor em fases secundárias em função da composição x e tempo de processo.
A susceptibilidade magnética das amostras e a irreversibilidade magnética são caracterizadas e avaliadas extensivamente no capítulo seguinte da tese. Foram determinadas as dependências da susceptibilidade magnética, da temperatura de Néel da transição antiferromagnética e dos parâmetros principais do comportamento magnético e comparadas com observações feitas em outros multiferróicos. Como ferramenta de alta sensibilidade para detectar vestígios menores da fase magnética hausmannite, sugere-se que as medidas magnéticas podem ser úteis na confirmação dos diagramas de fase dos óxidos RMnO3. São discutidas dificuldades patentes em estudos
anteriores sobre as interpretações dadas à anomalia magnética nos óxidos h-RMnO3 abaixo de 43 K sendo esta atribuída à fase Mn3O4 com suporte na
microscopia eletrónica. No capítulo final da tese é investigado o acoplamento magneto-eléctrico com o ordenamento AFM acoplado às fronteiras de domínio da polarização dielétrica e com a determinação da constante dielétrica complexa em função da frequência e temperatura. Dentro do limite de estabilidade da solução sólida do h-LuMnxO3±δ, o
acoplamento magneto-eléctrico em TN continua a observar-se em todo o
intervalo do desvio estequiométrico. Tanto quanto o autor tem conhecimento este estudo representa o primeiro trabalho de investigação sobre acoplamento magneto-eléctrico modificado por auto-dopagem com lacunas nas redes de h-RMnO3.
A observação das redes cristalinas revela distorções à escala atómica criadas pelas variações locais da razão x na composição do LuMnxO3±δ,
dependentes das condições de sinterização as quais foram analisadas em detalhe por TEM/STEM, complementado com EDS e espectroscopia EELS por forma a obterem-se informações mais completas sobre relações cruzadas entre distorção, falta de homogeneidade composicional e estrutura eletrónica. Estes resultados encontram-se reunidos e são discutidos num capítulo específico da tese. Foram encontradas interfaces internas nas secções finas TEM dos grãos cristalinos de várias tipologias. São propostas explanações qualitativas para as propriedades magnéticas e ferroelétricas medidas correlacionando-as com as observações feitas à nano-escala nos cerâmicos de LuMnxO3±δ. Os domínios ferroelétricos e defeitos topológicos
estão presentes tanto em imagens de TEM como de AFM/PFM. Esta última técnica é utilizada para a caracterização do tamanho, distribuição e comutação de polaridade dos domínios ferroelétricos na escala do mícron em relação com potenciais efeitos da dopagem por lacuna e fazendo a ponte com os estudos TEM sobre a estrutura atómica dos mesmos domínios ferroelétricos. Como suporte ao estudo experimental, foram feitas simulações DFT usando o código Wien2K a fim de interpretar os espectros de EELS da banda K do oxigénio e para obter informação sobre a hibridização dos catiões com o oxigénio. As linhas das bandas L3,2 do Mn
nos espectros de EELS são utilizadas para estabelecer o estado de oxidação dos iões Mn no interior dos grãos cristalinos. Além disso, a ferroelectricidade induzida por re-hibridização é também avaliada por comparação com a densidade parcial de estados dos orbitais do conjunto de iões da estrutura cristalina e a polarização elétrica é computada e correlacionada com efeitos do desvio estequiométrico.
keywords Multiferroics, off-stoichiometry, LuMnO3, magneto-dielectric coupling,
topological defects, microscopy.
abstract The comprehensive study on the coupling of magnetism, electrical
polarization and the crystalline lattice with the off-stoichiometric effects in self-doped multiferroic hexagonal h-LuMnxO3±δ (0.92≤x≤1.12) ceramic oxides
was carried out for the PhD work. There is a complex coupling of the three ferroic degrees. The cancelation of the magnetic moments of ions in the antiferromagnetic order, electric polarization with specific vortex/antivortex topology and lattice properties have pushed researchers to find out ways to disclose the underlying physics and chemistry of magneto-electric and magneto-elastic couplings of h-RMnO3 multiferroic materials. In this research
work, self-doping of Lu-sites or Mn-sites of h-LuMnxO3±δ ceramics prepared
via solid state route was done to pave a way for deeper understanding of the antiferromagnetic transition, the weak ferromagnetism often reported in the same crystalline lattices and the ferroelectric properties coupled to the imposed lattice changes.
Accordingly to the aim of the PhD thesis, the objectives set for the sintering study in the first chapter on experimental results were two. First, study of sintering off-stoichiometric samples within conditions reported in the bibliography and also extracted from the phase diagrams of the LuMnxO3±δ,
with a multiple firings ending with a last high temperature step at 1300ºC for 24 hours. Second, explore longer annealing times of up to 240 hours at the fixed temperature of 1300 ºC in a search for improving the properties of the solid solution under study. All series of LuMnxO3±δ ceramics for each
annealing time were characterized to tentatively build a framework enabling comparison of measured properties with results of others available in literature. XRD and Rietveld refinement of data give the evolution the lattice parameters as a function to x. Shrinkage of the lattice parameters with increasing x values was observed, the stability limit of the solid solution being determined by analysis of lattice parameters. The evolution of grain size and presence of secondary phases have been investigated by means of TEM, SEM, EDS and EBSD techniques. The dependencies of grain growth and regression of secondary phases on composition x and time were further characterized.
Magnetic susceptibility of samples and magnetic irreversibility were extensively examined in the present work. The dependency of magnetic susceptibility, Neel ordering transition and important magnetic parameters are determined and compared to observation in other multiferroics in the following chapter of the thesis. As a tool of high sensitivity to detect minor traces of the secondary phase hausmannite, magnetic measurements are suggested for cross-checking of phase diagrams. Difficulty of previous studies on interpreting the magnetic anomaly below 43 K in h-RMnO3 oxides
was discussed and assigned to the Mn3O4 phase, with supported of the
electron microscopy. Magneto-electric coupling where AFM ordering is coupled to dielectric polarization is investigated as a function of x and of
sintering condition via frequency and temperature dependent complex dielectric constant measurements in the final chapter of the thesis. Within the limits of solid solubility, the crystalline lattice of off-stoichiometric ceramics was shown to preserve the magneto-electric coupling at TN. It represents the
first research work on magneto-electric coupling modified by vacancy doping to author’s knowledge.
Studied lattices would reveal distortions at the atomic scale imposed by local changes of x dependent on sintering conditions which were widely inspected by using TEM/STEM methods, complemented with EDS and EELS spectroscopy all together to provide comprehensive information on cross coupling of distortions, inhomogeneity and electronic structure assembled and discussed in a specific chapter. Internal interfaces inside crystalline grains were examined. Qualitative explanations of the measured magnetic and ferroelectric properties were established in relation to observed nano-scale features of h-LuMnxO3±δ ceramics. Ferroelectric domains and
topological defects are displayed both in TEM and AFM/PFM images, the later technique being used to look at size, distribution and switching of ferroelectric domains influenced by vacancy doping at the micron scale bridging to complementary TEM studies on the atomic structure of ferroelectric domains. In support to experimental study, DFT simulations using Wien2K code have been carried out in order to interpret the results of EELS spectra of O K-edge and to obtain information on the cation hybridization to oxygen ions. The L3,2 edges of Mn is used to access the
oxidation state of the Mn ions inside crystalline grains. In addition, re-hybridization driven ferroelectricity is also evaluated by comparing the partial density of states of the orbitals of all ions of the samples, also the polarization was calculated and correlated to the off-stoichiometric effect.
i
Content
Content ... i
List of Figures ... v
List of Tables ... xix
Abbreviations and symbols ... xxiii
1. Outline ... 1
2. Introduction to multiferroics ... 9
2-1 Rare-earth hexagonal manganites ... 12
2-2 Data on crystalline structure of LuMnO3... 15
2-3 Neel ordering transition and Curie-Weiss temperatures ... 16
2-5 Topological defects of the interlocking of ferroelectric to anti-phase domain walls ... 20
2-6 Weak ferromagnetism in AFM ordered h-RMnO3 lattices ... 22
3. Experimental techniques and software packages ... 27
3-1 Processing of bulk LuMnxO3± ceramics ... 30
3-2 XRD phase characterization ... 32
3-3 Electron microscopy techniques ... 34
3-3-1 Methodology for preparation TEM thin sections ... 34
3-3-2 Sample preparation for SEM ... 38
3-3-3 TEM/STEM and SEM microscopes used for microstructural analysis ... 39
3-4 AFM/PFM microscopy ... 42
3-5 Magnetic measurements ... 43
3-6 Dielectric measurements ... 45
3-7 Software for data analysis and simulation ... 45
4. Lattice behaviour of LuMnxO3±δ ceramics and effect of sintering ... 49
4-1 XRD Analysis of the lattice parameters ... 51
4-1-1 Crystalline lattice constants from Rietveld refinement ... 52
4-2-1 Crystalline lattice constants inside stability limits of h-LuMnO3 ... 58
4-2-2 R-site doped h-RMnO3 materials ... 68
Content
ii
4-2-4 Tilting and buckling in unit cell of LuMnxO3±δ ceramics, sintering effect ... 74
4-2-5 Energy scheme of LuMnxO3±δ compositions from First-Principles Calculations ... 76
4-2-6 R-site / Mn-site vacancies through First-Principles Calculations: ... 79
4-3 Morphology and elemental analysis of secondary phases ... 84
4-3-1 Effects of Mn/Lu ratio on grain growth ... 85
4-3-2 Dispersion of secondary phase and elemental mapping ... 90
4-3-3 Secondary phase in samples of long annealing time ... 100
5. Magnetic behaviour of h-LuMnxO3±δ solid solution ... 105
5-1 Contribution of secondary phases to the total magnetic moment... 108
5-1-1: The influence of random noise and background signal ... 109
5-1-2: Effect of hausmannite on the magnetic properties of the pure LuMnO3 ... 110
5-2 Magnetic behaviour of non-stoichiometric h-LuMnxO3±δ ... 113
5-2-1 Irreversibility of off-stoichiometric ceramics after one day annealing ... 114
5-3 Effect of sintering time on irreversibility of magnetic behaviour ... 118
5-3-1 Irreversibility of magnetization ... 118
5-3-2 Neel temperature of antiferromagnetic ordering ... 125
5-3-3 Curie-Weiss temperature and frustration factor ... 127
5-3-5 Anomalous magnetic contribution below Neel ordering transition ... 141
5-4 Unit cell of LuMnxO3± ceramics and magnetic moments from the DFT approach ... 147
6. TEM study and DFT calculation of electronic structure of LuMnxO3±δ ... 151
6-1 Study of crystalline lattice of off-stoichiometric samples ... 154
6-1-1 Ferroelectric domains in TEM images ... 155
6-1-2 Image Simulation in relation to ferroelectric switching and ion vacancies ... 164
6-1-3 Imaging defects in the basal plane by TEM ... 168
6-4 Density functional theory and EELS spectroscopy ... 176
6-4-1 Oxygen K-edge and crystal field environment of Mn ... 176
6-4-2 White line ratio and oxidation state of Mn ... 179
6-4-3 Hausmannite and Mn ion oxidation state ... 184
6-3 Regularity of the atomic structure after extended annealing time ... 187
6-3-1 Defects of the crystalline lattices after long time annealing ... 187
6-3-2 Ferroelectricity from STEM observations... 192
6-3-3 Lattice distortion, oxidation state of Mn after long time annealing ... 194
iii
7-1 Study of dielectric behaviour of off-stoichiometric ceramics ... 209
7-1-1 Dielectric constant of Mn-rich samples ... 210
7-1-2 Effect of annealing time on dielectric constant ... 216
7-2 Piezoelectric response of off-stoichiometric ceramics ... 220
7-2-1 Preparing surfaces for AFM/PFM analysis ... 221
7-2-2 Off-stoichiometric effect on the ferroelectric domains ... 222
7-2-4 Vortex patterns and domain switching ... 225
7-2-5 Effect of sintering on ferroelectric domains ... 228
7-2-3 Re-hybridization and DFT calculations ... 235
7-3 Mode analysis of LuMnxO3± lattices ... 237
7-3-1 Mode decomposition in h-LuMnO3 materials ... 237
7-3-2 Ionic polarization of the off-stoichiometric unit cells ... 242
7-3-3 Polarization from first principles calculations ... 244
7-3-4 Total changes of modes from DFT approach... 247
8. Conclusion and future work ... 251
Annexes ... 261
A. Low temperature XRD of sample LuMn0.98O3± ... 263
B. EBSD analysis of an inclusion of hausmannite ... 265
C. Parameters of the magnetic susceptibility in the paramagnetic region ... 267
C-1 Background magnetization in temperature dependent magnetic measurements ... 267
C-2 Background correction with fixed value for all samples ... 270
C-3 Estimation of the contribution of hausmannite secondary phase ... 271
D. Analysis of field dependant M(T) ... 277
E. Mode decomposition of YMnO3 ... 280
F. Papers published in journals or conference proceedings ... 284
v
List of Figures
Figure 2-1. Room temperature dependence of lattice parameters of hexagonal RMnO3 on
rare-earth ionic radius of Lu, Er, Yb, and Y, from reference [6]. ... 13 Figure 2-2.(a). Schematic representation of the unit cell in h-RMnO3 with atomic positions and
their corresponding Wyckoff positions [26]. (b) A sheet of the Mn ions in a hexagonal structure of LuMnO3 viewed along the c-axis. The red spheres are oxygen ions and the black
Mn ions (made using VESTA software). ... 14 Figure 2-3. Lattice evolution of the LuxY1-xMnO3 lattice parameters and cell volume with
temperature with the knee at Neel temperature in a-axis constant and cell volume [37]. .... 19 Figure 2-4. Top view of the Lu (green spheres) and Mn (embedded inside the bipyramids) ions arrangements in LuMnO3 structure with oxygen ions (red spheres), the angle φ is the rotation of
the central oxygen in respect to the zero position. (b) One of the possible vortex-like patterns with correspondingnameofeachdomainduetotheapicaloxygenrotation(φ)asisdescribedinthe text. The colored circles are Lu ions with their direction up (dot) or down (cross)[51] . ... 22 Figure 2-5.(a) ) PFM image at room temperature and (b) low temperature 4 K MeFM image at 8 T magnetic field of a (001) surface of h-ErMnO3 single crystal [79], (c) spin configurations and (d),
(e) and (f) First-Principles calculations of polarization and magnetization both along c-axis as a function of trimer distortion QK3 of the lattice, in (e) the antiferromagnetic spin configuration is
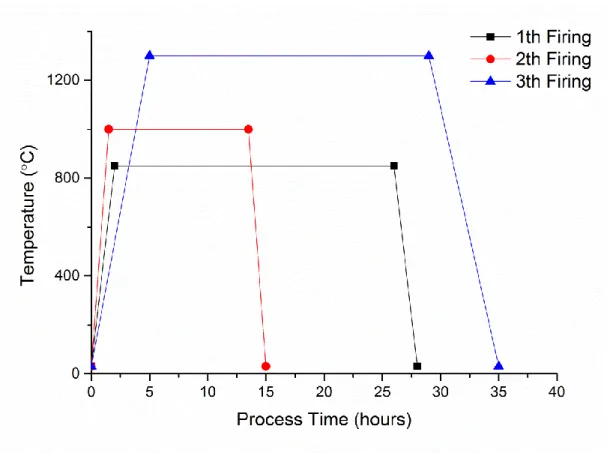
fixed, in (f) it is rotated by [10]. ... 25 Figure 3-1. The diagram of processing temperature versus time of sintering for each step of firing of samples of one day annealing. For longer annealing time, the blue curve (3th firing) was extended to more 4 days (for 5 days annealing at 1300°C) or longer annealing time. ... 31
List of Figures
vi
Figure 3-2. (a) Optical image of cross-section sample prepared for TEM study by mixing powders in proper Microscopy glue, brushing on a dummy silicon surface and putting second dummy silicon on the top. (b) After ion milling and removing one dummy silicon (intentionally by using single mode ion milling) there are few particles thinned enough for TEM on the edge faced to the vacuum. The glue between particles and dummy silicon is used for focus and stigmatism corrections during Microscopy. ... 36 Figure 4-1. XRD data and Rietveld Refinement of the data of the LuMnxO3±δ samples x = 0.92 (a)
and x = 1.08 (b) showing P63cm space group of hexagonal LuMnO3. Inset.a represents two
peaks of Lu2O3 secondary phase of sample with x= 0.92 (2θ= 49.58) and the inset.b shows
the peak of Mn3O4 secondary phase for sample with x=1.08 (2θ= 31.69). ... 56
Figure 4-2. XRD Rietveld fitting of the sample LuMn1.00O3±δ after three different annealing time
as written in each figure. ... 57 Figure 4-3. Dependence of the lattice constants on Mn/Lu = x ratio of the LuMnxO3±δ hexagonal
manganite: (a) a-axis, (b) c-axis and (c) Cell volume Vc for different sintering conditions.
Insets are the same constants of the Y1+xMnO3 ceramics for comparison [42]. ... 61
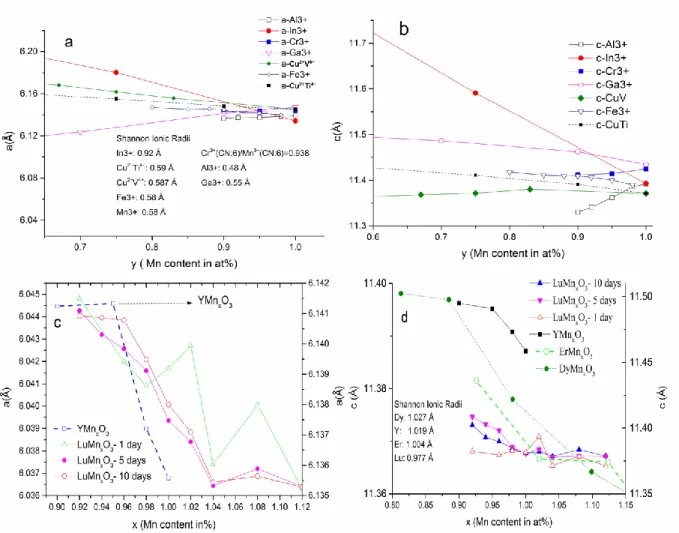
Figure 4-4. Weight fraction of second phases determined from Rietveld refinement of XRD data of 5 days and 10 days sintered samples of LuMnxO3±δ. ... 63
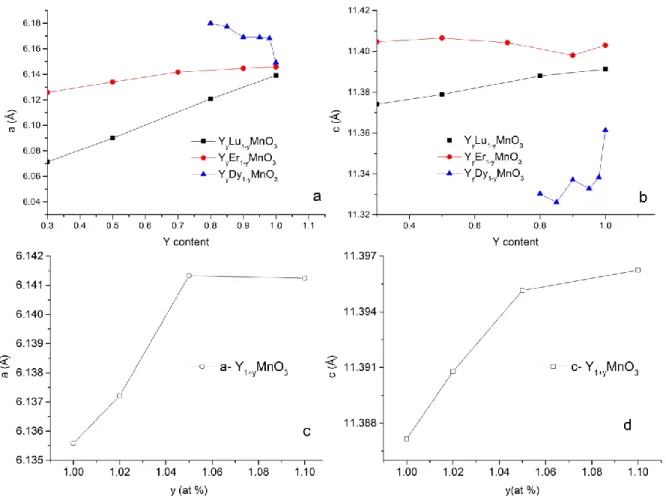
Figure 4-5. (103) peak of hausmannite secondary phase in XRD patterns of the samples after 5 days annealing. ... 66 Figure 4-6. (103) XRD peak of hausmannite phase from XRD patterns of the samples after one day and 10 days annealing time showing decrease in the intensity of the corresponding peak after long time annealing. ... 67 Figure 4-7. Data from bibliography on the change of (a) a-constant and (b) c-constant of R-site doped LuyR1-yMnO3 [34,72,112]. ... 68
Figure 4-8. Change of the a-axis (a) and c-axis (b) of the stoichiometric R-site co-doped YyR 1-yMnO3 materials [34,118,119]. a-axis (c) and c-axis (d) of Y-site self-doped Y1+xMnO3 was also
given for comparison [17]. ... 70 Figure 4-9. Change of the lattice parameters upon doping into Mn-site of the RMnxO3 oxides. (a)
and (b) show lattice parameters for Mn-site co-doping with trivalent ions. The a-axis (c) and c-axis (d) constant dependence on x for self-doped RMnO3 materials from current study or
literature (In3+[120], Cu2+V4+ and Cu2+Ti4+[121], Fe3+, Cr3+[70], Al3+[68] and Ga3+[122], Er and
vii
Figure 4-10. Tilting of the MnO5 polyhedron in (a) and (b), and displacement of the Lu ions and
Mn-Mn bond lengths of off-stoichiometric ceramics under study in (c) and (d). ... 75 Figure 4-11. (a) Calculated energy of the off-stoichiometric LuMnxO3±δ ceramics and (b)
evolution of the bad gap determined by First-Principles approach. ... 78 Figure 4-12. (a) PE structure of the 2x2x1 supercell of the LuMnO3 stoichiometric structure
viewing along c-axis, (b) Lu vacancy supercell, the place of Lu vacancy is located in the center of the image, Mn ions with different colors indicate two z-positions and (c) Mn vacancy supercell in a plane of Mn ions with pink color, other Mn ions are located at different z-coordinate. ... 80 Figure 4-13. Total energy versus volume change in the unit cell of LuMnO3 with Mn and Opl
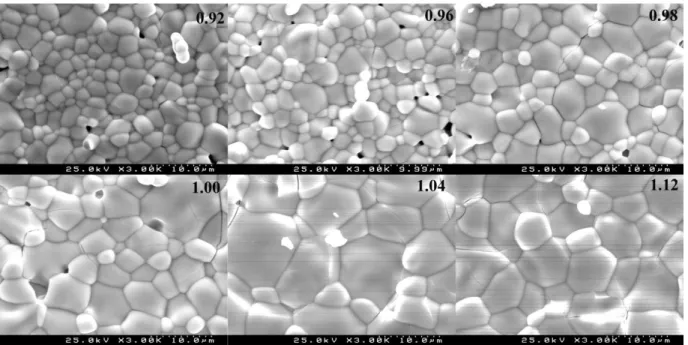
vacancies. 4% change in volume gets minimum energy among considered changes in volume, means that the unit cell after introducing Mn/O vacancies tends to be expanded. .. 84 Figure 4-14. Fracture surfaces of 5 day sintered LuMnxO3±δ samples of six different
compositions. ... 86 Figure 4-15. Evolution with time of annealing at 1300 C of densification and grain size of LuMnxO3±δ samples of three selected compositions. First raw, samples of one day annealing,
second raw of five days annealing and last raw of ten days annealing. ... 87 Figure 4-16. Grain growth in high temperature annealing of LuMnxO3± at 1300 C. (a)
Dependence of grain size of LuMnxO3± on x the Mn/Lu ratio for 1 day, 5 and 10 days of
isothermal sintering. (b) Dependence of the constant of the parabolic grain growth kinetics KG(T) on x; inset, the power law representation of grain growth kinetics. ... 89 Figure 4-17. Microstructure of sample LuMn1.08O3±δ (a) The low magnification image displaying
polishing pull-outs and residuals of the secondary phase (dark grey). (b) Large particle of Mn3O4 secondary phase and (c) corresponding Mn and Lu EDS line profiles. ... 91
Figure 4-18. EDS element profiles of the interface zone between Mn rich inclusions and the LuMnxO3±δ main phase of sample x=1.08. (a) ADF STEM image the interface zone between
one hausmannite particle and main phase with the profile of the Mn/Lu ration overlaid. (b) BF-STEM image of another set of hausmannite particles and main phase and (c) EDS line mapping along an interface zone between the hausmannite and main phase from (b). ... 94 Figure 4-19. Microstructure and EDS elemental mapping of polished cross-section of LuMn0.92O3±δ sample. (a) Isolated Lu-rich particles of the Lu2O3 secondary phase, detected by
List of Figures
viii
Figure 4-20. EBSD analysis of sample x=0.92, 1 day annealing. (a) SEM image with relief and grain boundary contours of EBSD. (b) EBSD phase map, LuMnO3 main phase (green) and
Lu2O3 (red), Mn3O4 (blue, very small regions); pixel size = 100 nm, (c) Crystal orientation
map, XMAP. ... 97 Figure 4-21. EBSD analysis of LuMn1.04O3±δ: (a) SEM image with relief and grain boundary
contours of EBSD. (b) EBSD phase map, LuMnO3 main phase (green) and Lu2O3 (red), Mn3O4
(blue); pixel size = 100 nm. (c) (10x) enlargement of area taken from EBSD phase map of LuMn0.92O3 sample, Figure 21.b. (d) (10x) enlargement of area taken from EBSD phase map
in figure (b). The large holes in the figure are not porosity but voids of the TEM thin section created by ion milling. ... 99 Figure 4-22. Sample LuMn1.04O3±δ after 5 days annealing. (a) SEM image. (b) BSE image of
different area with enhanced contrast for atomic number Z, relief and surface cracks, both images show the secondary phase. (c) image of SEM with large particle of secondary phase with low average atomic number and profile of Mn/Lu ratio of the EDS line scan overlaid on SEM image, are taken from the upper part of secondary phase in (b). ... 100 Figure 4-23. (a) SEM image of LuMn1.08O3±δ after 5 days annealing with EDS elemental mapping
of Mn (b) and Lu (c) form this region, respectively. The images show pores and grain boundaries, with uniform distribution of Mn and Lu ions within the resolution of the image. (d) relief map and (e) EBSD phase map with its Euler´s components (f to g) and color code (i). ... 103 Figure 5-1. Curie-Weiss temperature of 0.95LuMnO3+0.05Mn3O4 and effective magnetic
moment calculated from least-square fitting approach considering the overestimated weight fraction of the hausmanite (circle denotes TCW, square, effective magnetic moment). ... 112
Figure 5-2. Inverse of the magnetic susceptibility for three different contributions of total magnetization indicating the effect of the hausmannite on the bending of the mixed phase sample (blue one). The red curve shows inverse of magnetic susceptibility of 5% wt. of Mn3O4 phase. ... 113
Figure 5-3. FC magnetic susceptibility of the selected samples of one day annealing measured under 100 Oe applied field, showing the effect of the off-stoichiometric on the magnetic behaviour of the sintered ceramics. ... 114 Figure 5-4. ZFC vs FC magnetic susceptibility of LuMnxO3±δ samples, 1 day annealing, with
ix
and FC magnetic signals appeared at Neel ordering transition (500 Oe applied magnetic field). The inset of each figure shows the reciprocal of measured by SQUID under 100 Oe applied filed, and deviation of the apparent linear Curie-Weiss law for the sample of larger Mn content. ... 116 Figure 5-5. FC magnetic susceptibilities of the two LuMnxO 3± samples after one day and 5 days
annealing. (a) x=1.08 and (b) x=1.12 (100 Oe applied field). ... 119 Figure 5-6. Comparison of magnetic susceptibility of hausmannite below 45 K and of samples of the present study. (a) Overlapping of values of ZFC of hausmannite for a calculated fraction fH= 1.8 wt% and values of ZFC of LuMn1.04O3±, 5 days annealing, same applied magnetic
field of 1000 Oe. (b) Linear correspondence between values weight fraction of hausmannite in samples of 5 days annealing determined by the method given in the inset and from the intensity of the (103) XRD line of Mn3O4 in Figure 4-5. Inset: FC magnetic susceptibility of
YMnO3 with 1.2 wt% added hausmannite and of sample LuMn1.08O3±, 5 days annealing, same
applied magnetic field of 100 Oe, with close overlap for calculated fH=0.88 wt%. Data
sources, (a) Ref.[92] , (b) Ref. [143], (c) Ref.[90] ... 122 Figure 5-7. Long annealing time effect of the sintering of ceramics on spin glass state of the two samples taken by FC vs ZFC conditions under 100 Oe applied magnetics field, x=0.92 (a) and (b) and x=1.00 (c) and (d). ... 124 Figure 5-8. Subtraction of ZFC signal from FC signal of FC vs ZFC curves in previous figure ( c and d) for sample x=1.00, which shows irreversibility in AFM region. ... 125 Figure 5-9.Evolution of Neel ordering transition measured for selected samples at different sintering conditions. ... 126 Figure 5-10. Curie-Wiess temperature TCW (a) and frustration factor f (b) calculated after
subtraction of secondary phase signal [91], for a selection of all three sintering conditions. In (a), comparison is made to the dependence of values of TCW of YMnxO3 on x for x1 [19] and
x≤1 [17]. ... 129 Figure 5-11. Field dependent magnetization of sample x=1.08 annealed for one and 10 days measured at 10 K (a) and above 43 K at 50 K(b). ... 132 Figure 5-12. (a) Field dependent magnetization of samples with different compositions showing hysteresis even at 80 K for samples annealed for one day. (b) Magnetic hysteresis loops of sample LuMn1.04O3±δ after 5 days annealing measured at 40 K and 50 K, and the
List of Figures
x
dashed lines are showing the linear parts of the loops at high fields ( inset is magnifying parts close to H=0 region). ... 135 Figure 5-13. Parameters of weak ferromagnetism of selected LuMnxO3± samples from applied
fields of 5.5 T to -5.5 T. (a) Remnant magnetization MR as the average of magnetization of
M-H hysteresis loops at M-H=0. (b) The corresponding coercive fields, M-Hc. (c) Exchange bias
values HEB at the given temperatures for selected compositions of 10 days annealed
samples. ... 136 Figure 5-14. HRTEM images of LuMnxO3± samples along [001] zone axis where atomic
arrangements of the basal plane can be seen (the images were colorized to show up better different nano-regions in each image): (a) x=1.08 and (b) x=0.92, both from short annealing time (c) and (d), are corresponding IFFT images of the lattices where the change of the lattice regularity at the nanoscale can better be visualized. ... 139 Figure 5-15. FC and ZFC magnetic data (100 Oe external field) of sample LuMn1.08O3±δ annealed
at different time shown the additional magnetic component on the contrary of expected basal plane AFM interaction at TN and below it. ... 142
Figure 5-16. Magnetization normalized by the applied magnetic field, M/H, of the sample x=1.04 after 5 days annealing under different applied magnetic field. (a) ZFC zero-field cooled M/H. (b) FC, field-cooled M/H. ... 144 Figure 5-17. Dependence of magnetization LuMnxO3±at given values of temperature in the
temperature below TN. (a) Dependence M/H at the maximum of ZFC, T81 K, on the Mn/Lu
ratio x of selected samples of 5 days and 10 days annealing time, with measuring applied field of 100 Oe. (b) Dependence of magnetization M on applied field H of sample LuMn1.04O3±, 5 days annealing at the given temperature T=40, 55 and 81 K, from M/H (ZFC)
data in preceding Figure 6-16.a. ... 146 Figure 5-18. Magnetic moment of Mn ion of LuMnxO3± solid solution (a) Effective magnetic
moment determined from the fitting of Curie-Weiss (Table C-6), 5 days and 10 days annealed samples. The data of effective magnetic moment of YMnxO3± were calculated from
Ref.[19] (b) Magnetic moment of the Mn3+ ions from first-principles calculations considering
collinear A-type AFM configuration. ... 150 Figure 6-1. (a) The dark field image of the LuMn1.04O3±δ sample taken by choosing four spots in
the SAD pattern showing small antiphase ferroelectric domains, (b) SAD diffraction pattern of the same particle oriented along (110) zone axis. (c) HRTEM image of the sample
xi
exhibiting the switching of the Lu ions observable due to contrast change; inset shows simulation of the image overlapped with the experimental one. ... 156 Figure 6-2. . The methodology used to find ferroelectric domain switching considering the phase shift of Lu ions positions on the domain walls. The network inside the TEM image is used to locate the positions where domain wall appears and what type of domain exists on both sides of the domain wall. (a) The box on TEM image used in Ref.[58] to define the type of domain wall and phase shifts of Lu ions on both sides of the domain wall. (b) The model image of two FE domains with opposite polarization along (100) zone axis. (c) The TEM image of sample LuMn0.92O3±δ and network of lines; each one marks the first atom of the unit
cell starting from left side. (d) The intensity profile of the line drawn on the TEM image clearly indicates the fluctuation of the up or down atoms along an atomic plane with transition of period from 1 down – 2 up on left, to new period 1 up – 2 down on right side. ... 158 Figure 6-3. (a) HRTEM image of the sample LuMn1.12O3±δ taken along (110) zone axis with
simulation overlaid in the upper part of the image. (b) Right part of the image in a), indicating distortion in the atomic planes of Mn and Lu ions. The intensity profiles on the bottom of the image display ordering in the peaks of the blue line and disordering in the atomic arrangement in the lattice along c-axis in the red line. (c) Left part of image a) showing the APB in the region marked by dash lines along basal plane... 160 Figure 6-4. Structural distortion observed in sample x=0.92. (a) Low resolution TEM image taken by introducing the contrast aperture for better contrast along (110) zone axis, showing two lines of the APB (anti-phase boundaries). (b) HRTEM image of the place where the APB lines join together showing nanodomains around the joining point. (c) Magnified HRTEM image of the joining point of the APB lines indicating the high intensity of distortion. The scale in the image is a guide to find the FE switching as was discussed in Figure 6-2. The yellow, dashed lines indicate regions with different polarizations. (d) STEM image of the same joining point of the APB lines, below the image the EDS spectra from points 1 and 2 marked in the same image. ... 162 Figure 6-5. Left panel are the atomic arrangements of the ions of the up and down polarized unit cells viewed along (110) zone axis. Right panel are the HRTEM simulated images corresponding to these two atomic arrangements; the difference in the contrast of the
List of Figures
xii
atomic rows makes it feasible to distinguish the polarization of FE domains even in non-Cs corrected TEM/STEM. ... 165 Figure 6-6. Simulated HRTEM images of the LuMn0.92O3±δ structure using 2x2x1 superstructure
and imposing presence of vacancies. a. 2 Mn ion vacancies in z=0 and 1/2, b. 6 oxygen ion vacancies surrounded the Mn ions with their positions as the ones in (a) and (c). 2 Mn ion in (a) and 6 oxygen ion vacancies in (b). The dashed circles indicate places of vacancies, in each image, it is repeated four times according to the size of the supercell simulated here. ... 166 Figure 6-7. Series of HRTEM image simulation of LuMn1.08O3 sample considering (a). no vacancy
in 2×2×1 superstructure, (b) 2 Lu ions vacancy located in a sheet of Lu ions between two Mn basal planes in unit cell, (c) six oxygen vacancies around the 2 Lu ions considered in (b) and (d) vacancy of 2 Lu ions and 6 oxygen ions. Circles are showing one of the four Lu+O deficient regions in the model considered here. ... 167 Figure 6-8. (a) (001) zone axis HRTEM image of the sample LuMn0.92O3±δ showing one plane of
the Mn in-between the two planes of the Lu ions. The inset shows the simulation matched with the undistorted part of the image. (b) Modelling of the disordered in the lattice resulted in losing one Mn plane out of two Mn planes between planes of Lu ions. (c) Anti-phase boundary of Lu planes indicating shift of half spacing in planes of the Lu ions with the angle of 30⁰ in respect to a-axis. ... 170 Figure 6-9. BF-STEM images of two adjacent parts of one same crystalline grain of LuMnxO3±
phase of sample x=1.08 taken along (110) zone axis. For each image, EDS analysis was made of the all area and at the given points and the corresponding results of the Mn/Lu ratio for point analysis (yellow) and average ratio (dashed white line) are given in overlaid plots. (a) Area of nearly uniform contrast and average Mn/Lu=1.035. (b) Area with regions of dark contrast and average Mn/Lu = 1.051. ... 173 Figure 6-10.(a) STEM image of the crystalline structure of x=1.04 LuMnxO3±δ solid solution for
zone axis close to the 𝟏 𝟏 𝟔 direction and (b) corresponding view of the crystal structure evidencing the columnar alignments of Lu3+-O2- ions in hexagonal symmetry centred in the
origin of the crystalline cell were an identical columnar alignment of the Lu3+-O2- ions is also
found. O2- ion (green), Lu3+ ion (red), Mn3+ ion (blue), crystalline lattice simulation done with
CaRIne Crystallography 3.1 software. ... 175 Figure 6-11. (a) EELS spectra of the O K-edge of the three selected compositions, indicating slight change in intensity as the type of vacancy is changed. Density of unoccupied States
xiii
calculated for sample x=1.00 (b), and 1.08 (c) (the x=0.92 is not shown here) for the orbitals of the involved ions which have contribution in EELS spectra. ... 178 Figure 6-12. EELS spectra of the Mn L3,2 edges of the three samples in the Figure 6-11.(a) (all
compositions of the one day annealing samples). constant energy onset, also the apex of L3
peaks have almost the same energy (dashed line in the figure). (b) Average “white line” ratio of two different particles for each of the given sample compositions of samples of one day and 5 days annealing time. Points between the limits of 2.4 and 2.8 are considered representative of 3+ oxidation state of Mn ions. ... 181 Figure 6-13. Comparisons of EELS spectra in two regions of the crystalline grain of the main phase of LuMn1.04O3± sample, damaged area at the edge of the particle (dashed-line) and
slightly to the inside the particle (solid line). (a) oxygen K-edge and (b) L3,2 edges of Mn3+. 183
Figure 6-14. Sample LuMn1.08O3±, one day annealing time. (a) Particle of hausmannite showing
different domains inside the lattice and (b) EELS spectrum of a region less than 10 nm in size inside the same particle. ... 185 Figure 6-15. (a) Dark field image of a particle of sample x=1.04 after 5 days annealing taken along (001) zone axis and (b) dislocations in the same particle in BF image. (c) IFFT of the HRTEM image in (d) showing disordering of the lattice sapcing across the image. (d) HRTEM image of a defect in images (a) and (b). (e) IFFT and (f) lattice images of the defect presenting distortions in the bipyramids. ... 189 Figure 6-16. TEM images taken along (110) zone axis of sample x=1.04, 5 days annealing: (a) Low resolution image with one alignment of dislocations forming a low angle boundary. (b) Dark field image of the lattice in the region of image (a) where the aligned dislocations are observed. TEM images from sample x= 0.92, 5 days annealing: (c) DF image of a long linear defect like a dislocation. (d) In HRTEM image there are regions out of registry due to distortion. DF images were taken by slightly tilting the sample away from the (110) zone axis to enhance the contrast of the defects. ... 191 Figure 6-17. HAADF-STEM image of sample LuMn1.04O3±δ of 5 days annealing time, [110] zone
axis. (a) Large area with single direction of FE polarization as determined from displacement of Lu ions. (b) Enlarged image taken from lower left corner of a). (c) Enlarged image of a second area of the same particle close to a. (d) IFFT of the image of (c). ... 193 Figure 6-18. (a) Dark field image of a region of sample LuMn0.92O3±δ, one day annealing, with
List of Figures
xiv
thought to be responsible for the contrast change. (b) High magnification of the same area with fine inclusions inside the crystalline lattice of the LuMn0.92O3±δ particle. ... 197
Figure 6-19. (a) HAADF-STEM image of lattice of LuMn0.96O3±δ taken along (110) zone axis. (b)
EDS mapping of the Mn ions overlaid on the image. (c) One (001) boundary plane separates the regular hexagonal LuMnO3 lattice (left) from distorted hexagonal crystalline lattice
(right) with 90, =87.7 and =120 (partial ribbon dislocation, [202]). ... 200 Figure 6-20. (a) and (b) show two different regions of a defective lattice of sample x=0.96 containing stacking faults in image (c ). In (a) at the right, up part of defect in (c) there are 3 visible planes of Lu ions with downward polarization (shown by arrow). In (b) at the left, down part of defect in (c) there are two opposite polarizations indicating two ferroelectric domains. The scale in image (b) is used to identify the phase shift of two FE domains. (c) Line drawn across defective region to take EDS, (d) Lu line EDS profile (green) and e) line profiles of Mn (red) across the line in (c) after their data being smoothed. (f) Enlarged view of the window marked on left of (a) with a stacking fault 𝑏𝑝 = 16001 formed by the triple-layer structure of pairs of Lu planes with mutual cancelation of FE polarization, dashed vertical lines in yellow are eye guides indicating preservation of FE phase at the bottom (negative) and phase shift of /3 with reversal of FE polarization at the top (positive), Lu3+
ion (yellow), Mn3+ ion (purple), O2- ion hidden; the new 2D-phase is delimited by the box of
the dashed-red line ... 205 Figure 7-1. Temperature dependence of dielectric constant, ε´(T), of selected LuMnxO3±
samples with x = 1.00, 1.04 and 1.08 at 1 MHz evidencing the drop of the dielectric constant ε´ at T*N. The right side of image is the first derivative of the dielectric constant (´(T)) at some frequencies, showing independency of the transition to the frequency. ... 211 Figure 7-2.Inverse of magnetic susceptibility for sample with Mn excess (x=1.08) (a) and dielectric constant at high frequency (b) both indicate transitions around 90 K and 70-80 K, also a knee in dielectric and rarely in magnetic measurements above Neel transition temperature but at different temperatures. ... 213 Figure 7-3. (a) Temperature derivative of the dielectric constant ε´(T) at different frequencies for the sample LuMn1.08O3± indicating frequency independent peaks at 89 K and 69 K and a
frequency dependent transition around 31 K. (b) Imaginary part of the permittivity ε´´(T) of same sample LuMn1.08O3± exhibiting the frequency dependence of the transition
xv
temperature of the transition observed around 31 K, inset with the Arrhenius plot of the relaxation time τ of the same anomaly of the imaginary part of the permittivity [91]. ... 215 Figure 7-4. (a) The dielectric constant as a function of temperature for two compositions, x=0.92 and x=1.00 after 5 days annealing time, measured at 1 MHz frequency. (b) and (c) The first derivative of the dielectric constant for two compositions showing the Neel ordering transitions, another transition below 90 K and low temperature anomaly for x=0.92. (d) The thermal evolution of the dynamics of the anomaly at temperature range of 18 K to 30 K observed for x=0.92. ... 219 Figure 7-5. PFM images of different compositions, (a) x=0.92, (b) x=1.00 and (c) x=1.04 showing the ferroelectric domain in different sizes as the grain size of the compositions also changes by x... 223 Figure 7-6. PFM images of sample with x= 1.08, 1 day annealed, of two different regions showing vortex pattern of 6 APB/FE domains or 4 APB/FE domains. (a) Image of 6 areas radiating of a common point in two alternating subsets of 3 upward polarized areas and 3 of downward polarization. (b) PFM signal intensity of line profile in (a). (c) PFM image of another part of the sample. (d) AFM image of surface of (c). (e) Enlarged view of the up, right part of (c) with 4-fold APB/FE vortex like pattern. (f) PFM signal intensity of line profile in e). ... 226 Figure 7-7. HRTEM images of x=1.04 orientated along (110) zone axis for right side particle across the boundary (a) and (c) and high magnification STEM image of the distorted lattices at boundary of two particles. (d) AFM image of the chemically etched surface of the same sample showing the effect of the grain boundaries. ... 227 Figure 7-8. AFM topography and PFM images of x=1.00 and x=1.04, 5 day annealed samples. (a) AFM topography image of x=1.00 sample. (b) FEM image area in a. (c) PFM image of x=1.04 sample. d) Enlarged view of same area of a, with reversed polarization contrast. (e) Line profile of the FE domain transition as indicated in PFM image (d). (f) FE domains of YMnO3-
single crystal grown in Ar atmosphere [162]. ... 230 Figure 7-9. (a) Amplitude and (b) phase maps of a vortex/anti-vortex FE domains with the total size of around 16 microns of sample x=1.04 (10 days annealing), darker regions in (a) shows higher voltage than brighter regions. (c) and (d) present 10 micron size vortex/anti-vortex images of sample x=1.00 (annealed for 5 days) in amplitude and phase, respectively. In amplitude, the bright regions correspond to upward polarization. ... 232
List of Figures
xvi
Figure 7-10. TEM-Dark Field images of sample LuMn1.04O3 after one day annealing by tilting
sample slightly out of (110) zone axis. (a), (b) and (c) are showing topological domains by deferent excitation and different places of the particle. (d) STEM image of one of the defects. ... 234 Figure 7-11. PDOS of three compsotions, (a) x=0.92, (b) x=1.00 and (c) x=1.08 for samples after 5 days annealing, calculated using LDA+U. ... 237 Figure 7-12. Results of mode analysis of LuMnxO3±δ ceramics, 5 days and 10 days annealing
time: (a) and (b) mode amplitude of the distortion of 2- and K3 modes. (c) magnitude of the
tile of the Mn-Oap bond to z-axis [51], (d) displacement of the Lu ions in the unit cell, (e) and
(f) are calculated tilt angles of the MnO5 bipyramids[35,223]. ... 240
Figure 7-13. Behaviour of apical (O1) and planar (O3) oxygen of 2- and K3 modes versus
selected compositions. ... 242 Figure 7-14.Ionic polarization of two sets of annealed samples, 5 days and 10 days, showing the effect of vacancy doping out of stoichiometric. ... 243 Figure 7-15. Berry phase polarization calculations for three selected samples x=0.92, 1.00 and 1.08 from sets of sample being annealed for 10 days vs. both K3 mode amplitude (x-axis) and
x-value for Mn/Lu ratio (right vertical axis). ... 246 Figure 7-16. (a) Total energy of 2- and K3 modes calculated via DFT approach showing different
behaviour on Lu-rich side whereas the Mn-rich side gives more fluctuation on the values. (b) Calculated magnetic moments of the Mn3+ ions in A-type AFM configuration for two different
modes off-stoichiometric compositions. ... 249 Figure A-1. Lattice parameters of the LuMn0.98O3±δ after one day annealing as a function of
temperature. ... 264 Figure B-1. EBSD analysis of the sample LuMn1.08O3±δ, (a) pattern quality map, (b) phase map
(red: Lu2O3, blue: Mn3O4 and green:LuMnO3), (c) to e show different componenet of the
Euler´s angles and (f) the color code of the orientaions. ... 266 Figure C-1. ZFC magnetization under 100 Oe applied magnetic field of the samples of one day annealing time (a) magnetization (raw data) as measured for samples with different masses. (b) Magnetization of the same measurements and samples of (a) after subtracting background as is described in the text. ... 268
xvii
Figure C-2. Dependence of results of the Tcw and 0 ( background) on sample composition after
fitting using the equation C-1 in the temperature range from 150 K up to at least 300 K or above. ... 269 Figure C-3. Comparing the Curie-Weiss temperature TCW obtained from fitting for two different
approaches were used on Table C-1 and Table C-2. The linear fitting of the data in figure is shown for both sets of the data. ... 271 Figure D-1. Exponent of power law obtained by fitting a power law curve on the data of field dependent magnetization measured at different magnetic fields at 40 K, 55 K and 80 K for x=1.04, x=1.00 and x=0.96, both FC and ZFC conditions. ... 279
xix
List of Tables
Table 2-1. Lattice parameters of LuMnO3 conventional solid state sintered extracted from the
references. ... 15 Table 2-2. Atomic positions of the present ions in the LuMnO3 from literature [29,30,33]. ... 16
Table 4-1. XRD Rietveld refinement results of the lattice parameters and secondary phases detectable in the powders of the samples sintered for one day at 1300⁰C in the last firing step. All sample show P63cm space group of the main phase. The identified space group for
Lu2O3 and Mn3O4 phases are I a -3 and I 41/a m d, respectively. ... 52
Table 4-2. XRD Rietveld refinement results of the lattice parameters and secondary phases detectable in the powders of the samples sintered for 5 days at 1300⁰C as the last firing step. ... 53 Table 4-3. XRD Rietveld refinement results of the lattice parameters and secondary phases detectable in the powders of the samples sintered for ten days at 1300⁰C in the last firing step. ... 54 Table 4-4. Summary of the available data of solid stability limits of h-RMnxO3 oxides with their
preparation method and maximum temperature of annealing. The result of the current study is also given in the table for comparison. ... 59 Table 5-1. Fitted values of the Curie-Weiss fitting, equation (5-2) for pure LuMnO3, with 0=0,
showing the reliability of the fitting approach used to extract parameters. ... 110 Table 5-2. Results of fitting of the magnetic susceptibility of the pure LuMnO3 assuming 1-fm
weight fraction of the main phase and fm of the hausmannite phase in equation (5-5).The overall signal of sum of magnetic signals of two phases is used as the raw data for fitting. Then the fm was changed (as a fix parameter) during each fitting to understand how much
List of Tables
xx
change do we have in magnetic parameters if the amount of secondary phase estimates incorrectly from XRD. Zero as subscript holds for initial values to start least-square fitting. ... 111 Table 7-1. Berry Phase calculations of the three samples in stoichiometric and x=0.92 and x=1.08 ... 245 Table C-1. Fitting of three parameters Curie-Weiss like approach equation C-1 to the magnetic susceptibility of samples of one day annealing time. The subscript of zero (columns 3 to 5) denotes the initial values of the variables for starting of the least-square fitting, 0 in column
9 represents the magnetic background determined by the fitting ... 269 Table C-2.Results of the 2 parameters fitting, considering constant background from sample x=0.96. ... 270 Table C-3. Lotgering function combined with Curie-Weiss law and constant magnetic background were used to calculate the Curie constant C and Curie-Weiss temperature TCW as
adjustable parameters in the fitting. ... 273 Table C-4. Parameters of the Curie-Weiss law with 1% constant background (χ0) which is
subtracted from the experimental data of of samples from 1 day annealing time to be used in fitting model of the equation (5-5). Relaxing the weight fraction of hausmannite phase in the least-square fitting results in unrealistic values for secondary phase, which is detectable easily in XRD pattern. Fixing the weight fraction of secondary phase to the values extracted from Rietveld refinement of the XRD patterns can be more stable approach among all approaches have been tested. ... 274 Table C-5. Results of applying developed methodology (Table C-4 ) to calculate magnetic parameters after subtracting secondary phase contribution for samples of 5 days and 10 days annealing time. Notice that for x=1.12 compositions the amount of secondary phase was considered higher than in other compositions. ... 275 Table C-6. Values of frustration factor f and magnetic moments calculated from the data of TCW
and C of previous table. TN values are calculated from the first derivative of the transitions in
FC magnetic susceptibility data observed at values of temperature around 90 K. ... 276 Table D-1. Values of exponent, and a constant of power law (Constant.H, where H holds for magnetic field) from fitting with their respective R2 (quality of fitting) for 3 samples of 5
xxi
Table E-1. Amplitude of the different decomposed modes (a) and the orbits (atoms) (b) involved in displacement during phase transition for each mode in hexagonal LuMnO3
lattices ... 281 Table E-2. Atomic displacement of the 4 ions in PE phase to 7 different Wyckoff positions. ux, uy
and uz are given in relative units. |u| is the absolute distance given in Å. ... 281
Table E-3. Atomic displacement of the PE Wyckoff positions of the ions in the unit cell and their splitting in respective irreducible representations. ... 282
xxiii
Abbreviations and symbols
Abbreviation Meaning
AFM Atomic Force Microscope
AFM Antiferromagnetic
APB Anti-phase boundary
APB/FE- DW Anti-phase boundary/Ferroelectric domain wall
BEC Born effective moment
BF Bright Field
CIF Crystallographic information file
CIP Cold Isostatic Press
DF Dark- field
DFT Density functional theory
DG Debye-Grüneisen
DM Dzyalloshinskii-Moryia
DW Domain wall
EDS Energy Dispersive Spectroscopy
EBSD Electron Backscatter Diffraction
EELS Electron Energy Loss Spectroscopy
FE Ferroelectric
FM Ferromagnetic
HAADF High angle annular dark field detector
HC Coercive field
HEB Magnetic exchange bias
LDA Local density approximation
LMO LuMnO3
M Magnetization
MeFM Magnetoelectric force microscopy
Mr Magnetic remanent
PFM Pizeoresponse force microscopy
RMS Root mean square
T1max Neel transition from dielectric measurement
Abbreviations and symbols
xxiv
T3max anomaly around 30 K in dielectric constant
TCW Curie-Weiss temperature
TEM Transmission electron microscopy
TN Neel transition
SEM Scanning electron microscopy
SQUID Superconducting quantum interference device
STEM Scanning transmission electron microscopy
U activation energy
VESTA Visualization for electronic and structural Analysis
VSM Vibrating sample magnetometer
xxv
Symbol Meaning
fH* hausmanite weight fraction from XRD line intensity ratio
fH+ hausmanite weight fraction from magnetic measurements
fm hausmanite weight fraction from XRD Rietveld refinement
J Exchange interaction parameter
K1 P6_3/mcm (193)
K3 P6_3cm (185)
kB Boltzmann constant
Oe Oersted
Q Mode amplitude
Si Component of spin of Mn3+ ions
Å Angstrom
α± phase shift on FE domain walls
β± phase shift on FE domain walls
γ± phase shift on FE domain walls
1 P6_3/mmc (194)
2 P6_3mc (186)
δ off-stoichiometric value of oxygen μeff Effective magnetic moment
μB Bohr magneton
* Dielectric constant
´ Real part of dielectric constant
´´ Imaginary part of dielectric constant
Relaxation time
Azimuthal angle, orientation of tilting the bipyramids
Magnetic susceptibility
Abbreviations and symbols
1
3
Multiferroic hexagonal RMnO3 manganites (R= Er, Ho, In, Lu, Sc, Tm, Y, Yb) deserve
receiving large attention from researchers as these materials permitted new fundamental findings showing coexistence of magnetic interactions, electrical polarization and structural distortion of the crystalline lattices. Coupling of correlated ferroic orders (magnetic, electrical polarization and structural orders) in a material imposes in-deep exploration of physical and chemical properties to figure out the role of each ferroic order behind experimentally measured quantities. To the current state of research, these interactions can appear as a result of cross-coupling of two or even three of the ferroic orders, within a same unit cell or coming out as a collective mechanism extended in a wider scale inside the bulk volume of the material. Difficulty arises here as how to discern the contribution of each coupling contribution to in studied properties. In the hexagonal h-RMnO3 oxides and among them in LuMnO3 with Lu3+ ion with the
smallest rare-earth ionic radii it is challenging to deduce the role of rare-earth ion, of transition metal ion or oxygen on each ferroic property and their cross-coupling, which will later provide the understanding and feasibility to control those properties and make technological applications in future.
Previous research on off-stoichiometry of oxides like LaMnO3 of perovskite structure
paved the way to look for clues on disclosing the underlying physics and chemistry of the h-RMnO3 oxides by introducing rare-earth vacancies or transition metal vacancies in the
crystalline lattice. The aim of the PhD work is to assess the effect of transition metal vacancies (Mn vacancy in the present study) or rare-earth vacancies (strictly R-site) on multiferroic properties of h-RMnO3 (for the case of R=Lu) in order to find out the
Outline
4
structure. Recognizing the presence of coupling effects like elastic, magneto-electric and structural Anti-phase/FE, acting in separate or together as driving force for the properties, ferroic orders have to be broadly surveyed. The essential connection of any ferroic order to Lu or Mn cations in the LuMnO3 materials will be exposed by tuning
the relevant A-site or B-site vacancy to changes induced on the measured physical property. On reviewing related literature of h-RMnO3 (R= Ho-Lu, Y and Sc) reported
values for properties like unit cell parameters or magnetic behaviour of nominally stoichiometric samples present significant scatter which hypothetically comes from point defects in their lattices, namely cation vacancies and oxygen vacancies.
This thesis is composed of eight chapters with this introductory outline to the research carried out as thesis work and the final chapter of conclusions and future work. It includes a review of the structure and multiferroic properties of hexagonal RMnO3
phases focused on the LuMnO3 phase as second chapter and a description of the
materials, preparation methods, main experimental techniques and equipment for testing and characterization of the samples as third chapter. Self-doping of h-LuMnxO3±δ
ceramics in combination to sintering conditions demand refined characterization of the phases present in the samples of each composition. Analytical techniques such as XRD, EDS-mapping, EBSD and transmission electron microscopy images are used to determine the presence of secondary phases on both sides of composition in vacancy doped lattices. Limitations of each characterizing technique on tracing very minute amounts and minuscule particles of the secondary phases are ascertained.
The option on taking the solid state reaction of mixed oxides as the sample preparation method was taken in order to simplify the number of variables under study, to preserve the high purity of the reactants as bought by avoiding further chemical handling, to assure proper retention of the cation fraction in the synthesized samples and to allow later comparison of results with data in the literature as conventional solid state sintering had been a prevalent technique for preparation of h-RMnO3 oxides. As further
![Figure 2-2.(a). Schematic representation of the unit cell in h-RMnO 3 with atomic positions and their corresponding Wyckoff positions [26]](https://thumb-eu.123doks.com/thumbv2/123dok_br/16001514.1103425/54.918.143.803.325.654/figure-schematic-representation-atomic-positions-corresponding-wyckoff-positions.webp)


![Figure 4-7. Data from bibliography on the change of (a) a-constant and (b) c-constant of R-site doped Lu y R 1-y MnO 3 [34,72,112]](https://thumb-eu.123doks.com/thumbv2/123dok_br/16001514.1103425/108.918.133.805.368.629/figure-data-bibliography-change-constant-constant-site-doped.webp)