Economic Evaluation of Energy Storage
Systems and their Impact on Electricity
Markets in a Smart-grid Context
Dennis Metz
Dissertation submitted to the Faculty of Engineering of University of Porto in partial fulfillment of the requirements for the degree of Doctor of Philosophy
Supervisor: João Tomé Saraiva
Professor at the Department of Electrical and Computer Engineering Faculty of Engineering, University of Porto
This work was supported by FCT - Fundação para a Ciência e a Tecnologia (Portuguese Foundation for Science and Technology), under the grant PD/BD/105848/2014.
Acknowledgement
I would like to express my sincere gratitude towards my supervisor Professor João Tomé Saraiva. His experience and advice were fundamental to the success of this thesis. He gave me the freedom to explore my own ideas, while at the same time providing excellent guidance. I have been very fortunate to have had him as my advisor.
In addition, I would like to thank my former professors from the Sustainable Energy Systems Doctoral Program at the Faculty of Engineering, who introduced me to the fundamentals of our energy system and equipped me with the required knowledge. Their insights built the foundation of this work.
Furthermore, I am very grateful to my family: my parents, my sister and brother as well as my parents in law were a continuous source of support and encouragement.
This thesis would not have been possible without the support, kindness and motivation from my beloved wife Alejandra. Thank you from all my heart!
Abstract
Generation from renewable energy sources has been rising worldwide and is set to grow further, as many countries are implementing and enforcing initiatives to reduce greenhouse gas emission to curb climate change. However, this change in the generation mix is increasingly challenging to handle for the grid operators, as the residual load becomes more volatile and difficult to predict. In order to ensure the continuous balance between supply and demand and minimize the amount of curtailed energy from renewable resources, a range of flexibility options exists. At the consumer end, the flexibility of the load can be increased by demand-side management. Alternatively, by increasing the interconnection capacity, surplus generation can be exchanged with neighboring grid zones. Furthermore, existing generation resources like cogeneration units can be refitted and operated in a more flexible way.
Storage, as another flexibility option, has the advantage of being able to act on both demand and supply sides as well as providing a wide range of system services. Hence, during periods with surplus generation from renewable resources, excess supply can be absorbed by storage systems. Contrary, during times with low contribution from renewable generation, the deficit can be compensated by discharging the storage device. However, while storage is well suited from a technological point of view to fill the gap, it remains unclear how the application of a storage device can be monetized. Furthermore, investors are struggling to evaluate potential projects due to their complexity. As a result, current implementations of new storage installations remain behind expectations. In addition, high uncertainty about future developments causes many investors to delay investment decisions.
In this context, this work identifies and defines several business cases regarding the integration of storage in power systems. Depending on the intended usage of the storage device, benefits might accrue which cannot be internalized by a private agent. Therefore, only commercial applications for energy storage will be considered. In the following, storage dispatch algorithms and an evaluation framework are developed. This allows defining the benefits that a storage device can provide, including barriers and drivers to its deployment. In order to consider uncertainty in the evaluation process, several assessment methodologies are introduced and adapted to the respective context. Furthermore, the impact of storage systems on the electric grid as well as on electricity markets is analyzed.
The results of this research do not only provide a better understanding about potential business cases and related income streams of storage devices to investors, but also provide deep insights into the associated risks of such an investment. Furthermore, the results allow policy makers to identify the relevant parameters for promoting storage in order to facilitate the integration of additional renewable generation capacity. Last, this document gives traditional power producers as well as grid operators a better understanding about the impact of storage installations on generation and demand patterns as well as on the possible impacts on electricity markets.
Resumo
A produção de energia elétrica utilizando recursos renováveis tem vindo a aumentar em todo o mundo e espera-se que continue a crescer dado que muitos países estão a implementar medidas para reduzir a emissão de gases de efeito de estufa de modo a limitar as alterações climáticas. No entanto, esta alteração do mix de produção coloca desafios crescentes à operação dos sistemas elétricos dado que a carga residual se torna cada vez mais volátil e difícil de prever. De modo a assegurar o equilíbrio entre a produção e a carga e a minimizar o corte de produção com origem renovável, encontram-se hoje em dia disponíveis diversas opções. Ao nível dos consumidores, a flexibilidade da carga pode ser aumentada adoptando programas de gestão da procura. Em alternativa, pode ser aumentada a capacidade de interligação de modo a que os excessos de produção possam ser canalizados para sistemas vizinhos ou outras zonas da rede. Por fim, a utilização de diversos recursos já existentes tais como sistemas de cogeração pode ser ajustada de modo a operarem de uma forma mais flexível. Tal como outras opções relacionadas com a flexibilidade, o armazenamento tem a vantagem de poder atuar quer do lado da produção quer do lado da procura podendo ainda fornecer diversos outros serviços. Assim, em períodos em que exista um excesso de produção de fontes renováveis, a produção em excesso pode ser absorvida pelo sistema de armazenamento. Em contrapartida, em períodos em que a contribuição de fontes renováveis é mais reduzida, o déficit de energia pode ser compensado pela descarga do dispositivo de armazenamento. No entanto, apesar do armazenamento poder constituir uma solução adequada do ponto de vista tecnológico, continua a ser pouco claro como é que se podem avaliar do ponto de vista monetário os investimentos em equipamentos de armazenamento. Para além disso, os investidores continuam a ter dificuldades em avaliar possíveis projectos devido à complexidade associada a essa avaliação. Como resultado, as instalações de armazenamento existentes atualmente continuam a ser em número reduzido face ao que se poderia esperar e a incerteza em relação a desenvolvimentos futuros tem contribuído para o adiamento de muitos investimentos.
Neste contexto, este trabalho identifica e define diversos modelos de negócio relativos à integração de armazenamento em sistemas de energia. Em função da utilização a dar ao sistema de armazenamento, alguns benefícios podem ser dificilmente internalizados por um investidor privado. Assim, neste trabalho foram consideradas apenas aplicações de que possam advir benefícios que seja possível estimar do ponto de vista comercial. Neste âmbito, foram desenvolvidos diversos algoritmos para realizar o despacho dos equipamentos de armazenamento bem como para realizar a sua avaliação. Torna-se assim possível identificar os benefícios associados ao armazenamento, incluindo as barreiras e vectores que poderão influenciar a sua instalação. Por outro lado, foram igualmente desenvolvidas metodologias para integrar incertezas no processo de avaliação e foram analisados diversos impactos das soluções de armazenamento nas redes eléctricas e nos mercados de electricidade.
Os resultados deste trabalho permitem obter uma compreensão mais profunda dos potenciais modelos de negócio e dos fluxos financeiros associados, bem como dos riscos associados a estes investimentos. Por outro lado, os resultados obtidos podem permitir que os decisores políticos identifiquem os aspectos mais relevantes de modo a promover a instalação de equipamentos de armazenamento tendo em vista aumentar a integração de fontes de energia renovável nos sistemas eléctricos. Por último, este documento fornece aos produtores utilizando tecnologias tradicionais bem como aos operadores das redes uma melhor compreensão dos impactos dos equipamentos de armazenamento nos perfis de produção e de carga bem como nos mercados de electricidade.
Table of Contents
List of Figures ... xiv
List of Tables ... xx
List of Acronyms ... xxii
List of Symbols ... xxiii
1 Introduction ... 1
1.1 Context ... 1
1.2 Motivation ... 2
1.3 Objectives ... 4
1.4 Structure of the Document... 4
2 State of the Art and Literature Review ... 6
2.1 Energy Storage Systems ... 6
2.1.1 Classification ... 6 2.1.2 Mechanical Storage ... 7 2.1.3 Electrical Storage... 8 2.1.4 Electro-Chemical Storage ... 8 2.1.5 Chemical Storage... 10 2.1.6 Suitability ... 10 2.2 Energy Markets ... 11 2.2.1 Forward Market ... 11 2.2.2 Spot Market ... 11 2.2.3 Balancing Market ... 12
2.2.4 Electricity Price Forecasting and Modelling ... 14
2.3 Business Case for Energy Storage Systems ... 16
2.3.1 General Aspects ... 16
2.3.3 Analyzed Applications ... 17
2.3.4 Arbitrage ... 18
2.3.5 Time Shifting of Energy ... 19
2.3.6 Provision of Ancillary Services ... 23
2.3.7 Integration of Multiple Value Streams ... 23
2.3.8 Role of Aggregators ... 25
2.3.9 Investment Cost ... 26
2.3.10 Regulatory Framework ... 26
2.4 Economic Evaluation of Energy Storage Systems ... 30
2.4.1 Methodologies ... 30
2.4.2 Uncertainty ... 32
2.4.3 Profit Driver ... 34
2.4.4 Optimization ... 35
2.4.5 Perfect Knowledge and Forecasts ... 37
2.5 Impact of Energy Storage Systems on Electricity Markets ... 39
2.5.1 Impact on Electricity System Load ... 39
2.5.2 Impact on Market Prices ... 40
2.5.3 Market Potential ... 41
2.6 Conclusion ... 42
3 Financial Evaluation of Commercial Storage Applications ... 44
3.1 Simulation of Storage System Operations ... 44
3.1.1 Framework ... 44
3.1.2 Storage Device ... 45
3.2 Evaluation Methodology ... 48
3.2.1 Cost and Revenues ... 48
3.2.2 Evaluation ... 49
3.3 Time Shifting of Energy ... 51
3.3.1 Business Case ... 51
3.3.2 System ... 52
3.3.3 Operation Schedule ... 55
3.3.4 Optimal Dispatch Problem ... 58
3.3.5 Optimal System Configuration Problem ... 63
3.4 Arbitrage of Energy Prices ... 67
3.4.1 Business Case ... 67
3.4.2 Optimal Dispatch Problem ... 68
3.4.3 Dispatch without Perfect Foresight ... 72
3.4.4 Evaluation ... 74
3.5 Provision of Ancillary Services ... 75
3.5.1 Business Case ... 75
3.5.2 Dispatch and Bidding Problem ... 76
3.5.3 Evaluation ... 77
3.6 Co-integration of Applications ... 78
3.6.1 Business Case ... 78
3.6.2 Optimal Dispatch Problem ... 78
3.6.3 Evaluation ... 80
4 Uncertainty and Risk of Storage Investments ... 82
4.1 Introduction ... 82
4.2 Model Verification ... 83
4.2.1 Time Shifting of Energy ... 83
4.2.2 Arbitrage of Electricity Prices ... 86
4.2.3 Co-integration of Applications ... 88 4.3 Sensitivity Analysis ... 90 4.3.1 Input Parameters ... 91 4.4 Scenario Analysis ... 92 4.4.1 Uncertainties ... 93 4.4.2 Scenario Construction ... 95 4.4.3 Evaluation of Scenarios ... 97
4.5 Monte Carlo Simulation ... 98
4.5.1 Parameter Uncertainty ... 98
4.5.2 Price Simulation ... 99
4.6 Value at Risk ... 104
4.7 Decision Making under Uncertainty ... 105
4.7.1 Using Scenario Analysis ... 106
4.7.2 Using Monte Carlo Simulation and Value at Risk ... 108
5.1 Introduction ... 111
5.2 Impact on Electricity Demand ... 112
5.2.1 Time Shifting ... 113
5.2.2 Arbitrage ... 121
5.3 Impact on Electricity Prices... 123
5.3.1 Market Resilience ... 123
5.3.2 Time Shifting ... 129
5.3.3 Arbitrage ... 132
5.4 Consequences and Feedback Reactions ... 135
5.4.1 Time Shifting ... 135
5.4.2 Arbitrage ... 137
6 Case Study ... 140
6.1 Time Shifting of Energy ... 140
6.1.1 Data and Assumptions ... 140
6.1.2 Model Implementation ... 151
6.1.3 Evaluation ... 156
6.1.4 Results ... 157
6.1.5 Analysis ... 166
6.1.6 Conclusion ... 176
6.2 Arbitrage of Electricity Prices ... 177
6.2.1 Data and Assumptions ... 177
6.2.2 Model Implementation ... 182
6.2.3 Historic Revenue Evaluation ... 186
6.2.4 Results ... 190
6.2.5 Analysis ... 191
6.2.6 Conclusion ... 196
6.3 Provision of Ancillary Services ... 198
6.3.1 Data and Assumptions ... 198
6.3.2 Model Implementation ... 201
6.3.3 Historic Revenue Evaluation ... 202
6.3.4 Results ... 203
6.3.5 Analysis ... 204
6.4 Co-integration of Applications ... 210
6.4.1 Data and Assumptions ... 210
6.4.2 Model Implementation ... 210
6.4.3 Results ... 211
6.4.4 Analysis ... 214
6.4.5 Conclusions ... 215
6.5 Impact on Electric Demand ... 215
6.5.1 Data and Assumptions ... 216
6.5.2 Model Implementation ... 219 6.5.3 Results ... 219 6.5.4 Analysis ... 221 6.5.5 Conclusions ... 224 7 Conclusions ... 226 7.1 Contributions ... 226 7.2 Main Findings ... 228
7.3 Perspectives for Future Work ... 230
List of Figures
Figure 3.1: Simplified representation of power and heat flows ... 54
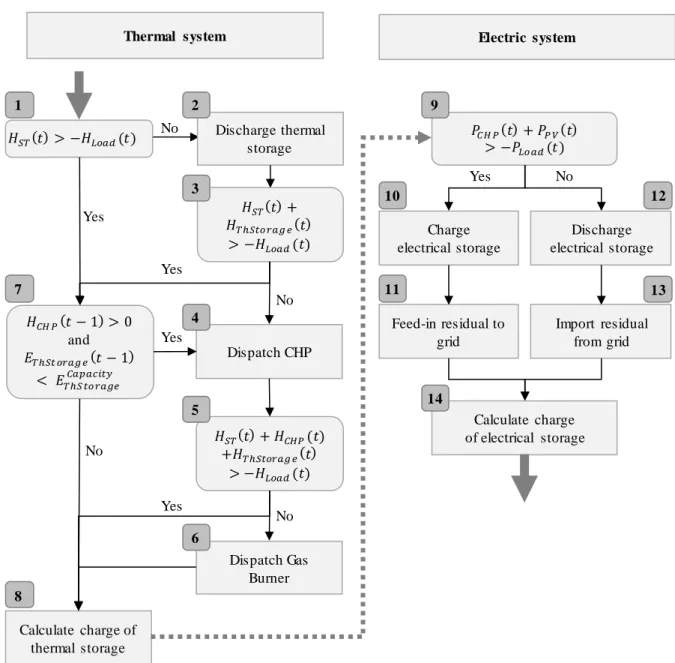
Figure 3.2: Simplified representation of one time step of the operating algorithm ... 56
Figure 3.3: Flowchart of the optimization process ... 65
Figure 3.4: Comparison of computation time for linear and mixed integer programming ... 70
Figure 3.5: Flow Chart of the arbitrage dispatch algorithm ‘A’ without perfect foresight ... 73
Figure 3.6: Schematic representation of the bidding process based on historical results ... 77
Figure 4.1: Power and heat flows from the ordinary dispatch for time shifting ... 84
Figure 4.2: Power and heat flows from the optimal dispatch for time shifting ... 85
Figure 4.3: Arbitrage dispatch with perfect foresight... 86
Figure 4.4: Arbitrage dispatch without perfect foresight (algorithm ‘A’) ... 87
Figure 4.5: Arbitrage dispatch without perfect foresight (algorithm ‘B’) ... 88
Figure 4.6: Joint dispatch for time shifting, provision of control reserve and peak shaving ... 89
Figure 4.7: Exemplary sensitivity plot of variable parameters ... 91
Figure 4.8: Scenario funnel ... 92
Figure 4.9: Historic market prices and estimated seasonal process ... 100
Figure 4.10: Distribution of price residuals after removal of the seasonal component ... 100
Figure 4.11: Process to remove jumps from price series over three iterations ... 101
Figure 4.12: Distribution of price jumps ... 101
Figure 4.13: Distribution of price residuals after removal of the seasonal components and price jumps ... 102
Figure 4.14: Autocorrelation of electricity prices and its components ... 102
Figure 4.15: Historic price data and price simulation ... 103
Figure 4.16: Price duration curve ... 104
Figure 4.18: Decision making process using scenario analysis (based on [67]) ... 106
Figure 4.19: Decision making process using Monte Carlo Simulation and Value at Risk... 109
Figure 5.1: Standard load profile for residential consumers during a workday ... 113
Figure 5.2: Generation profile for photovoltaic systems and cogeneration units ... 114
Figure 5.3: Energy exchange of a residential consumer with the grid during the winter (1 kW / 1 kWh) ... 115
Figure 5.4: Energy exchange of a residential consumer with the grid during the summer (1 kW / 1 kWh) ... 115
Figure 5.5: Average change in demand of residential consumers during winter (1 kW / 1kWh) ... 116
Figure 5.6: Average change in demand of residential consumers during summer (1 kW / 1kWh) .... 116
Figure 5.7: Energy exchange of a residential consumer with the grid during the winter (1 kW / 115 W / 1 kWh) ... 117
Figure 5.8: Energy exchange of a residential consumer with the grid during the summer (1 kW / 115 W / 1 kWh) ... 118
Figure 5.9: Average change in demand of residential consumers during winter (1 kW / 115 W / 1 kWh) ... 118
Figure 5.10: Average change in demand of residential consumers during winter (1 kW / 115 W / 1 kWh) ... 119
Figure 5.11: Impact on the power exchange with the grid during winter (1kW + 1kWh) ... 120
Figure 5.12: Impact on the power exchange with the grid during summer (1kW + 1kWh) ... 120
Figure 5.13: Average change in demand of residential consumers during winter (1kW + 1kWh) ... 121
Figure 5.14: Average change in demand of residential consumers during summer (1kW + 1kWh) .. 121
Figure 5.15: Relation of storage operations and total electric load ... 122
Figure 5.16: Temporal occurrence of storage operations (low power system) ... 122
Figure 5.17: Temporal occurrence of storage operations (high power system) ... 123
Figure 5.18: Linear regression considering load ... 124
Figure 5.19: Distribution of residuals from the linear regression considering the load ... 125
Figure 5.20: Linear regression considering residual load ... 125
Figure 5.21: Distribution of residuals from the linear regression considering the residual load ... 126
Figure 5.22: Comparison of residuals from the two models versus their normal distributions ... 126
Figure 5.23: Aggregated supply and demand curve ... 127
Figure 5.24: Impact of a demand change on the auction result ... 127
Figure 5.25: Average, cumulative impact of demand reductions on market prices in winter ... 128
Figure 5.26: Average, cumulative impact of demand reductions on market prices in summer ... 128
Figure 5.28: Relation between price sensitivities ... 129
Figure 5.29: Change of market prices along the day ... 130
Figure 5.30: Change of market prices along the day ... 131
Figure 5.31: Change of market prices along the day ... 132
Figure 5.32: Impact of storage dispatched for arbitrage on market prices ... 132
Figure 5.33: Change of market prices ... 133
Figure 5.34: Change of market price along the day ... 134
Figure 5.35: Relation of price sensitivity and arbitrage operations ... 134
Figure 5.36: Revenue degradation for arbitrage operations with increasing installed capacity ... 138
Figure 5.37: Revenue conservation from a dispatch adjusted to the new market prices ... 138
Figure 6.1: Boxplot of daily electricity demand ... 141
Figure 6.2: Electric load duration curve ... 142
Figure 6.3: Boxplot of daily heat demand ... 142
Figure 6.4: Thermal load duration curve ... 142
Figure 6.5: Monthly heat demand ... 143
Figure 6.6: Monthly distribution of generation of a 1 kW photovoltaic installation ... 143
Figure 6.7: Photovoltaic generation along the year of a 1 kW installation ... 143
Figure 6.8: Temperature along the year ... 144
Figure 6.9: Relationship between temperature and coefficient of performance of a heat pump ... 148
Figure 6.10: Evolution of tariffs over several exemplary days ... 150
Figure 6.11: Computation time for the mixed integer program ... 151
Figure 6.12: Simple implementation approach ... 152
Figure 6.13: Enhanced implementation approach ... 152
Figure 6.14: Missed revenue depending on the optimization horizon and forecast period ... 153
Figure 6.15: Computational cost depending on the optimization horizon and forecast period ... 153
Figure 6.16: Comparison of parameters for the simulated annealing process ... 155
Figure 6.17: Evolution of the Simulated Annealing search process ... 156
Figure 6.18: Capacities (in kW / kWh) of analyzed system configurations ... 157
Figure 6.19: Breakdown of investment cost ... 158
Figure 6.20: Net present value breakdown of the considered system configurations ... 161
Figure 6.21: Net Present value breakdown of the configuration with a storage system ... 162
Figure 6.22: Changes in net present value due to a storage installation ... 162
Figure 6.24: Energy flows of the electric system ... 163
Figure 6.25: Power generation by the cogeneration unit along the year ... 164
Figure 6.26: Duration curve of the cogeneration unit ... 164
Figure 6.27: State of charge of the thermal storage device ... 164
Figure 6.28: Charge / discharge flows of the storage device... 165
Figure 6.29: State of charge of the electric storage device ... 165
Figure 6.30: Duration curve of the electric storage device ... 165
Figure 6.31: Energy taken from the grid ... 166
Figure 6.32: Feed-in of energy from the photovoltaic system ... 166
Figure 6.33: Energy flows of the heat system ... 167
Figure 6.34: Energy flows of the power system ... 168
Figure 6.35: Breakdown of changes in value without perfect foresight ... 168
Figure 6.36: Power exchange with the grid ... 169
Figure 6.37: Distribution of electricity demand and feed-in ... 169
Figure 6.38: Change in demand seen by the grid during winter ... 170
Figure 6.39: Change in demand seen by the grid during summer ... 171
Figure 6.40: PV generation and feed-in under the optimal dispatch with a storage device ... 172
Figure 6.41: PV generation and feed-in considering the 50% limitation ... 172
Figure 6.42: Sensitivity plot of the optimal system configuration with energy storage ... 174
Figure 6.43: Net present value of the three system configurations under different scenarios ... 175
Figure 6.44: Boxplot of historical prices for the 1-hour day-ahead auction ... 178
Figure 6.45: Difference between daily minimum and maximum price for 1-hour contracts (2011-2015) ... 179
Figure 6.46: Difference between daily minimum and maximum price for 15-minute contracts (2015) ... 179
Figure 6.47: Market prices over five years for the day-ahead hourly auction ... 180
Figure 6.48: Historic market prices of the 15-minute day-ahead auction ... 180
Figure 6.49: Occurrence of maximum / minimum price during a day (2011-2015) ... 181
Figure 6.50: NPV improvement for different implementations of the optimization problem ... 183
Figure 6.51: Trade-off between improvement and computational cost ... 183
Figure 6.52: Demonstration of the search process for the NPV maximizing hurdle rate ... 184
Figure 6.53: Number of required searches to identify the optimum hurdle rate ... 184
Figure 6.54: Comparison of revenues from the backward looking approaches for 1-hour contracts (2011-2015) ... 185
Figure 6.55: Comparison of revenues from the backward looking approaches for 15-minute contracts
(2015) ... 186
Figure 6.56: Optimal revenues from pursuing arbitrage ... 187
Figure 6.57: Undergone cycles for pursuing arbitrage neglecting a hurdle rate in the dispatch ... 187
Figure 6.58: Revenues for the NPV maximizing dispatch ... 188
Figure 6.59: Realized cycles under the NPV maximizing dispatch ... 188
Figure 6.60: Profit maximizing hurdle rate for the lithium-ion battery ... 189
Figure 6.61: Revenues from pursuing arbitrage based on historical data (approach ‘B’) ... 189
Figure 6.62: Realized cycles under the backward looking approach ‘B’ ... 190
Figure 6.63: Net present value of pursuing arbitrage ... 191
Figure 6.64: Sensitivity Analysis for the lithium-ion battery ... 192
Figure 6.65: Sensitivity Analysis for the redox flow battery ... 192
Figure 6.66: Marginal revenues for additional energy capacity (2011-2015, 1-Hour contract) ... 193
Figure 6.67: Marginal revenues for additional energy capacity (2015, 15-Minutes contract) ... 193
Figure 6.68: Net present value depending on magnitude and probability of price jumps ... 194
Figure 6.69: Simulated price path with more frequent and more pronounced jumps ... 195
Figure 6.70: Realizable revenues in the 1-Hour market by the backward-looking approaches in comparison to perfect foresight ... 195
Figure 6.71: Realizable revenues in the 15-minute market by the backward-looking approaches in comparison to perfect foresight ... 196
Figure 6.72: Contracted volume for Primary Reserve Control ... 198
Figure 6.73: Number of accepted bids and average bid size ... 198
Figure 6.74: Boxplot of historic tender results ... 199
Figure 6.75: Distribution of maximum accepted bids ... 199
Figure 6.76: Fluctuation of average accepted bid from period to period ... 200
Figure 6.77: Bidding curves for three consecutive weeks ... 200
Figure 6.78: Bidding based on historical information ... 201
Figure 6.79: Revenues under perfect foresight for providing primary reserve control ... 202
Figure 6.80: Revenues under a simple bidding process for providing primary reserve control ... 202
Figure 6.81: Development of cumulative revenues from 2012 - 2015 ... 203
Figure 6.82: Cash flows over the storage lifetime ... 204
Figure 6.83: Sensitivity analysis: loan tenor ... 204
Figure 6.84: Sensitivity analysis: financing cost ... 205
Figure 6.86: Sensitivity analysis: fixed annual cost ... 206
Figure 6.87: Sensitivity analysis: storage investment cost ... 206
Figure 6.88: Sensitivity analysis: storage lifetime... 206
Figure 6.89: Sensitivity analysis: annual revenues ... 207
Figure 6.90: Net present value distribution of the Monte Carlo simulation for the provision of primary reserve control ... 208
Figure 6.91: Cumulative cash flow distribution of the Monte Carlo Simulation for the provision of Primary Reserve Control ... 208
Figure 6.92: Net present value distribution of the Monte Carlo Simulation for the provision of Primary Reserve Control with a lifetime guarantee ... 209
Figure 6.93: Value added by storage applications ... 212
Figure 6.94: Required grid connection capacity along the year ... 212
Figure 6.95: Comparison of grid demand with and without storage ... 213
Figure 6.96: Required grid connection capacity ... 213
Figure 6.97: Tendered storage capacity for the provision of reserve control ... 213
Figure 6.98: Sensitivity plot ... 214
Figure 6.99: Historic growth ([132]) as well as forecast of new storage installations ([204]) ... 217
Figure 6.100: Sampled combinations of demand and system capacities ... 218
Figure 6.101: Load profile during a week in winter and in summer ... 218
Figure 6.102: Average impact from new photovoltaic and storage installations ... 219
Figure 6.103: Estimated absolute impact on power exchange with the grid ... 220
Figure 6.104: Change in the load duration curve ... 220
Figure 6.105: Comparison of net grid load ... 220
Figure 6.106: Daily impact along the year 2022 ... 221
List of Tables
Table 2.1: Storage technologies (based on [20]) ... 7
Table 2.2: Control Reserves ... 14
Table 3.1: General simulation parameter ... 44
Table 3.2: Operational parameters and variables of a storage device ... 46
Table 3.3: Parameters for the financial evaluation ... 48
Table 3.4: Financial evaluation ... 49
Table 3.5: Available systems as well as power and heat flows ... 53
Table 3.6: Indicators for the evaluation of storage systems ... 67
Table 3.7: Dispatch from the LP with simultaneous charge- and discharge operations ... 69
Table 3.8: Dispatch from MIP with correct operations under negative market prices1 ... 70
Table 4.1: Uncertain factors ... 93
Table 4.2: Qualitative estimate of the causal connections of uncertainties ... 94
Table 4.3: Baseline: expected development of uncertain variables ... 95
Table 4.4: Scenario 1: development of uncertain variables... 96
Table 4.5: Scenario 2: development of uncertain variables... 96
Table 4.6: Scenario 3: development of uncertain variables... 97
Table 4.7: Scenario 4: development of uncertain variables... 97
Table 5.1: Impact of new PV and storage installations for time shifting on market prices ... 129
Table 5.2: Impact of new PV, CHP and storage installations for time shifting on market prices ... 130
Table 5.3: Impact of refitting existing PV installations with storage on market prices ... 131
Table 5.4: Impact of arbitrage operations on market prices depending on the aggregated capacity ... 133
Table 5.5: Power exchange with the grid (winter) ... 135
Table 5.6: Power exchange with the grid (summer) ... 136
Table 6.1: Simulation parameters ... 141
Table 6.3: Parameters of the thermal storage device ... 145
Table 6.4: Parameters of the photovoltaic installation ... 146
Table 6.5: Parameters of the solar-thermal installation ... 146
Table 6.6: Associated parameters of the cogeneration installation ... 147
Table 6.7: Parameters of the heat pump ... 148
Table 6.8: Parameters of a gas boiler ... 149
Table 6.9: System capacity constraints ... 149
Table 6.10: Electricity tariff parameters ... 150
Table 6.11: Feed-in tariffs ... 151
Table 6.12: Considered system capacities ... 158
Table 6.13: Net present value of the considered system configurations ... 159
Table 6.14: Comparison of power flows as well as classification numbers ... 160
Table 6.15: Comparison of heat generation ... 160
Table 6.16: Cost for electricity import under different tariff schemes ... 173
Table 6.17: Net present value under different tariff schemes ... 173
Table 6.18: Comparison of assumed parameters under the different scenarios ... 175
Table 6.19: Expected NPV and result variability of the three system configurations ... 175
Table 6.20: Ranking of alternatives depending on the decision making objectives ... 176
Table 6.21: Market price statistics (year 2011-2015) ... 178
Table 6.22: Parameters of the storage systems for pursuing arbitrage ... 182
Table 6.23: Parameters of the lithium-ion battery for the provision of primary reserve control ... 201
Table 6.24: Capital financing cost ... 203
Table 6.25: Assumptions for the provision of reserve control and peak shaving ... 210
Table 6.26: Net present value for different dispatches ... 211
Table 6.27: Composition of retail electricity price [197] ... 221
Table 6.28: Comparison of payments ... 222
List of Acronyms
CAES Compressed air energy storage
CHP Combined heat and power
DSO Distribution system operator EES Electrical energy storage IRR Internal rate of return LCOE Levelized cost of electricity LCOS Levelized cost of storage
LP Linear program
MIP Mixed integer program
NPV Net present value
PHS Pumped hydroelectric storage
PV Photovoltaic
TSO Transmission system operator
List of Symbols
Symbol Unit Description
General simulation parameter
t - Index
Δt - Fraction of an hour between two time steps
T, THours,TDays, TYears - Number of total time steps as well as number of hours / days / years during T
System components
CHP - Combined heat and power plant
GB - Gas boiler
Grid - Grid connection
HP - Heat pump
Load - Local demand
PV - Photovoltaic system
ST - Solar thermal system
Storage - Electric storage device ThStorage - Thermal storage device
System parameters
The subscript of a variable indicates the relevant system component. Capacity
Storage
E [Wh] Nominal capacity of the storage device
Operating Cycle Calendric System
L , , [a, -, h] Calendric lifetime (in years), cycle lifetime (in equivalent full cycles) or operating lifetime (in hours)
Capacity System P [W] Power capacity in feed max PV
P [W] Maximum permissible feed-in power of a PV installation
n CapacityMi CHP
P [W] Minimum power output of a cogeneration unit
δStorage [%] Depth of discharge of the storage device
Storage
,StorageIn ,
Out Storage
[%] Roundtrip / charging / discharging efficiency of the storage device
ϕStorage [%] Self-discharge per hour of the storage device
Simulation variables
CoP(t) - Coefficient of performance of a heat pump
) (t
EStorage [Wh] Current charge of the storage device
H(t) [W] Heat flow
) (t
HThStorageIn ,H (t)
Out
ThStorage [W] Heat absorbed / supplied by the thermal storage device
P(t) [W] Power flow
) (t
PGridImport , PGridExport(t),
) (t
PGridExportPV ,PGridExportCHP(t) [W] Power exchange with the grid
) ( * t
PPV , HST* (t) [W] Available generation from intermittent resources )
(t
PStorageIn ,P (t)
Out
Storage [W] Power absorbed / supplied by the electric storage device
) (t
PRegulationCapacity [W] Tendered capacity for the provision of reserve control
Capacity Grid
P [W] Grid connection capacity
N(t) - Number of equivalent full charge- and discharge cycles SoC(t) [%] State of charge
y(t) - Binary decision variable for the operation of the storage device
z(t) - Binary decision variable for the operation of the cogeneration unit
Financial parameters
a [€] Sum of attributable fixed annual cost for each time step β(t) [€] Sum of variable operation cost
CInvest [€] Investment cost
CFixed [€/a] Fixed cost
CVariable [€/Wh] Operating cost
Capacity Grid
C [€] Grid connection cost
Benefit CHP
C [€] Incentive payment for the operation of a cogeneration unit
CF(t), CFLoant(t) [€] Cash flow, cash flow from financing
irr [%] Internal rate of return
LCOS [€/Wh] Levelized cost of storage
Loan [%] Amount of loan in percent of the investment amount
NPV [€] Net present value (subscripts indicate different system configurations)
rEquity [%] Required return hurdle for equity financing
rLoan [%] Interest rate for debt financing
TLoan - Debt tenor in time steps
Benefit CHP
T [a] Duration of the incentive payments
Electricity prices
R(t) [€/Wh] Electricity market price (t) RImportflat , R (t) Import TOU , (t) RRTPImport
[€/Wh] Flat / time-of-use / real-time pricing tariffs
) (t
RPVExport , RCHPExport(t) [€/Wh] Feed-in tariff for photovoltaic systems and cogeneration
units RRegulation(t), ) (t RiRegulation , ) (t RmaxRegulation [€/W]
Compensation for the provision of reserve control, compensation for the specific bid i in ascending order, marginal bid for the provision of reserve control
Modelling of electricity prices
X(t) [€/Wh] Trend and seasonality
J(t) [€/Wh] Price jumps
S(t) [€/Wh] Stochastic residuals
αi - Coefficients of a linear trend for the modelling of X(t)
λjump_up, λjump_down - Parameters of the exponential distribution
αjump_up, αjump_down - Up- / down-shift of the exponential distribution
δjump_up, δjump_down - Probability of occurrence of a price jump
ε(t) - Error term
Other
Ak - Investment alternatives
F(x) [%] cumulative distribution function
Hurdle [€/Wh] Minimum revenue requirement for the arbitrage dispatch LB(t), UB(t) [€/Wh] Upper and lower bounds for the arbitrage dispatch
LF [%] Load Factor
pi [%] Probability of outcome i
rgik [€] Regret for decision alternative Ak under scenario Si
σ - Standard deviation
Sk - Sensitivity towards parameter k
Si - Potential future states i
SC [%] Self-consumption
SS [%] Self-sufficiency
Ui - Uncertainty of parameter i
Chapter 1
1 Introduction
1.1 Context
Renewable electricity generation, especially from wind and solar, is growing with a fast pace around the world. In contrast, conventional technologies are facing increasing headwind, driven by environmental concerns about greenhouse gas emissions and air pollution. Furthermore, the expectation of rising fuel prices in the long-term as well as the internalization of external effects (such as taxes on CO2 emissions) challenge the economics of thermal power plants. Contrary, renewable technologies are becoming increasingly competitive, driven both by technological advances as well as a decrease in the investment cost due to manufacturing improvements as well as economies of scale. Consequently, the contribution of electricity generation from renewable resources is on the rise. It is likely that this trend will continue with more governments implementing regulations to induce the increase of the share of renewables.
The energy roadmap of the European Union foresees a reduction in greenhouse gas emissions of 80% - 95% by the year 2050 as compared to 1990 levels [1]. A major contribution towards these savings is expected to come from the power sector. Until 2030, the power sector is expected to reduce its CO2 emissions by 54% - 68% as compared to 1990. In order to achieve this goal, the contribution from renewables to total electricity generation needs to increase from 27.5% in 2014 [2] to at least 50% in 2030 [3].
However, this electricity generation paradigm change does not only require significant investments in renewable generation technologies, but has a range of further implications and far reaching consequences. Whereas conventional generation relied on a centralized system, renewable generation is usually much more distributed due to the availability of resources. Furthermore, most renewable resources depend on local, non-controllable weather conditions, and therefore cannot be dispatched when required. So far, the electric system has been designed around the assumption of load following, that is, generation will adapt to demand. With low shares of intermittent resources, fluctuations from their contribution can be compensated by traditional power plants. Hence, low shares of renewable generation can be easily integrated and its curtailment is rarely needed. However, with an increasing share of distributed and non-dispatchable units, this will become more and more challenging in the future clearly indicating that power systems have to evolve towards a larger flexibility both in expansion planning and operation phases.
Flexibility in the electric system can be provided by several options [4], [5]. One approach to address or at least mitigate the issue is to use demand-side management that includes strategies to shift loads from periods with low intermittent generation to periods with high intermittent generation. Thereby, the mismatch between demand and generation can be diminished at the cost of slightly reduced
comfort at times. However, these measures are not restricted to reducing demand. Additional equipment like power-to-heat appliances can be easily dispatched when a generation surplus exists. In addition to increasing the flexibility of demand, also the generation of electricity can be closer aligned to the residual demand. For example, dispatching combined heat and power plants according to electric instead of thermal demand increases their value to the grid significantly. Furthermore, the mismatch between available generation and demand can also be further reduced by an increased exchange with neighboring grid zones or countries. However, this requires both sufficient interconnection capacity as well as suitable regulatory frameworks.
These efforts towards a ‘smart-grid’ will be able to mitigate many of the arising problems in the short-term and will allow a smooth transition to a more sustainable electricity system. Storage as another flexibility option has the major advantage of being able to act on both supply and demand side. In addition - depending on the implemented technology - it has very short ramping times and can therefore react quickly. With a further rising share of non-dispatchable renewable generation, storage can therefore guarantee the constant simultaneous balance between supply and demand by transferring energy from periods with an excess of renewable generation to periods with insufficient supply from renewables. Besides facilitating the integration of renewables in the system, storage devices are able to provide a range of further services which are required to ensure the stable and secure operation of the grid, such as the provision of ancillary services. In the long-term, storage can therefore deliver the missing link between a primarily renewable, non-dispatchable generation system and demand.
Despite their versatile capability and their technical appeal to solve a wide range of issues, storage systems apart from large-scale Pumped Hydro Stations (PHS) have not yet seen a widespread implementation. Over the past years, worldwide installed storage capacity grew annually only by about 2.7% [6]. In addition to technical, regulatory and political issues, this can be attributed to the missing confidence about the economics of storage [7].
1.2 Motivation
Currently, 97.5% of grid-connected storage capacity are large-scale PHS [6]. However, traditional power station operators are experiencing increasing economic pressure from shrinking margins caused by lower electricity wholesale prices, which are driven down by photovoltaic and wind feed-in with (almost) no marginal cost. Hence, financing for future storage installations needs to come from alternative sources, such as private agents or cooperatives.
The investment in a storage device requires the definition of a business case, which describes how the storage device will be operated in order to generate a profit. Such a business case must not only be realizable under the current legal and regulatory framework, but the operator must also be able to access the relevant revenue stream. This makes many potential opportunities uninteresting for private investors, as no immediate compensation for their provision is defined.
Previous research on storage has primarily focused on the deployment of large-scale systems connected to the transmission grid. Traditionally, the arbitrage of energy prices played a major role, which describes a strategy where energy is stored when prices are low and fed back into the grid when higher prices prevail. While this business case has been extensively covered in the literature (for example in [8]–[10]), previous research focused on large-scale installations at the transmission grid-level. Using small-scale storage devices in a distributed context requires the consideration of several additional factors in the dispatch, such as the limited cycle lifetime of battery systems. Furthermore, extensive negative or zero market prices as well as the introduction of shorter contract tenors are recent developments, which have only partially been reflected in the current state of the art.
In addition to arbitrage, the identification and definition of further business cases is required to attract investments in storage. Given the increasing share of distributed generation resources and rising electricity cost driven by fees and taxes, the installation of storage behind the meter to increase the self-sufficiency of consumers appears promising ([11], [12]). Furthermore, with an increasing share of
fluctuating non-dispatchable resources in the generation mix as well as a decreasing capacity of traditional generators, the provision of ancillary services will gain in relevance and is an attractive opportunity for storage operators ([8], [9]).
By combining and integrating several applications, storage systems can theoretically serve more than just one purpose simultaneously and capture multiple value streams in parallel ([13]). While this has been widely suggested as a way to improve the economic performance of storage, little research has been done to look into the valuation of multi-purpose systems. Therefore, the formulation of a dispatch algorithm is required, which considers technical constraints as well as manages conflicting operational requests.
Based upon the proposed business case and the formulated dispatch algorithm, the storage device can then be evaluated from a financial point of view. The initial investment cost for small- to medium scale systems can typically be estimated accurately by either requesting commercial proposals to manufacturers or a price comparison of pre-configured systems. Contrary, the identification of benefits and the valuation of potential value streams of a storage system is much more complex and requires careful consideration of storage specific characteristics, such as the limitation of battery systems to both a calendric lifetime as well as a maximum number of cycles.
Wide-scale investments in storage systems will only occur once they become economic viable. However, the high complexity of the evaluation as well as the novelty of its application in a distributed context and the resulting lack in regulation makes it difficult to establish a clear value proposition for storage. Besides the complexity of valuation, uncertainty about the impact of future regulation and the sustainability of profits confirm investors in their wait-and-see attitude. While the application of a storage system might be economically interesting today, regulatory changes or a change of electricity price patterns might leave investors with lower than expected returns during the lifetime of the storage system. Therefore, many potential investors are still hesitating to adopt storage and are deferring their investment decisions.
Hence, the formulation of an evaluation framework, which also takes this uncertainty and the resulting financial risk into account, is required. While a wide set of such tools exists, suitable approaches must be selected and adapted to the storage context. Based thereupon, the impact of uncertain factors such as technical properties on the viability of the business case can be analyzed and included in the decision process. For business cases exposed to electricity market prices, the associated uncertainty should also be included in the analysis which means that the simulation of market prices is required. Furthermore, previous research typically assumes perfect foresight, that is complete knowledge about future demand and generation. However, it remains unclear how much of this theoretical value can be recovered in a real installation. Therefore, an evaluation approach is required which does not only identify the theoretic optimum profits of a business case, but also provides an estimate of the profits that can be expected in reality.
While this uncertainty is common to many investment decisions, it becomes more complex for storage systems due to the potential reverse feedback that new installations might provoke. Once storage has been widely implemented, former benefits could disappear, such as pursuing arbitrage reduces price spreads and hence decreases available revenues. This not only makes additional investments less interesting from an economic point of view, but it also deteriorates the initial business case upon which an investment decision was taken. A complete investment evaluation therefore should not only consider uncertainty in the evaluation process, but should also estimate the deployment impact on the market and other agents as well as incorporate their estimated feedback reaction in the initial investment proposal. Therefore, an analysis of both the impact on the supply and demand balance as well as on market prices is needed.
1.3 Objectives
The goal of the research that was developed is to evaluate the economic benefits of distributed energy storage systems, which can be accessed by a private agent, determine the risks associated with an investment in such a system and analyze its impact on electricity markets. Based on the presented motivation and the identified gaps in the current literature, this research intends to address the following objectives:
Definition of commercial business models for electric storage devices and formulation of the required dispatch algorithms in order to analyze their value proposition.
Characterization of an evaluation framework, which takes uncertainty and the arising financial risk into account.
Identification of additional value potential by providing multiple services simultaneously by a single storage device.
Assessment of the impact of storage implementations on electric grid demand and electricity market prices.
Identification of reciprocal feedback of storage implementations on the initial value proposal of the investment.
This research will focus on storage applications in a commercial context. Therefore, only business cases that can be accessed by a private agent will be considered. Furthermore, the focus will be on small-scale storage systems that can be deployed in a distributed manner, such that they can be installed behind the electric meter. Last, only electric storage devices will be considered.
1.4 Structure of the Document
This thesis is organized in seven chapters, which build upon each other.
The current (first) chapter gives an introduction to the topic of energy storage and its importance. Context, motivation, objectives and the structure of the document are presented.
Chapter two presents the current state of the art by means of a literature review. First, storage technologies are classified and their suitability is discussed. Following, an introduction to the different markets for electric energy is given. Thereafter, different business cases for storage systems are analyzed, including a review of several related areas such as ownership implications and the current regulatory framework. Furthermore, the economic evaluation of storage systems is considered. Last, existing work about the impact of energy storage systems on the electric system and energy markets is reviewed.
In chapter three, the business cases for three different commercial storage applications are presented: shifting of energy in a consumer setting with local generation resources in time, arbitrage of electricity prices and the provision of ancillary services. In addition, the co-integration of applications is considered. For each case, a dispatch model is formulated and an evaluation approach is specified dependent on the individual context of each application. Furthermore, for each case, a dispatch algorithm without foresight is formulated.
Following, in chapter four it is shown how uncertainty and the arising financial risk can be incorporated and considered in the evaluation. Therefore, several methodologies are presented and adjusted to the specific context of storage investments.
Chapter five analyses the impact of storage implementations on the electric demand seen by the grid. Therefore, the application of time shifting as well as arbitrage is considered. Based thereupon, it is estimated how the deployment of storage devices influences electricity prices.
In the sixth chapter, the three presented business cases are each applied to a case study. Furthermore, the co-integration of multiple applications is demonstrated. Each case is accompanied by an analysis, where further aspects beyond the economic viability are considered and the methodologies from chapter four are applied. Last, the combined impact from a wide-scale rollout of storage installations on grid demand is analyzed.
The final part of this document, chapter seven, summarizes the contributions of this research and recapitulates the most relevant conclusions. This document is completed by an outlook about opportunities for future work.
Chapter 2
2 State of the Art and Literature Review
Abstract
Chapter 2 provides an overview of relevant literature and establishes the current state of the art in the field of the economic evaluation of storage systems and their impact on electricity markets. Therefore, first a brief overview of available storage technologies with their characteristics, advantages and drawbacks is given. Thereafter, potential commercial applications for storage systems are discussed. Following, the literature about economic evaluation approaches is reviewed. At the end of this chapter it is addressed the current state of the art about the impact of energy storage systems on energy markets.
2.1 Energy Storage Systems
Electrical energy storage (EES) has recently experienced a strong increase in interest, driven by the growth of distributed energy resources and renewable energy sources. EES is based on processes which convert energy to a storable form, and convert it back to electricity when required. EES is considered as a complementary technology to distributed generation technologies and renewable energy resources, as it allows to balance load and the intermittent, variable generation as well as secures power supply and quality [14], [15]. The concept of EES was developed by the end of the 18th century by Alessandro Volta, who invented the first battery [16]. Since then, it has been refined and many further approaches to store electricity have been developed.
2.1.1 Classification
Storage systems for electrical energy can be broadly categorized into two groups: power and energy applications [17], [18]. Systems from the first group have typically high power ratings and very short reaction times. However, their energy capacity is usually limited. They are therefore mostly installed for power quality or reliability purposes. On the contrary, storage systems designed for energy applications can usually store energy for longer times, but lack the short-term power ratings and flexibility [14], [19]. While this classification allows a broad categorization, many storage technologies fall somewhere in between and can be counted to either group, depending on their particular design and configuration. Another wide-spread approach for the classification of storage is according to its scale of implementation (for example in [20]), ranging from small- to medium- to large-scale installations. However, this approach ignores that several storage technologies can easily be scaled to the desired capacity. Alternatively, EES can be classified according to how the energy is stored. In [20], the authors differentiate among devices using mechanical, electrical, electro-chemical
and chemical storage. The following review of storage technologies will focus on electric storage technologies only, which are commercially available or in an advanced stadium of development. Table 2.1 provides a guide and overview of the discussed technologies in the following review.
Mechanical storage Electrical storage Electro-chemical
storage Chemical storage
Pumped hydroelectric Compressed air Flywheels (Super-) Capacitors Superconducting magnetic energy storage Lead-acid Nickel-cadmium Nickel-metal hybrid Lithium-ion Sodium-sulfur Redox flow Fuel cells Power to gas
Table 2.1: Storage technologies (based on [20])
2.1.2 Mechanical Storage
Mechanical storage systems use electricity to create mechanical energy, such as potential or kinetic energy. This energy can then be converted back to electric energy when required. Commercially available systems are pumped hydroelectrical storage systems, compressed air storage systems and flywheels.
Pumped Hydroelectric Storage
The most prominent large-scale storage technology is pumped hydroelectric storage (PHS). PHS converts electrical energy into potential energy by pumping water from a lower reservoir up to another reservoir at a higher elevation. Electricity is regained by the sequential release through a turbine. This technology is very mature, operates at an efficiency of 70-85%, has low self-discharge rates, allows the storage of comparably huge quantities of energy over long time periods and has a long lifetime of typically 50-60 years. It is mainly used for shifting energy from periods with low-demand to peak hours, but can also be operated for the provision of reserves [14], [20]. In the U.S., PHS constitutes 95% of installed storage capacity [21]. Despite being the most prominent storage technology, it only represents approximately 3% of global generation capacity [22]. Additional locations besides the already existing installations are limited in many regions. While efforts are ongoing to expand existing facilities, new installations are limited by favorable natural conditions and environmental concerns.
Compressed Air Energy Storage
Compressed air energy storage (CAES) systems also depend on appropriate natural conditions. While the technology itself is mature, with only two operating large-scale installations it cannot compete with the maturity level of PHS. Electric energy is used to compress air, which is stored in underground caverns. To recover the energy, the compressed air is released to drive a turbine in order to generate electricity. Two different system designs exist: diabatic, which requires the burning of gas to reheat the air, and adiabatic, where the heat from the compression process is recovered and later reused during the expansion process. Current designs therefore are usually based on the adiabatic process due to its increased efficiency (about 70% versus only about 50% for the diabatic design). Lifetime estimates range from 25-40 years. Due to their slow reaction time, CAES installations are usually used to store energy during periods with low demand and provide energy during peak hours. While CAES is theoretically capable of storing huge amounts of energy like PHS, the technology has not yet seen a widespread usage due to its lower efficiency and requirements for appropriate geologic formations [14], [15], [20], [22].
Flywheels
Flywheels store energy as rotational, kinetic energy by spinning a mass. To store energy, a motor is used to spin up the flywheel. To release energy, the flywheel is slowed down again and the same motor acts as a generator. Flywheels usually have magnetic bearings and operate in a vacuum to minimize friction. They have a high power density, an almost unlimited number of charge- and discharge cycles, quick reaction times and are environmentally friendly. While flywheels achieve efficiencies of up to 95%, they suffer from high standby losses due to friction. Furthermore, energy density is comparably low (discharge durations of a few seconds to a few minutes). Flywheels are a mature, commercially available technology and are typically used for frequency regulation and the provision of ride-through capability for short durations [14], [20], [23].
2.1.3 Electrical Storage
As opposed to mechanical storage systems, supercapacitors as well as superconducting magnetic storage systems do not use any intermediate form of energy and hence do not require converting the stored energy to electric energy.
Supercapacitors
Supercapacitors store electricity directly by accumulating positive and negative charges. Therefore, response times are very fast, as no conversion is required. In addition, supercapacitors have long lifetimes (8-10 years), high efficiencies (about 95%), high power densities (10 000 W/kg) as well as long cycle lifetimes. However, high self-discharge losses and low energy capacities limit their application potential to similar cases as flywheels. While first supercapacitors are already commercially available, development is still ongoing [15], [20], [23].
Superconducting Magnetic Energy Storage
Superconducting magnetic energy storage stores electricity in a magnetic field, generated by direct current flowing through a superconducting material. Besides requiring substantial energy itself for cooling and becoming superconducting, the technology is very cost intensive and generates strong magnetic fields. They have high efficiencies (about 97%), very quick reaction times with high charging- and discharging power ratings as well as a virtually unlimited cycle lifetime. As energy density is low, most installations of superconducting magnetic energy storage have been for voltage stability and power quality issues [14].
2.1.4 Electro-Chemical Storage
Electro-chemical storages are best known for their usage in household devices in the form of batteries. Batteries are EES that store electricity through a reversible chemical reaction. This reaction takes place in an electro-chemical cell, which usually consists of two electrodes and an electrolyte material. Depending on voltage and power requirements, these individual cells can be easily scaled / arranged to obtain the desired power and energy capacity [22]. Technological development of batteries over the last 25 years was mainly driven by demand for consumer electronics. Only in the last decade, research for suitable EES for electric vehicles advanced battery technologies for medium to large-scale systems as they are required for application in a smart-grid. Besides improvements of technical characteristics, huge progress was also made in their efficiency, reliability and in the cost for the required power electronics [19].
Lead-Acid, Nickel-Cadmium and Nickel-Metal Hybrid Batteries
Lead-acid batteries are the oldest battery type and a very mature and wide-spread technology. Their popularity stems from their versatility, low cost and high reliability. Lead-acid batteries have an efficiency of usually 65-80% and considerable self-discharge rates. Cell lifetime is typically 500 - 2 000 cycles. In addition, they usually require regular maintenance, have comparably low energy
densities (30-50 Wh/kg), long charging times and can emit explosives gases. Lead-acid batteries are used in a wide range of applications, both in small-scale installations for power back-up as well as in large-scale installations for grid support [14], [15], [20].
As compared to leadacid batteries, nickelcadmium batteries have a longer life expectancy (2 000 -2 500 cycles), a higher energy density (50-70 Wh/kg) as well as lower maintenance requirements [15], [24]. However, due to the toxic nature of cadmium, they were banned for most uses in the European Union. In addition, nickel-cadmium batteries should be fully discharged before the next subsequent charge cycle to avoid a “memory effect”, which reduces the battery capacity. Their usage in combination with intermittent energy resources therefore requires additional battery management techniques [14], [15].
Nickel-Metal hybrid batteries demonstrate an improved performance against lead-acid and nickel-cadmium batteries. In addition, they lack the environmental toxic components lead and nickel-cadmium. However, their 25-40% higher energy density must be weighed against their higher self-discharge rate, which makes them unsuitable for long-term storage [24], [25].
Lithium-Ion Batteries
Lithium-ion batteries are dominating the market for small, portable electronic devices. They have an even higher energy density (up to 2 000 Wh/kg), long lifetimes (more than 3 000 cycles), very low self-discharge rates, high power-ratings and reach efficiencies of 95%. Their main drawbacks are their high costs as well as strict operational limits [15], [24]. Due to their compelling characteristics, lithium-ion batteries are experiencing a strong increase in interest for usage in electric vehicles and small installations despite their high capital cost.
Sodium-Sulfur and Sodium-Nickel Batteries
Sodium-sulfur batteries require an operating temperature of about 300 - 350°C. Besides this demanding requirement and the associated high energy usage to keep the battery at this temperature, they exhibit many desirable features: a lifetime of 2 500 cycles, high power density (150 – 240 Wh/kg) and a good efficiency (75-90%) [15]. However, sodium-sulfur batteries have rather high capital cost. A competing battery based on sodium-nickel with similar characteristics is marketed as ZEBRA battery. Compared to sodium-sulfur batteries, ZEBRA batteries have improved operating limits at the price of lower power density (120 Wh/kg). Both battery types are currently manufactured by only one supplier each [14].
Flow Batteries
Like regular batteries, flow batteries store energy through a reversible chemical reaction. Their operation is however more comparable to a rechargeable fuel cell. A liquid electrolyte is pumped through a cell stack, where an ion exchange takes place, converting chemical energy to electricity and vice versa. As the liquid electrolyte can be stored externally, a flow battery can be efficiently scaled, both in terms of power (by adding additional cell stacks) as well as in terms of energy (increasing the volume of the electrolyte liquid). Flow batteries operate at ambient temperature and experience no self-discharge, but require a rather complex operating system as compared to regular batteries. They have lifetime expectancies of about 10-15 years, and are typically used for time shifting of energy. Several variants of flow batteries are being researched with slight technical variations. Commercially available representatives are vanadium redox batteries (reaching efficiencies of up to 85%) and zinc-bromine batteries (about 75% efficient) [14], [19], [20].