The Impact of Government-Sponsored Venture Capital (GSVC)
on the Performance of Portuguese SMEs
Carolina Alves Malta Vacas, no. 3140
A project carried out on the Master in Finance Program, under the supervision of: Professor Qinglei Dai
The Impact of Government-Sponsored Venture Capital (GSVC) on the Performance of Portuguese SMEs
Abstract
This paper studies the impact of financing by a particular set of Government-Sponsored Venture Capital (GSVC) funds, the Revitalizar VC Funds, on the performance of Portuguese SMEs measured by employment, sales and sales to total assets growth. Through an analysis using a control group of non-GSVC-backed SMEs, I conclude that in the short-term GSVC funding seems to hinder efficiency, does not seem to significantly relate to sales growth in high-tech industries and significantly relates to decreases of sales growth in low-tech industries. Contrastingly, GSVC-backed SMEs display a significantly higher performance in terms of employee growth, particularly for the high-tech industries.
Keywords
1. Introduction
Recently there has emerged a trend for governments to increase their involvement in venture capitalist activities, particularly when it comes to the funding of Small and Medium Enterprises (SMEs henceforth) in developed countries. This study will focus on the analysis of the
Revitalizar Venture Capital Funds, which were created within the remit of the Portuguese
Ministry of Economy, and whose aim is to promote the growth and expansion of Portuguese SMEs. These funds can be classified as Government-Sponsored Venture Capital (GSVCs henceforth) funds which are a type of Government Venture Capital (GVC henceforth) funds that are owned by the government but operated by private VC (PVC henceforth) firms, unlike the most common type of GVC funds, which are both owned by the government and operated by public VCs. GSVCs were created as an attempt to overcome management issues commonly affecting public organizations, such as distortions caused by the desires of interest groups to maximize their own private benefits, by giving their management to highly experienced PVCs. The total capital raised to establish these funds amounted to 220 M€, and
they were launched in 2013, finishing their first investment cycles by the end of 2015. The purpose of this study is to determine the impact of financing by GSVCs on the performance of Portuguese SMEs measured by employment, sales and efficiency of assets growth.
SMEs represent an important share of the Portuguese economy and foster innovation, economic growth, employment and the creation of value added (2016 SBA Fact Sheet: Portugal 2016). However, a typical problem faced by these enterprises is the lack of funding, caused by large asymmetric information between financiers and the SMEs. Over the last decades, venture capitalists have raised an interest in funding such enterprises, trying to take advantage of their superior capacity overcome informational asymmetry faced by traditional sources of funding (Amit et al., 1998). Nowadays, the supply of VC capital is vastly different from country to country owing to the different legal, historical and institutional contexts (Cumming et al., 2017).
In Portugal, venture capital, as well as other alternative financing sources, such as private equity and financing by business angels, are still minimal and rather underdeveloped (2016 SBA Fact Sheet: Portugal 2016). Nonetheless, as of 2008, the country’s business environment has improved considerably, and the presence of VC capital has increased. Inclusively, the government itself has begun to engage in the VC sector, under the GSVC financing scheme. Hence, determining whether this particular type of financing produces significantly better outcomes in terms of firm performance when compared to traditional forms of financing is a matter that is crucial to analyse, in order to determine whether the Portuguese government’s efforts on creating GSVCs had a positive impact on the financed SMEs.
From a policy viewpoint, GVC is the most intriguing and under-researched kind of VC financier (Luukkonen et al., 2013). There is still much room for new research in trying to understand its mechanisms and consequences, particularly in Europe, where despite the high (and growing) number of GVCs, the existing literature on their impact on the financed companies' performance is very limited (Cumming et al., 2017).
One of the main reasons why Portugal constitutes an attractive target for this study is the fact that its VC market is still on its early developing stage, the perfect moment to start formulating public policies based on the results witnessed, that could determine the future of the sector. In addition, most existing literature conducted on GVC-backed firms’ performance focuses on relatively more developed European VC markets (Alperovych et al., 2015; Cumming et al., 2017; Grilli et al., 2014). The relevance of having literature on VC markets in distinct stages of development is highlighted by Brander et al. (2015), who found evidence that GVC investors play a greater role in earlier stages of the VC market than in more developed markets.
Indeed, this research aims at offering an assessment on the impact of GSVCs on SME performance, providing empirical validation to complement the existing literature on the impact of this particular type of indirect intervention of governments in European VC markets, by
adding evidence on a relatively new and unstudied market with unique features. In other words, the purpose of this study is to answer the question “Does GSVC funding improve the performance of financed SMEs in Portugal?”.
I find that, the GSVC funds seem to have targeted SMEs which were on average larger and less efficient that the average non-GSVC target. Furthermore, in the short-term, GSVC funding seems to hinder the efficiency of assets, measured by the sales/total assets ratio, does not seem to significantly relate to sales growth in high-tech industries and even appears to be linked to declines of sales growth it in low-tech industries. However, GSVC-backed SMEs do display a significantly higher performance in terms of employee growth, particularly for the high-tech industries. In total, the impact of the funds appears to be more related to employment rather than sales growth or efficiency.
The remainder of the paper is organised as follows. Section 2 provides an outline of the Portuguese SME sector and on the GSVC funds under scrutiny. Section 3 briefly examines the relevant literature and outlines the main research hypotheses. Section 4 includes the description of the methodology, followed by section 5 which introduces the data used and contains some descriptive statistics. Section 6 is devoted to the empirical analysis of impact of GSVC on SMEs’ performance. Section 7 contains concluding remarks.
2. Background
2.1. SME Sector Portugal
SMEs have a big role in Portugal’s economy. In 2016, they were responsible for over two-thirds of total value-added, comparing to the EU mean of 57%, and almost four out of five jobs, comparing to the EU mean of about two out of three jobs (2016 SBA Fact Sheet: Portugal 2016). As of 2008, the Portuguese business setting has improved considerably. However, in certain aspects, such as SME’s access to finance, it continues to lag behind most of the EU. Despite the recent improvements on access to finance, credit is still costly and
challenging to access. Notwithstanding substantial government efforts to improve these aspects, e.g. through the creation of tax benefits for financiers and facilitating regulations, alternative sources of financing, such as venture capital, private equity, funding by business angels and crowdfunding are still negligible and rather underdeveloped (2016 SBA Fact Sheet: Portugal 2016). In 2015, SME productivity, measured by the value added per employee, was about 21,000€ per person, which is less than half the EU mean of roughly 43,000€ (2016 SBA Fact Sheet: Portugal 2016). Hence, there is a lot of potential to improve in the upcoming years.
2.1. Introduction to the Revitalizar Venture Capital Funds
This study will focus on the analysis of a specific set of GSVC funds the Revitalizar VC
Funds that integrate a nationwide program called the Revitalizar Program, which comprises
a series of distinct mechanisms that aim at stimulating economically viable enterprises. The purpose of the Revitalizar VC Funds is to capitalize SMEs in order to promote their growth and expansion, contributing to the development of new products and services, internationalization processes and increasing exports. In 2013, three GSVC funds were created according to a predetermined regional coverage. FCR Revitalizar Norte, FCR Revitalizar
Centro, and FCR Revitalizar Sul, responsible for the regions of the North, Center and South of
Portugal, respectively. The total capital raised to establish the funds amounted to 220 M€. Half of this capital was obtained through European Community’s funds and the remaining half was guaranteed by the main banks operating in Portugal. On the one hand, the capital raised from the European Community was channelled through a specific fund called FINOVA, Fundo de
Apoio ao Financiamento à Inovação, whose financiers are specific programs that aim at
boosting the dissemination of funding instruments that can provide better financing conditions to Portuguese SMEs ("FRS" 2017). Indeed, this parcel was made up by FINOVA funds derived from a program called COMPETE (Programa Operacional Fatores de Competitividade), which contributed with 90M€, as well as by two other regional programs, PORLisboa and
Algarve XXI, which correspond to operational programs in the regions of Lisbon and Algarve,
respectively, which contributed with equivalent parcels of 10M€ each ("Novo Apoio Para As Empresas | Disponíveis 220 Milhões De Euros Para PME Nos Fundos Revitalizar" 2013). On the other hand, the remaining half of the capital was facilitated by seven of the largest banks operating in Portugal (CGD, BPI, Novo Banco, BCP, Banif, Montepio Geral and Caixa de Crédito Agrícola). The total capital raised was distributed among the three selected VC firms in order for them to establish each regional fund and manage it independently. The final allocation of capital left FCR Revitalizar Norte and FCR Revitalizar Centro with equal amounts of 80 M€ to invest and FCR Revitalizar Sul with 60 M€.
In order for SMEs to become beneficiary undertakings under this program, they had to respect, cumulatively, a set of conditions imposed by the responsible governmental entities, which include some significant restrictions to the PVCs’ activities, namely to the kind of activities the firms can undergo and the type of financing offered. In order to be eligible, SMEs had to fulfil the more straightforward criteria related to geographic location and being within the European Commission’s definition of SME which stipulates a maximum of 250 employees and 50M€ in annual turnover and/ or 43M€ in annual balance sheet total. Also, SMEs must have developed their activities in a set of predetermined sectors of activity, according to the latest Classificação
Portuguesa das Atividades Económicas (CAE). These include Manufacturing, Energy,
Construction, Commerce, Transportation and Logistics, and Services, although some presented restrictions. Firms from agriculture, coal and steel, shipbuilding, and synthetic fibers sectors, among others, were excluded. Furthermore, there were also some financial restrictions related to the SMEs’ financial health. The program excludes entities subject to a recovery order, following a previous decision of the Commission that declares an aid illegal and irreconcilable with the internal market; societies in financial difficulty, following an interpretation of the
European Union’s Guidelines relative to State aid for rescuing and restructuring non-financial undertakings in difficulty; or societies that are eligible to a collective insolvency process. As mentioned before, there are also guidelines on what type of investments the GSVCs can undergo. The funds have the purpose of investing their patrimony in participations of societies that follow projects focused on expansion, innovation and/or modernization, promoted by SMEs, and that conform with the demands explicit on the legal framework of the Fundo
Europeu de Desenvolvimento Regional (FEDER), as well as projects in establishment or
start-up stages promoted by SMEs. The Revitalizar Venture Capital Funds shall not pursue investments that lay on the consolidation or financial restructuring, or the pure acquisition of credit, or the plain acquisition of equity stakes with no connection with investment projects by SMEs. Refer to Appendix 1 for the full description of the selection criteria.
FCR Revitalizar Norte is managed by Explorer Investments, FCR Revitalizar Centro by OXY
Capital, and FCR Revitalizar Sul by Capital Criativo, which correspond to three of the main
VC fund managers in the country. They initiated their activities in August 2013 and finished their first investment cycle by the end of 2015. In other words, the period stipulated for the investment in new enterprises ended in 2015.
Currently, the funds are starting their second round of financing, which adds to the significance of this study, once the VC fund managers can extract conclusions from the outcomes of the analysis performed on the previous round, and steer this second round of financing accordingly.
3. Literature and research hypothesis
There is a vast literature assessing the influence of VC funding on firm performance. Numerous firm-level studies have established that VC-backed firms grow faster (Bertoni et al. (2011); Davila et al. (2003)), achieve larger scale (Puri et al. (2012)), enjoy better financial and operating performance (Alperovych et al. (2013); Chemmanur et al. (2011); Croce et al (2013)), are more innovative, and are also more prone to going public than non-VC-backed firms
(Gompers et al., 2004).
The VC supply also benefits the business environment as whole, by positively affecting firm starts, employment, aggregate income (Samila et al. (2011)), and innovation, reflected by higher patenting rates present in high-involvement VC markets (Kortum et al. (2000)).
Numerous governments have tried to attain the aforementioned benefits of VC financing by launching their own programs, frequently using GSVC funds (Alperovych et al., 2015). According to Brander et al. (2015), GSVCs are typically privately-owned VC firms, which obtain significant funding, tax benefits, or other subsidies from the government. Therefore, the
Revitalizar VC Funds fall within this category of funds, since the VCs responsible for the
operationalization of the investments are precisely private firms, whereas 50% of the capital invested is public. Moreover, the concrete statutes and covenants applicable to all three funds were determined by public entities, instead of through private negotiations among contracting parties, as it commonly happens in the case of PVCs. Hence, this structure indicates that these funds enjoy public administration and private execution. On that account, and for the purpose of this study, the Revitalizar VC Funds will be considered GSVC funds.
Accordingly, and considering the importance of distinguishing VC financiers according to their governance and ownership structures (Da Rin et al., 2011), it is crucial to analyse literature specifically dedicated to studying the impact of GVC financing on firm performance.
Following the proliferation of the GVC funds across the world, a strand of literature which focuses on their impact when compared to non-VC or PVC financing mechanisms emerged. One of the first studies was conducted by Lerner (1999), who found that small firms in the US enjoyed substantially greater employment and sales growth post-GVC financing. Conversely, posterior studies argued against the positive impact of GVCs on forms’ growth performance. Grilli et al. (2011) concluded that pure GVC is on average found not to exercise any sizable influence on the growth of European SMEs, apart from the case of young enterprises in their
initial stages. Subsequently, the authors amplified their analysis to scrutinize the impact of the different forms of GVC, including cases of syndication with independent VC operators, and beside confirming the negligibility of the impact of pure GVC financiers on growth, they found additional evidence corroborating the positive impact exerted by governmental funds in situations where governments are non-leading partners in VC syndicates (Grilli et al., 2014). The researchers therefore suggest that an indirect form of supporting the VC industry, for instance through the sponsoring of PVC initiatives rather than a direct approach, followed by the Portuguese Ministry of Economy in the creation of the Revitalizar VC Funds, is more beneficial than pure GVC structures in terms of SME growth. In this analysis, I will investigate whether this positive performance in terms of size growth can also be verified in the Portuguese market since this geography has not been included in these previous European-level studies. On the other hand, other metrics of firm performance, such as operating efficiency, have been examined. Using a large sample of small businesses in Belgium, Alperovych et al. (2015) evaluated financed firms’ productivity focusing on the origin of the VC funds, comparing GVC versus PVC and non-VC financiers, and concluded that GVC seems to hinder the post-financing improvement in productivity, restricting efficiency of GVC-backed firms to levels below the ones of non-VC firms. This result highlights a possible drawback of this type of VC financing compared to traditional sources of financing, making it a crucial matter to be evaluated as well. This research aims at offering an assessment on the impact of GSVCs on SME performance, taking into consideration the different metrics used in the aforementioned literature, such employment, sales and efficiency growth, in a way to provide an empirical corroboration for this particular kind of indirect intervention of governments in European VC markets. In other words, the purpose is to answer the question “Does GSVC funding improve the performance of SMEs in Portugal?” by going through a set of sub-questions such as “Do GSVC-backed firms in Portugal have higher employment growth?”, “Do GSVC-backed firms in Portugal have
higher sales growth?”, “Are GSVC-backed firms in Portugal more efficient?” and “Does their performance depend on the industry context and the level of technology associated with it?”.
4. Methodology
In order to evaluate the impact of GSVC on the performance of SMEs, a control sample of non-VC-backed firms was created from the total population of Portuguese firms. This control group was composed of all firms that, that in the year in which the Revitalizar VC funds began their investment cycles, were eligible to receive this type of financing but did not. This control group had a total of 186,986 SMEs and was created from the general population of Portuguese firms, by applying the restrictions of the program, described in Appendix 1. It is important to highlight that although certain restrictions were fully simulated, others, particularly in what the definition of financial difficulty is concerned, were not. The guidelines provided several methods to characterize financial difficulty and some could not be observed using the dataset available. Indeed, the program excludes entities which,
1) were subject to an injunction of recovery, following a previous decision of the Commission that declares an aid illegal and incompatible with the internal market; 2) were in financial difficulty, following an interpretation of the European Union’s
Guidelines relative to State aid for rescuing and restructuring non-financial undertakings in difficulty (2014/C 249/01), namely:
a. limited liability societies, when more than half of their initial share capital and more than a quarter of that capital has been lost in the last 12 months;
b. or societies in each at least one of the partners has unlimited liability relative to the entities’ debt, when more than 50% of his/ her own funds, as indicated in the societies’ accounting, have disappears and more than 15% of those funds have been lost in the last 12 months;
c. or societies of all types of legal natures that fill the conditions to be eligible to a collective insolvency process.
From these definitions, the one relative to the losses of the firms’ initial share capital was the only that could be captured. Hence, the final control group was subject to a less restrictive definition of financial difficulty, and therefore includes a number of firms that could not have been eligible for funding due to their financial conditions.
Using the control group, the approach then concentrates on comparing the performance evolution of both groups of firms, to determine the impact of this particular financing scheme on firm performance. In order to evaluate this impact, I focused on sales and employment growth as measures of performance as these two indicators are widely used in this strand of literature and have proven to highly correlate with the private firms’ valuations by venture capitalists (Gompers et al., 2000), adding to their alignment with performance, and complementing the results with a brief efficiency analysis. The methodology selected to perform this study was an ordinary least squares (OLS) regression framework, using the following model specification:
PercentageGrowthi,2015= α0+ α1Ln(Size)i,2012+ α2 Pre − funding growthi,2012+ α3 Agei,2013+ α4 GSVCi,2015+ α5 Pre − funding growthi,2012 × GSVCi,2015+ εi,2015 (1)
where PercentageGrowthi,2015 is the percentage SME growth in size between 2012 and 2015, Pre-funding growthi,2012 is the average yearly growth rate of the size variables between 2010 and 2012, Ln(Size)i,2012 is the natural logarithm of the SME size in 2012 (the logarithmic transformation was used to reduce the impact of outliers on the regression), GSVCi,2015 is a dummy variable that indicates if the SME was funded by the Revitalizar VC funds, Pre-funding growthi,2012 GSVCi,2015 is an interaction variable between the pre-funding growth and the GSVC dummy and εi,t are the error terms. SME size is measured as the average number of
employees and the sales value. The interaction variable is included to understand whether among the GSVC funded SMEs the pre-funding growth rate helps predicting post-funding growth, since it seemed plausible that GSVC-backed firms behaved differently from the non-GSVC backed ones in the relation between growth rates from pre- and post-funding periods. Furthermore, considering the emphasis given by the existing literature on the influence of VC funding on high- and low-tech industries, the previous analysis was expanded to evaluate patterns across industries these two types of industries. In order to determine which industries could be considered high- and low- tech industries, the intangible assets to total assets ratio was used, on the premise that firms with a higher ratio are typically more technologic than those with lower ratios. The methodology used followed Lerner (1999) and was applied at an industry-level. It consisted on calculating the median intangible assets to total assets ratios for each industry, using a composite sample of GSVC and non-GSVC SMEs, and classifying each of them as high- or low-technology industries by evaluating if their median was above or below the overall median value. After this division was made, the previous regression framework was applied, only separating these two groups of firms, hoping to shed some light on the impact of the industry contexts on the performance outcomes.
5. Data and summary Statistics
The firm-level data was retrieved from the Central Balance Sheet Database, made available by
Banco de Portugal’s Microdata Research Laboratory. This database, provides economic and
financial information on non-financial organisations operating in Portugal, including a vast set of variables, which cover from general information on the firms to cash-flow data.
The main sample is composed by the 86 firms financed through the Revitalizar VC Funds on their first financing round, which began in 2013. As the analysis of the situation of these SMEs prior to the investment is fundamental in assessing the impact of the GSVC financing, the
period under analysis covers from 2010 to 2015. This time-frame enables the study of the three years of the undergoing investment cycle as well as the respective 3-year pre-investment period. Table 1 presents a broad industry distribution of the GSVC-backed and the control group SMEs in the sample according to the two-digit CAE – Rev.3 division level. Looking at the GSVC sample, the industry with the most VC-backed firms is Manufacturing, corresponding to 46.51% of the total SMEs evaluated. There is also a considerable weight on the services sectors (22.09%), such as in Accommodation, Food and beverage (11.63%). Finally, Wholesale and retail trade also represent a significant 12.79% of the sample. At large, this scenario contrasts with the one of VC investments, which target heavily enterprises in less traditional sectors. However, these results are consistent with the investment patterns characteristic of GVC funds, who are known to invest predominantly in more traditional sectors like manufacturing, construction and HORECA (Alperovych et al., 2015). In our sample, these three sectors represent a total of 59.3% of the total GSVC-backed firms.
Meanwhile, by comparing the latter with the industry distribution of the control sample, there seems to be an overrepresentation of the Manufacturing, Extractive and Information and communication industries in GSVC sample, with 46.51%, 2.33% and 9.30%, respectively, in comparison to their shares in the control group, 14.95%, 0.29% and 2.42%, respectively. Contrastingly, other areas of activity such as Wholesale and retail trade seem to be less favoured by the these investors, as they have less representation on the funded sample (12.79%) than on the control sample (34.29%).
An intuitive interpretation for the targeting of traditional industries may be that the government chose to invest in firms that typically are not so prone to receiving VC funding, in order to give them a better chance of growth. Alternatively, this structure could have also been a produce of the restrictions imposed in the eligibility criteria for the target SMEs of the Revitalizar VC
funds’, which established strict industry coverage limitations and seems to avoid industries
characterized by high levels of uncertainty.
Table 1: Summary statistics of Industry distribution of VC-backed firms
GSVC Control Group
No. firms % of total No. firms % of total Extractive industry (05-09) 2 2.33% 547 0.29% Manufacturing industry (10-33) 40 46.51% 27,964 14.96% Wholesale and retail trade (45-47) 11 12.79% 64,120 34.29% Accommodation, Food and beverage service
Activities (55-56) 10
11.63% 20,760 11.10% Information and communication activities (58-63) 8 9.30% 4,531 2.42% Professional, scientific and technical activities (69-75) 8 9.30% 21,043 11.25% Administrative and support activities (77-82) 2 2.33% 7,010 3.75%
Others 5 5.81% 41,011 21.93%
86 100% 186,986 100% Figures in parentheses are the 2-digit CAE (Classificação Portuguesa das Actividades
Económicas) Rev.3 division codes.
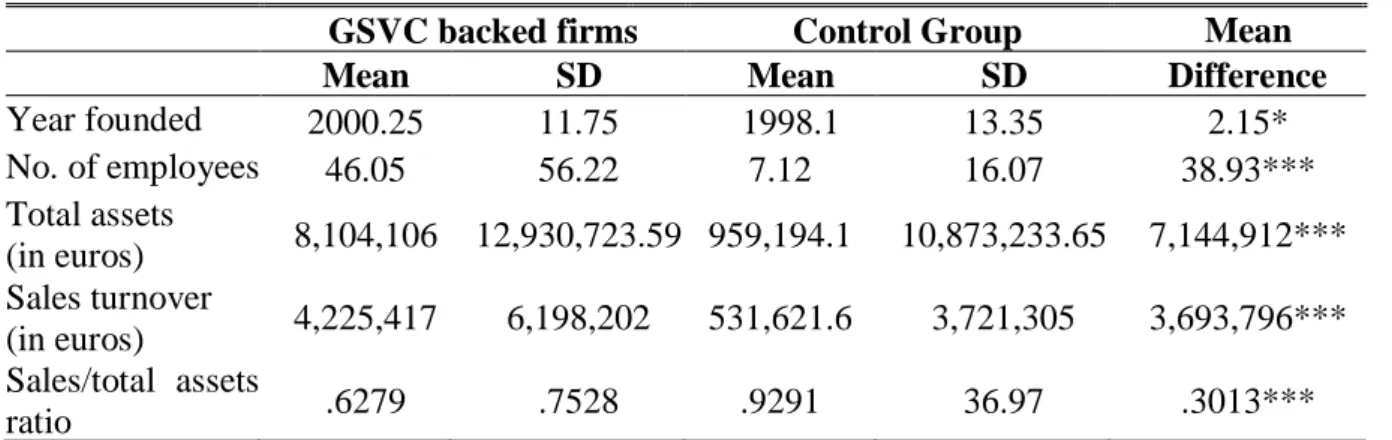
When analysing other differences between characteristics of the sample GSVC-backed firms under analysis and those of the control group in the pre-investments period, several interesting findings emerged. Table 2 presents summary statistics on the age, number of employees, total assets, sales turnover and sales to total assets of the two samples. Firstly, the average GSVC-backed SME had an average tenure of 13 to 15 years at the time of the funding (2013-2015), while the control firms were on average 2 years older. Although this difference is significant at a 10% level, there seems to be no striking pattern in the VCs choosing younger firms relative to the SME average. This result indicates that age might not have been a determinant criterion in the selection of the GSVC-recipients and is also surprising, considering that GSVC targets are typically young firms (Grilli et al., 2014). In turn, the scale of personnel of the GSVC-backed enterprises is consistent with literature. In 2013 the average number of employees working on these SMEs was approximately 46. Contrastingly, there were only roughly 7 employees working on the firms of the control group, which constitutes a significant difference between the two groups. When it comes to total assets, GSVC-backed firms had approximately 8.1M€ on average of assets while non-GSVC-backed firms present on average 0.96M€, which
presents a significance difference of over 7M€ between the two groups. GSVC-backed firms also display a significantly higher sales turnover, with an average of around 4.2M€, compared to an average of around 0.53M€ of non-GSVC-backed SMEs. Finally, the pre-funding efficiency of the GSVC-backed SMEs is lower than that of their non-GSVC-backed peers, measured by a significant 30.13% lower sales/total assets ratio.
Table 2: Summary statistics pre-investment
GSVC backed firms Control Group Mean
comparison
Mean SD Mean SD Difference
Year founded 2000.25 11.75 1998.1 13.35 2.15* No. of employees 46.05 56.22 7.12 16.07 38.93*** Total assets (in euros) 8,104,106 12,930,723.59 959,194.1 10,873,233.65 7,144,912*** Sales turnover (in euros) 4,225,417 6,198,202 531,621.6 3,721,305 3,693,796*** Sales/total assets ratio .6279 .7528 .9291 36.97 .3013***
Mean and standard deviation values calculated for the year of 2012, the year before the GSVC funds under analysis began their investment cycle. Total asset and sales turnover values are expressed in euros. The test statistics presented in the last column measure whether the means of the GSVC sample are significantly higher than those of the control group. *** Significant at the 1% level. ** Significant at the 5% level. * Significant at the 10% level.
From this analysis, GSCV-backed firms have proven to be significantly larger than their non-GSVC peers in terms of scale, measured by total assets and average annual number of employees, the most widely used measures of scale in the extant literature, and also less efficient, measured by the sales/total assets ratio. This apparent preference for larger SMEs, which are not necessarily more efficient, might be a reflection of public goals aiming to increase the welfare of SMEs in the economy, through, for instance, job creation at a larger scale. The difference in scale between the two groups hinders the value of a direct comparison between the variables under analysis, since the differences observed can be simply related to the fact that GSVC-backed SMEs are larger than non-VC-backed SMEs, and not necessarily superior performance-wise. Therefore, a relative comparison of the financial metrics is the preferred.
6.1. Descriptive analysis
Panel A of table 3 shows that the mean percentage sales growth from 2012 to 2015, the funding period, was not significantly different between the GSVC and the non-GSVC sample, presenting a p-value of 0.1061 for the hypothesis that this change was greater for the GSVC funded firms. Panel B displays the same analysis for employment, and it can be seen that for the mean GSVC-backed SME there was a 96.05% increase in employment, while for the average firm of the control group there was only a 12% increase. This difference in means is statistically significant at a 1% level (p-value is .0362), which implies a significantly larger employment growth for GSVC-backed SMEs. In order to make sure this significant mean difference was not caused by outliers a test of the equality of medians was also conducted, and it confirmed that the medians were significantly different.
Table 3: Growth of GSVC and non-GSVC SMEs (2012-2015) GSVC backed
firms
Control Group Mean comparison Panel A. % change in sales
Mean 75.9565 15.2257
SE 46.8378 10.9746
p-value .1061
No. of observations 50 109,221
Panel B. % change in employees
Mean .9605 .1200
SE .4579 .0337
p-value .0362***
No. of observations 57 186,892
The table summarizes the mean % changes in the sales and employment of the GSVC financed and the control of group SMEs between 2012 and 2015, and presents the results for the respective mean comparison tests: H0: diff = 0; H1: diff = mean (GSVC) – mean (control) > 0; All figures are in numeric values. ***Significant at the 1% level. **Significant at the 5% level. *Significant at the 10% level.
6.2. Regression analysis
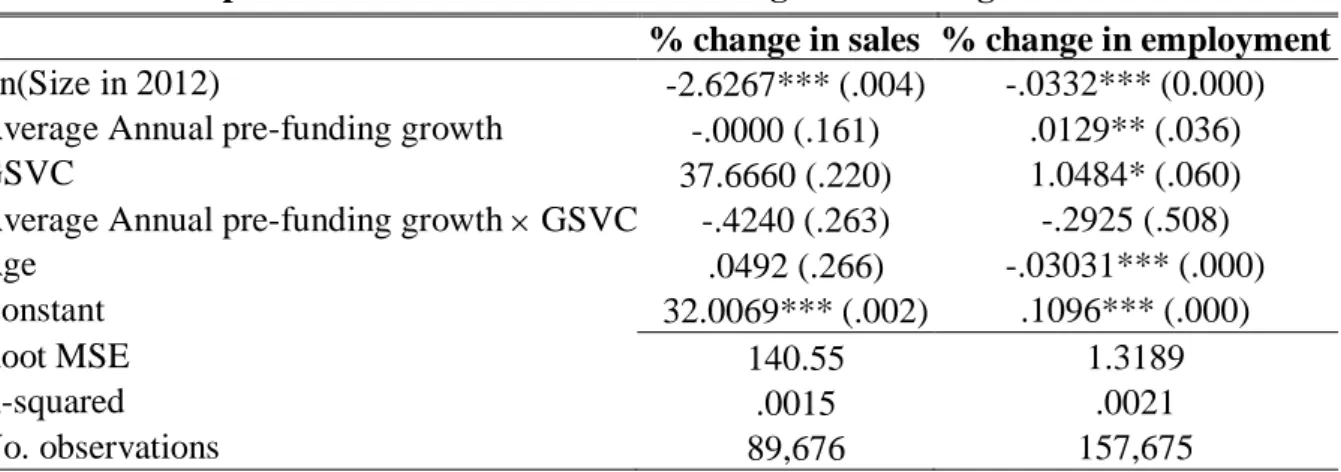
Table 4 examines the growth of sales and employment in an OLS regression framework as described previously in Section 4. The independent variables are percentage change in these variables, while the independent variables were the natural logarithms of their absolute values
interaction variable of the average annual pre-funding growth (2010-2012) for the GSVC-backed SMEs and the age of the firms at the moment the cycle of GSVC investments began. Unfortunately, it was not possible to analyse the efficiency of assets in a regression framework due to the existence of extreme outliers in the control group sample. Nevertheless, it is important to highlight that looking at the GSVC funded sample alone, there seems to be a reduction of efficiency after-GSVC-funding, reflected on a decrease in the sales/total assets ratio from .6279 in 2012, which as I’ve mentioned is significantly lower the equivalent measure of the control group in that same year, to .5221 in 2015. In that sense, it is important to highlight that (1) the GSVC selected SMEs which were less efficient than average and (2) the efficiency in assets, measured by the sales/total assets ratio, decreased throughout the funding period. For both the percentage change in sales and employment, the conclusions were in line with the previous mean difference tests, which indicated that there were only significant differences in the means of the GSVC and the control groups when it comes to employment. According to these regressions, the GSVC dummy was not significant for the percentage change in sales (p-value, of .220), but significant for the percentage change in employees (p-(p-value, of .060). These results show that the presence of GSVC financing had a positive relationship with employment growth performance, having a coefficient of around 1.05, but not with sales performance. Furthermore, there seems to be a significant positive relationship between the average annual pre-funding growth and the employment growth and a negative one between age and employment growth, which means that that older firms tend to present lower levels of employment growth, and pre-funding growth may have been a good predictor of performance measured by employment. However, the interaction variable is not significant for employment or sales, which indicates that for the GSVC funded SMEs in particular the pre-funding growth rate does not help predicting post-funding growth. These results are not fully aligned with previous studies, as the conclusions on employment growth are similar to Lerner’s (1999), but
results on sales growth are contrasting with those of this author and similar to those of Grilli et al. (2014). However, the results on efficiency seem to be consistent with those of Alperovych et al. (2015), who concluded that GVC seems to restrict efficiency of GVC-backed firms.
Table 4: The impact of GSVC investments on Portuguese SMEs’ growth
% change in sales % change in employment
Ln(Size in 2012) -2.6267*** (.004) -.0332*** (0.000)
Average Annual pre-funding growth -.0000 (.161) .0129** (.036)
GSVC 37.6660 (.220) 1.0484* (.060)
Average Annual pre-funding growth GSVC -.4240 (.263) -.2925 (.508)
Age .0492 (.266) -.03031*** (.000)
Constant 32.0069*** (.002) .1096*** (.000)
Root MSE 140.55 1.3189
R-squared .0015 .0021
No. observations 89,676 157,675
The table presents the outcomes of the regressions on the percentage change in sales and employment between 2012 and 2015. Due to the heteroscedasticity identified, the standard errors used were robust standard errors. The values in brackets correspond to the p-values associated with each coefficient. *** Significant at the 1% level. ** Significant at the 5% level. * Significant at the 10% level.
Additionally, I tried to identify whether there were particular industry patterns that could have a significant impact on the previous results. Table 5 are presents the results of the reestimated regressions. According to this analysis, it seems that there is no significant impact of GSVC funding on sales growth for high-tech SMEs in the post-funding period (GSVC dummy has a p-value of .238), and there is even a significant negative impact for low-tech SMEs (in this case, the GSVC dummy has a p-value of .036). Simultaneously, GSVC seems to have a significant correlation with higher percentage employee growth in both high- and low-tech industries. Nevertheless, the impact of GSVC seems to be higher for high-tech industries, measured by the coefficient of .979 compared of a coefficient of .4565 of low-tech firms. It is important to acknowledge that the goodness-of-fit of the regressions was unsatisfactory. These poor results are consistent with the those of Lerner (1999), and can be explained by the high level of idiosyncratic risk characteristic of small firms, whose success is often driven by firm-specific features that are difficult to control for in a large-sample study (Lerner, 1999).
Table 5: The impact of GSVC on SMEs’ growth by type of industry
Industry Intangible to Total Asset Ratio
Above median Below median
Panel A. % change in sales
Ln(Sales in 2012) -2.0664** (0.034) -8.2352*** (0.001)
Average Annual pre-funding growth -.0000 (0.221) -.0012* (0.057)
GSVC 36.0586 (0.238) -8.9685** (0.036) Age .0424 (0.341) .3292*** (0.005) Constant 25.1999** (0.026) 91.39*** (0.002) Root MSE 140.06 145.4 R-squared .0009 .0135 No. observations 82,388 7,288
Panel B. % change in employees
Ln(Employees in 2012) -.0267*** (0.000) -.0619*** (0.000) Average Annual pre-funding growth .0157** (0.024) -.0028 (0.843)
GSVC .979** (0.044) .4565*** (0.000) Age -.0033*** (0.000) -.003*** (0.000) Constant .1131*** (0.000) .1066*** (0.000) Root MSE 1.3569 1.1624 R-squared .0020 .0043 No. observations 124,702 32,973
The table presents the outcomes of the regressions on the % change in sales and employment between 2012 and 2015, considering a division into high and low intangible to total assets ratio. Due to the heteroscedasticity identified, the standard errors used were robust standard errors. The values in brackets correspond to the p-values associated with each coefficient. ***Significant at the 1% level. **Significant at the 5% level. *Significant at the 10% level. These results should be interpreted in the light of the purpose of the Revitalizar VC funds. According to their guidelines, VCs ought to concentrate in projects focused on expansion, innovation and/or modernization, which in most cases are not centred on short-term improvements but on medium-long term goals. The fact that GSVC financing seems to have no impact on high-tech industries and even hinder sales growth in low-tech industries (which constitute the majority of the SMEs financed) may indicate that through their GSVC financing, target firms are encouraged to focus on medium to long-term aspects rather than short-term sales. Additionally, on both types of firms, there seems to be significant positive link between GSVC financing and employee growth, which is more significant in high-tech industries. These results are in-line with the previous theory of the pursuance of medium to long-term strategic
increases in scale. However, the evidence found might in turn be a consequence of the source of the capital employed. Indeed, these GSVC investments were perhaps seen by the SMEs’ management as a sort of subsidy from the government (although it came at the expense of an equity stake), which might have reduced their incentives to increase efficiency within the firm and lead to the investment of the GSVC capital on less efficient activities, such as increasing scale without an underlying productivity increase goal in mind.
7. Concluding remarks
This study intends to offer an assessment on the performance Portuguese SMEs financed by of GSVC, focusing on the comparison of GSVC- vs. non-GSVC-backed firms in terms of employment, sales and asset efficiency measured by sales/total assets ratio. Altogether, the impact of the funds appears to be more related to employment rather than sales growth or efficiency. Indeed, I found evidence of a significantly superior SME performance at an employee growth level for GSVC-backed SMEs, accentuated in high-tech industries, and a negligible and negative performance of GSVC-backed SMEs measured by sales growth, for high- and low-tech industries, respectively. Moreover, GSVC financed firms also present reductions in their efficiency of assets during the funding period.
The results on efficiency are consistent with those of Alperovych et al. (2015) on Belgian SMEs, who used a composite measure of efficiency, the global efficiency score, and also found evidence of efficiency decreases GVC-backed firms. The results of the studies evaluating sales and employment growth seem to highly depend on the geography under analysis, and my findings on Portugal appear to be a mix of the ones in the existing literature. The results on employment growth are consistent with those of Lerner (1999) and go against those of Grilli et al. (2014), and the inverse happens with sales growth, as Lerner (1999) found a positive impact of GVC funding on SMEs in the US in both sales and employment growth and Grilli et al. (2014) found no positive impact of such growth measures in European SMEs.
The stronger relationship between financing by the Revitalizar VC funds and employment growth might be caused by the fact that the GSVC funds are more focused on employment compared to PVC funds. Indeed, it is likely that this result is caused by the funds’ governmental nature, and therefore, in the future, the policy makers for GSVC in Portugal could consider that these funds focus more of their more attention on the growth of sales and efficiency, in order to extend the performance benefits of GSVC-backed firms from employment growth to this other key performance measures.
Naturally, there are several limitations of this study, such as the inability of further restricting the control sample to capture more accurately the differences between GSVC and control samples, and the lack of data on the individual selection criteria used by the VCs to choose the target firms from their regional pool of applicants. It is possible that there may be a selection problem arising from the fact that the GSVC targeted enterprises are systematically different from the non-targeted ones when looking at a particular set of unobservable characteristics. If for instance, the managing VCs picked enterprises with superior growth projections a priori, conclusions regarding the benefit of GSVC financing can be deceptive.
Notwithstanding the aforementioned limitations, the results of this study are still valuable for several entities. Firstly, they provide unique first-hand evidence on the short-term results of GSVC programs that can help guide GSVC fund managers in their future investment decisions and to improve the performance of the VC sector in Portugal. Secondly, it would help entrepreneurs understanding the consequences of this particular type of financing when trying to determine the optimal source of capital according to their goals, in order to enjoy better chances of achieving successful outcomes. Furthermore, it can be seen as an insightful contribution for academic research, as it explores a geography that hasn’t been published on yet, and promises to be highly relevant in the current economic context. Finally, the Portuguese Government could also orient upcoming public endeavours that aim to promote SME
development, and also stir future policy making. Ultimately, the results from this research have a lot of potential to be successful in achieving very concrete and applicable outcomes.
There are many future research opportunities which can be conducted as a continuance of this study. Primarily, it is pertinent to analyse this exact matter is a few years, in order to continue to assess performance improvements over time. Methodology-wise, this analysis would preferably be based on a paired matching between GSVC-backed and non-GSVC-backed SMEs constructed on pre-funding measurements, which although not used in this study could provide additional interesting insights. Furthermore, as the Portuguese VC market evolves, it is worthy to evaluate the impact of the different types of VC, at a time where there are more VC-backed SMEs and different program structures.
References
Alperovych, Yan, and Georges Hübner. 2013. "Incremental Impact Of Venture Capital Financing". Small Business Economics 41 (3): 651-666. doi:10.1007/s11187-012-9448-6. Alperovych, Yan, Georges Hübner, and Fabrice Lobet. 2015. "How Does Governmental Versus Private Venture Capital Backing Affect A Firm's Efficiency? Evidence From Belgium". Journal Of Business Venturing 30 (4): 508-525. doi:10.1016/j.jbusvent.2014.11.001.
Amit, Raphael, James Brander, and Christoph Zott. 1998. "Why Do Venture Capital Firms Exist? Theory And Canadian Evidence". Journal Of Business Venturing 13 (6): 441-466. doi:10.1016/s0883-9026(97)00061-x.
Brander, James. A., Qianqian Du, and Thomas F. Hellmann. 2015. "The Effects Of Government-Sponsored Venture Capital: International Evidence". Review Of Finance 19 (2): 571-618. doi:10.1093/rof/rfu009.
Chemmanur, Thomas J., Karthik Krishnan, and Debarshi K. Nandy. 2011. "How Does Venture Capital Financing Improve Efficiency In Private Firms? A Look Beneath The Surface". Review
Of Financial Studies 24 (12): 4037-4090. doi:10.1093/rfs/hhr096.
Croce, Annalisa, José Martí, and Samuele Murtinu. 2013. "The Impact Of Venture Capital On The Productivity Growth Of European Entrepreneurial Firms: 'Screening' Or 'Value Added' Effect?". Journal Of Business Venturing 28 (4): 489-510. doi:10.1016/j.jbusvent.2012.06.001. Cumming, Douglas J., Luca Grilli, and Samuele Murtinu. 2017. "Governmental And Independent Venture Capital Investments In Europe: A Firm-Level Performance Analysis". Journal Of Corporate Finance 42: 439-459. doi:10.1016/j.jcorpfin.2014.10.016. Cumming, Douglas J., and Sofia A. Johan. 2013. Venture Capital And Private Equity
Contracting. 2nd ed. Elsevier Science Academic Press.
Da Rin, Marco, Thomas F. Hellmann, and Manju Puri. 2011. "A Survey Of Venture Capital Research". SSRN Electronic Journal. doi:10.2139/ssrn.1942821.
Davila, Antonio, George Foster, and Mahendra Gupta. 2003. "Venture Capital Financing And The Growth Of Startup Firms". Journal Of Business Venturing 18 (6): 689-708. doi:10.1016/s0883-9026(02)00127-1.
"FRS". 2017. Capital Criativo. http://www.capitalcriativo.com/pt/pagina/26/fundo-capital-criativo-ii/.
Gompers, Paul, and Josh Lerner. 2000. "Money Chasing Deals? The Impact Of Fund Inflows On Private Equity Valuation". Journal Of Financial Economics 55 (2): 281-325. doi:10.1016/s0304-405x(99)00052-5.
Gompers, Paul A, and Joshua Lerner. 2004. Venture Capital Cycle. Cambridge, Mass.: MIT. Grilli, Luca, and Samuele Murtinu. 2014. "Government, Venture Capital And The Growth Of European High-Tech Entrepreneurial Firms". Research Policy 43 (9): 1523-1543.
Knockaert, Mirjam, Andy Lockett, Bart Clarysse, and Mike Wright. 2006. "Do Human Capital And Fund Characteristics Drive Follow-Up Behaviour Of Early Stage High-Tech Vcs?". International Journal Of Technology Management 34 (1/2): 7-27. doi:10.1504/ijtm.2006.009445.
Knockaert, Mirjam, and Tom Vanacker. 2011. "The Association Between Venture Capitalists’ Selection And Value Adding Behavior: Evidence From Early Stage High Tech Venture Capitalists". Small Business Economics 40 (3): 493-509. doi:10.1007/s11187-011-9378-8. Kortum, Samuel, and Josh Lerner. 2000. "Assessing The Contribution Of Venture Capital To Innovation". The RAND Journal Of Economics 31 (4): 674–692. doi:10.2307/2696354.
Lerner, Josh. 1999. "The Government As Venture Capitalist: The Long‐Run Impact Of The SBIR Program". The Journal Of Business 72 (3): 285-318. doi:10.1086/209616.
Luukkonen, Terttu, Matthias Deschryvere, and Fabio Bertoni. 2013. "The Value Added By Government Venture Capital Funds Compared With Independent Venture Capital Funds". Technovation 33 (4-5): 154-162. doi:10.1016/j.technovation.2012.11.007.
"Novo Apoio Para As Empresas | Disponíveis 220 Milhões De Euros Para PME Nos Fundos Revitalizar". 2013. POFC COMPETE. http://www.pofc.qren.pt/media/noticias/entity/novo-apoio-para-as-empresas--disponiveis-220-milhoes-de-euros-para-pme-nos-fundos-revitalizar. Puri, Manju, and Rebecca Zarutskie. 2012. "On The Life Cycle Dynamics Of Venture-Capital- And Non-Venture-Capital-Financed Firms". The Journal Of Finance 67 (6): 2247-2293. doi:10.1111/j.1540-6261.2012.01786.x.
Samila, Sampsa, and Olav Sorenson. 2011. "Venture Capital, Entrepreneurship, And Regional Economic Growth". Review Of Economics And Statistics 93 (1): 338-349. doi:10.1162/REST_a_00066.
Appendix 1
Content: The following appendix contains the original document with the guidelines for the
Revitalizar Venture Capital Funds, sourced from the POFC QREN official website, which was
on the basis of this paper. I hereby apologise for the usage of the Portuguese language. However, an attempt to translate the complete transcript to the English language could lead to deceptive interpretations of the original rulings.
Reference: “FUNDOS DE CAPITAL DE RISCO REVITALIZAR - EMPRESAS
BENEFICIÁRIAS E OPERAÇÕES ELEGÍVEIS”. 2013. Pdf.
http://www.pofc.qren.pt/ResourcesUser/2013/Noticias/Condicoes_empresas_e_operacoes_F CR_Revitalizar.pdf.
FUNDOS DE CAPITAL DE RISCO REVITALIZAR
EMPRESAS BENEFICIÁRIAS E OPERAÇÕES ELEGÍVEIS
EMPRESAS BENEFICIÁRIAS
1. São entidades beneficiárias (empresas destinatárias), as sociedades comerciais, de qualquer tipo (sem prejuízo de o Fundo não poder assumir a qualidade de sócio com responsabilidade ilimitada), que possam usufruir do investimento por parte dos Fundos Revitalizar no quadro do seu Regulamento de Gestão e demais legislação e regulamentação aplicável.
2. As empresas destinatárias devem observar, cumulativamente, as seguintes condições:
(a) Localizarem-se e desenvolverem a atividade em território nacional do Continente de acordo com as regras de elegibilidade territorial dos PO financiadores do QREN;
(b) Serem PME, condição a confirmar pela Certificação Eletrónica, emitida de acordo com o determinado pelo Decreto-Lei n.º 372/2007, de 6 de novembro, conforme alterado pelo Decreto-Lei n.º 143/2009, de 16 de junho;
(c) Desenvolverem a sua atividade num dos seguintes setores de acordo com a Classificação Portuguesa das Atividades Económicas (CAE), revista pelo Decreto-Lei n.º 381/2007, de 14 de novembro:
(i) Indústria — atividades incluídas nas divisões 05 a 33 da CAE; (ii) Energia — atividades incluídas na divisão 35 da CAE;
(iii) Construção – atividades incluídas nas divisões 41 a 43 da CAE; (iv) Comércio — atividades incluídas nas divisões 45 a 47 da CAE;
563, 771 e 791 e nas subclasses 77210, 90040, 91041, 91042, 93110, 93192, 93210, 93292, 93293, 93294 e 96040 da CAE, estas últimas desde que declaradas de interesse para o turismo nos termos da legislação aplicável;
(vi) Transportes e Logística – atividades incluídas nos grupos 493, 494 e divisão 52 da CAE;
(vii) Serviços – atividades incluídas nas divisões 37 a 39, 58, 59, 62, 63, 69, 70 a 74, 77, com exclusão do grupo 771 e da subclasse 77210 quando declarada de interesse para o turismo nos termos da legislação aplicável, 78, 80 a 82, 90, com exclusão da subclasse 90040, 91, com exclusão das subclasses 91041 e 91042, 95, nos grupos 016, 022, 024 e 799 e na subclasse 64202.
3. Excluem-se do âmbito de aplicação do Fundo as seguintes sociedades e investimentos, nomeadamente:
(a) As sociedades sujeitas a uma injunção de recuperação, ainda pendente, na sequência de uma decisão anterior da Comissão Europeia que declare o auxílio ilegal e incompatível com o mercado comum; (b) As sociedades em dificuldade, na aceção das orientações da União
Europeia relativas a auxílios de Estado de emergência e à reestruturação de sociedades em dificuldade, designadamente:
(i) tratando-se de uma sociedade de responsabilidade limitada, quando se encontrar perdida mais de metade do seu capital social e mais de um quarto desse capital tenha sido perdido nos doze meses anteriores; ou
(ii) tratando-se de uma sociedade em que pelo menos alguns sócios têm responsabilidade ilimitada relativamente às dívidas da sociedade, quando mais de 50% (cinquenta por cento) dos seus fundos próprios, tal como indicados na contabilidade da sociedade, tiver desaparecido e mais de 25% (vinte e cinco por cento) desses fundos tiver sido perdido nos últimos doze meses; ou
preencha as condições para ser objeto de um processo coletivo de insolvência.
As PME criadas há menos de três anos apenas poderão ser consideradas sociedades em dificuldade durante esse período ao abrigo da alínea (iii) acima (e não das alíneas anteriores). (c) Sociedades dos setores do carvão, siderúrgico, da construção naval e
das fibras sintéticas;
(d) Os investimentos diretamente orientados para o financiamento de atividades relacionadas com a exportação para países terceiros ou Estados-Membros, nomeadamente os apoios associados diretamente às quantidades exportadas, de criação e funcionamento de redes de distribuição, ou de outras despesas correntes ligadas às atividades de exportação;
(e) Os investimentos condicionados à utilização de produtos nacionais em detrimento de produtos importados.
As empresas destinatárias financiadas pelo Fundo ficarão sujeitas às condições de cumulação de auxílios consagradas no artigo 7.º do Regulamento Geral de Isenção por Categoria (RGIC), Regulamento (CE) n.º 800/2008, de 6 de agosto de 2008, nos termos do qual, se uma empresa destinatária receber capital através do investimento e solicitar subsequentemente, durante os primeiros três anos após o primeiro investimento de capital de risco, auxílios abrangidos pelo âmbito de aplicação do RGIC, os limites máximos de auxílio relevantes ou os montantes máximos elegíveis ao abrigo do RGIC serão reduzidos em 20% (vinte por cento). Esta redução não excederá o montante total de capital de risco recebido e não será aplicável aos auxílios estatais à investigação, desenvolvimento e inovação isentos ao abrigo do RGIC.
OPERAÇÕES ELEGÍVEIS
1. O Fundo tem como finalidade investir o seu património em participações em sociedades de Direito português, que cumulativamente:
(a) prossigam projetos de expansão, inovação e/ou modernização, promovidos por Pequenas e Médias Empresas (“PME”, na aceção da Recomendação n.º 2003/361/CE de 6 de maio, condição a confirmar por certificação da Agência para a Competitividade e Inovação, I.P., o
“IAPMEI”), e que estejam em conformidade com as exigências
previstas no enquadramento normativo do Fundo Europeu de Desenvolvimento Regional (FEDER), bem como projetos em fase de constituição e de arranque promovidos por PME; e
(b) sejam qualificáveis como empresas beneficiárias dos FCR Revitalizar.
2. Os projetos que se candidatem a ser participados pelos FCR deverão ser sustentados num dossier de investimentos apresentado pelos respetivos promotores (as PME, seus sócios ou novos investidores na sociedade), o qual será analisado pela Entidade Gestora e, sempre que seja aprovado pela Entidade Gestora, será apreciado pelo Comité Consultivo. As propostas de investimento poderão igualmente ser encaminhadas para a Entidade Gestora pelos bancos participantes nos FCR, bem como por entidades públicas que tenham por missão o apoio e dinamização do tecido empresarial, em especial de PME.
3. As decisões de investimento deverão ser tomadas com base em critérios de elevada diligência e competência profissional, baseando-se em planos de negócios economicamente viáveis para criação ou expansão de empresas preparados relativamente a cada entidade beneficiária, e em informações sobre as mesmas (nomeadamente respetivo produto e vendas), incluindo sempre um exercício e relatório de due diligence que poderá envolver, nomeadamente, aspetos de natureza económico-financeira, legal, e, se aplicável, tecnológica, relativamente às sociedades a analisar em termos de investimento do Fundo.
4. As operações de capital de risco, poderão ser concretizadas, entre outras formas, através:
(a) da aquisição, por subscrição, compra ou qualquer outra via, de instrumentos de capital ou quase capital;
(b) da concessão de crédito, nos termos do Decreto-Lei n.º 375/2007, de 8 de novembro;
5. O Fundo poderá levar a cabo investimentos em parceria com outros fundos de capital de risco e/ou com outros investidores, incluindo com participantes do Fundo.
6. O investimento do Fundo em cada sociedade deverá ainda observar as seguintes condições:
(a) não poderá, em cada sociedade, a injeção de meios financeiros, pelo Fundo e por quaisquer outros instrumentos de capital de risco que se encontrem ao abrigo do SAFPRI, ultrapassar o valor de €1.500.000 (um milhão e quinhentos mil euros) por sociedade, por cada período de doze meses;
(b) pelo menos 70% (setenta por cento) do investimento do Fundo na sociedade deverá ser realizado através de instrumentos representativos de capital social ou quase capital.
Por “quase capital” entende-se: instrumentos cujo rendimento para o titular (investidor/mutuante) se baseia predominantemente em variáveis relacionadas com a geração de resultados da sociedade visada, que não são garantidos no caso de insolvência dessa sociedade e/ou que podem ser convertíveis em participações sociais ordinárias, desde que os mesmos (i) sejam qualificados como Capital Próprio à luz do Sistema de Normalização Contabilística e/ou (ii) sejam considerados investimento em capital de risco à luz do Decreto-Lei n.º 375/2007, de 8 de novembro.
7. Limitações ao investimento:
(a) os FCR não realizarão investimentos que visem financiar operações de consolidação ou reestruturação financeira ou meras aquisições de
projetos de investimento de PME;
(b) o investimento em sociedades que já se encontrem em atividade poderá comportar a aquisição aos sócios dessa sociedade de participações sociais, de créditos ou de qualquer outro envolvimento financeiro, até 30% (trinta por cento) do valor do investimento total do Fundo, na condição de que os sócios vendedores sejam independentes da Entidade Gestora e dos participantes e tal aquisição seja indispensável à concretização do investimento;
(c) o investimento através de sociedades-veículo, por exemplo SGPS, apenas poderá ser realizado desde que cumulativamente: (i) o interesse económico e os direitos de participação e de voto do Fundo sejam na substância idênticos aos que se verificariam se o investimento fosse realizado diretamente na sociedade de destino (entidade beneficiária); (ii) os fundos transferidos para a sociedade-veículo sejam aplicados no investimento em sociedades de destino e em projetos de investimento que respeitem a política de investimento do Fundo consagrada neste Regulamento de Gestão; (iii) os fluxos financeiros entre as sociedades de destino do investimento, a sociedade-veículo e o Fundo sejam transparentes e devidamente documentados e justificados; e (iv) caso à data do potencial investimento do Fundo a sociedade-veículo apenas invista em entidades beneficiárias, a mesma assuma a obrigação de apenas investir nessas entidades durante o período de investimento do Fundo através da sociedade-veículo, ou caso à data do potencial investimento do Fundo a sociedade-veículo invista igualmente em sociedades não qualificadas como entidades beneficiárias, sejam contratualizados, mecanismos, de acordo com as melhores práticas de mercado, de forma a que os fluxos financeiros das sociedades de destino para a sociedade-veículo, sejam, na máxima medida legalmente admissível, segregados e transferidos, na sua quota parte, para o Fundo;
(d) sem prejuízo de deliberação em contrário da Assembleia de Participantes, o FCR não investirá em sociedades em que:
(i) os fundos necessários (no entender da Entidade Gestora) à atividade da sociedade em causa tenham sido retirados pelos respetivos sócios, durante os doze meses anteriores à
devolução de prestações acessórias, pagamento de suprimentos ou por qualquer outra forma); ou
(ii) exista algum tipo de compromisso, assumido ou renegociado nos doze meses anteriores à data prevista para o investimento, para, durante o prazo de investimento previsto, retirar fundos necessários (no entender da Entidade Gestora) à atividade da sociedade em causa pelos sócios (através de redução de capital, devolução de prestações acessórias, distribuição de dividendos, pagamento de suprimentos ou por qualquer outra forma);
(e) o Fundo apenas poderá investir em valores mobiliários admitidos à negociação em mercado regulamentado até 50% (cinquenta por cento) do seu ativo total; e
(f) o investimento numa mesma sociedade ou em sociedades que se encontrem em relação de domínio ou de grupo não pode, quando tenham decorrido mais de dois anos sobre a data desse investimento e até que faltem dois anos para a liquidação do Fundo, exceder 33 % (trinta e três por cento) do ativo do Fundo.
8. Política de Desinvestimento dos FCR:
(a) O desinvestimento deverá ser previsto, de forma clara e realista, em acordo com natureza de parassocial, ou outro documento que regule o investimento, a celebrar com os promotores e os restantes acionistas/sócios do investimento nas sociedades participadas e será efetuado através do reembolso de créditos e/ou da alienação em mercado, a fundos de investimento, instituições financeiras, promotores ou outros investidores.
(b) A Entidade Gestora deverá assegurar que o desinvestimento ocorre visando sempre a maximização da rentabilidade de cada operação e atendendo aos melhores interesses dos participantes.