i
THE IMPACT OF SMART HOME TECHNOLOGIES
ON WELL-BEING
Gonçalo da Fonseca Miranda
Dissertation presented as partial requirement for obtaining
the Master’s degree in Information Management
ii
NOVA Information Management School
Instituto Superior de Estatística e Gestão de Informação
Universidade Nova de LisboaThe impact of smart home technologies on well-being
by
Gonçalo da Fonseca Miranda
Dissertation presented as partial requirement for obtaining the Master’s degree in Information Management, with a specialization in knowledge management and business intelligence
Advisor / Co Advisor: Tiago André Gonçalves Félix de Oliveira, Ph.D.
iii
“Each of us has heaven and hell in him...” -Oscar Wilde
To my grandparents.
iv
ACKNOWLEDGEMENTS
A chapter is ending. An evidence of that achievement is this document. I can’t say it has been the most difficult thing I have done. Nonetheless it has been one of the most troublesome. It is a personal achievement that “We” completed. Many say this is a solo work. However, there are numerous ways someone can contribute. I may have written the text, but each of you is in every word.
To my grandparents, for all the love and joy. Without you, this project wouldn’t be possible. Without you I wouldn’t have “dreamed the dream”. Thank you for every opportunity you provided me and for helping me find light even in the darkest hours.
To my friends who kept me motivated through it all. To them who listened when I was about to give up. To them who understood the struggles of this project. To them who are with me cheering and cherishing my accomplishment and our victory in another success.
v
ABSTRACT
Most studies on technology innovation lack research on well-being, focusing mainly on innovation for wealth. Research has shown that smart home technologies will be one of EU’s top priorities and are expected to increase user’s quality of life. This study aims to understand how the adoption/use of smart home technologies can influence user’s well-being. To understand this phenomenon, we combined two prominent theories in IS studies: the expectation-confirmation theory (ECT) and the unified theory of acceptance of technology 2 (UTAUT2). This study is based on an online survey with a sample of 309 responses. Findings suggest that satisfaction moderates the relationship between user’s adoption of smart home technology and their well-being. Results indicate that the adoption of smart home technologies alone does not directly influence user’s well-being, being necessary to measure user’s smart home technologies satisfaction to understand this phenomenon.
KEYWORDS
vi
INDEX
1.
INTRODUCTION ... 1
2.
LITERATURE REVIEW ... 2
2.1.
SMART HOMES ... 2
2.2.
WELL-BEING ... 2
2.3.
EXPECTATION-CONFIRMATION THEORY ... 3
2.4.
UNIFIED THEORY OF ACCEPTANCE AND USE OF TECHNOLOGY 2 (UTAUT2) ... 4
3.
RESEARCH MODEL ... 5
4.
METHODS ... 10
4.1.
MEASUREMENT INSTRUMENTS ... 10
4.2.
DATA COLLECTION ... 10
5.
RESULTS ... 11
5.1.
MEASUREMENT MODEL ... 11
5.2.
STRUCTURAL MODEL ... 12
5.3.
MODERATING EFFECT ... 13
6.
DISCUSSION ... 14
6.1.
THEORETICAL IMPLICATIONS ... 14
6.2.
MANAGERIAL IMPLICATIONS ... 14
6.3.
LIMITATIONS AND FUTURE RESEARCH ... 15
7.
CONCLUSION ... 16
8.
Bibliography ... 17
vii
LIST OF FIGURES
Figure 2.1 – Well-being dimensions [adapted from Ryff & Singer(2008)] ... 3
Figure 3.1 – Theoretical Model ... 5
Figure 5.1 – Results ... 12
Figure 5.2 – Well-being moderation between satisfaction and behaviour intention ... 13
Figure 5.3 – Well-being moderation between satisfaction and use behaviour ... 13
viii
LIST OF TABLES
Table 1 - Sample's demographic data ... 10
Table 2 - Cronbach’s alpha (CA), composite reliability (CR) and square root of AVEs. ... 1
Table 3 - Loadings and cross-loadings for the measurement model ... 3
Table 4 - VIF Formative Measure Items ... 3
ix
LIST OF ABBREVIATIONS AND ACRONYMS
EU European unionSHT Smart home technologies
UTAUT Unified theory of acceptance and use of technology
ECT Expectation-confirmation theory
SWB Subjective well-being
OWB Objective well-being
IOT Internet of Things
HTMT Heterotrait-Monotrait
VIF Variance Inflation Factor
PLS Pooled Least Squares
1
1. INTRODUCTION
Smart homes are a top priority to EU’s priority action areas in its Strategic Energy Technology Plan (Wilson, Hargreaves, & Hauxwell-Baldwin, 2017), it is estimated that by 2022 exists a 22.1% household penetration worldwide, having a market value of 53 B$(U.S) (Statista, 2019). Smart homes can enhance life quality and promote independent living (Marikyan, Papagiannidis, & Alamanos, 2019). As so it is of major importance to understand the technological capabilities and impact on people’s lives.
Most of the studies done on smart homes have seen it from a technological perspective (Marikyan et al., 2019) meaning that the studies were focused on the electrical impacts (Wilson et al., 2017), management solutions (Perumal et al., 2013), IoT (Risteska Stojkoska & Trivodaliev, 2017), smart appliances adoption determinants (Kowalczuk, 2018). Additionally, a smart home is defined by the interconnectedness among devices that are able to acquire information from the environment and act accordingly (Gram-Hanssen & Darby, 2018; Marikyan et al., 2019), as so, when we mention smart homes we have to include technologies such as smart-speakers (Kowalczuk, 2018; Park et al., 2018) or other self-service technologies (Chen et al., 2009), even so, by broadening the scope of the technology, a gap clearly exists if we perceive technology as a promoter of well-being and satisfaction.
As stated, we can see that today’s research paradigm is focused on innovation for wealth. Hence, we imply that new technologies foster economic growth and competitiveness, resulting in an increase in individual’s well-being, however that’s not necessarily true (Castellacci & Tveito, 2018). Martin (2016) proposed 20 challenges for the future, being one of them “to shift the focus of our empirical work from innovation for wealth to innovation for well-being”. To help shift the focus of innovation studies, we enclose that gap by understanding the moderating effect of satisfaction on the different stages of smart home technologies’ adoption (intention, use and continuance) towards explaining well-being. This is utterly important, has it helps us understand the relationship between innovation, well-being and economic performance.
In the next section is present the background and theoretical foundations used on this research. In Section 3, we present the conceptual model and hypotheses. In section 4 and 5 we describe the methodology and model implications. In the sixth section we discuss the major findings and last section is our main conclusions.
2
2. LITERATURE REVIEW
2.1.
SMART
HOMES
“A smart home is an intelligent environment that is able to acquire and apply knowledge about its inhabitants and their surroundings to adapt and meet the goals of comfort and efficiency” (Perumal et al., 2013, p.15). Smart homes are residences with smart appliances that can be remotely monitored and controlled and are interacting elements of an energy system (Gram-Hanssen & Darby, 2018). “[A smart home is] a residence equipped with a communications network, linking sensors, domestic appliances, and devices, that can be remotely monitored, accessed or controlled and which provides services that respond to the needs of its inhabitants”(Balta-Ozkan, Boteler, & Amerighi, 2014, p. 66). To the extension of this paper, we will use the definition proposed by Perumal et al. (2013) due to the broader concept of smart home. To our knowledge from 2002 to 2017, there were a total of 44 papers mentioning smart home technologies, and 36 articles related to smart technologies (Marikyan et al., 2019). In depth, more recent studies have focused on smart speakers (Kowalczuk, 2018; Park et al., 2018), the interconnection with IoT (Risteska Stojkoska & Trivodaliev, 2017), and smart grids (Wilson et al., 2017).
2.2.
WELL-BEING
Well-being is a broad concept and can be rather difficult to define. Diener (2009) describes well-being as a self-evaluation of life by measuring the pleasant affects and unpleasant affects. Furthermore, according to Ryan & Deci (2001) is the “optimal psychological functioning and experience”. Therefore, both authors describe the phenomena as a measure of satisfaction correlated with both extrinsic and intrinsic factors in the individual life present on social environments. Respecting psychological well-being we can find two major philosophical currents: hedonism (Kahneman, Diener, & Schwarz, 1999) and eudemonism (Waterman, 1993). Hedonism believes that well-being consists of pleasure and happiness, it is also defined as subjective well-being (SWB) (Castellacci & Tveito, 2018). On the other hand eudemonism, rooted in Aristotle’s ethics, believes that well-being consists on the “actualization of the human potentials” and how individuals can realize their own inner potential, defining it as objective well-being (OWB) (Castellacci & Tveito, 2018; Ryan & Deci, 2001).
Ryan and Deci (2000) proposed the self-determination theory which allows to account for the causes of human behavior, allowing a deeper comprehension on the “design of social environments that
optimize people’s development, performance, and well-being” (Ryan & Deci, 2000, p. 68). This theory
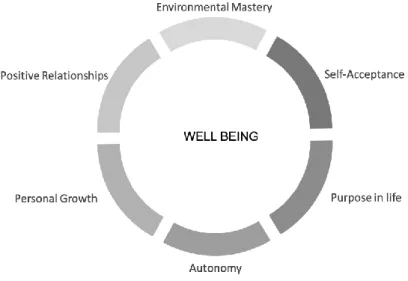
suggests that individuals have three basic needs (autonomy, competence and relatedness) to stimulate psychological growth, integrity, vitality and well-being (Castellacci & Tveito, 2018). Therefore, this theory excludes the social, cultural and contextual factors that characterize the different domains of life as posited by SWB (Castellacci & Tveito, 2018). Additionally, Ryff & Singer (2008) described well-being as a product of six interconnected dimensions: self-acceptance, purpose in life, autonomy, personal growth, positive relationships and environmental mastery (please, see Figure 2.1). Meaning that well-being depends on the individuals’ attitude and abilities to cultivate these characteristics (Castellacci & Tveito, 2018). Therefore, well-being is a measure of awareness and self-accomplishment with ones’ life.
3 Furthermore, this study is concerned about the psychological welfare induced on individuals through the use of technology. Nonetheless, instead of pursuing happiness and pleasure as proxy to well-being – that is dependent of social, cultural and contextual factors – , we are concerned about their psychological growth and development and how technology affects their potential, therefore we will measure well-being using the scale proposed by Ryff & Singer (2008). Purpose in life and personal growth have not been included in this study due to their overlapping dimension with other constructs.
2.3. EXPECTATION-CONFIRMATION
THEORY
The expectation-confirmation/disconfirmation theory poses a paradigm in which the individual’s expectation largely determines the satisfaction with a given subject (person, product, service, etc.) (Lowry, Gaskin, & Moody, 2015). This model was first introduced by Oliver (1980) and used many times in literature to explain IT continuance use in different technologies such as wearable health information systems (Shen, Li, & Sun, 2018), mobile apps (Tam, Santos, & Oliveira, 2018), smart watches, (Nascimento, Oliveira, & Tam, 2018), etc. The ECT involves four major constructs: satisfaction, confirmation, performance and expectation. Hence, it accounts for two moments of observation, the pre-consumption (t1) and the post-consumption(t2). In this model, however, we have adapted the model proposed by Bhattacherjee (2001) that accounts only for the post-consumption, meaning that the effects of the pre-consumption are contained within the satisfaction and confirmation constructs. Furthermore, by measuring satisfaction and the perceived benefits of the technology use the theory suggests that satisfaction is an predecessor of well-being (Ryan & Deci, 2001).
Figure 2.1 – Well-being dimensions [adapted from Ryff & Singer(2008)]
4
2.4. UNIFIED
THEORY
OF
ACCEPTANCE
AND
USE
OF
TECHNOLOGY
2
(UTAUT2)
The Unified theory of acceptance and use of technology 2 (UTAUT 2) (Venkatesh, Thong, & Xu, 2012) is an expansion of the UTAUT (Venkatesh, Morris, Davis, & Davis, 2003). This first theory version was developed to assess employee’s technology use and acceptance that combined 8 prominent theories used to explain use and behavioral intention to use a technology, being supported by four main constructs: social influence, facilitating conditions, performance expectancy and effort expectancy (Venkatesh et al., 2003). Moreover, UTAUT 2 was tailored to explain consumer’s use context, broadening the scope of the original model (UTAUT), with the addition of habit, hedonic motivation, and price value as constructs (Venkatesh et al., 2012).
5
3. RESEARCH MODEL
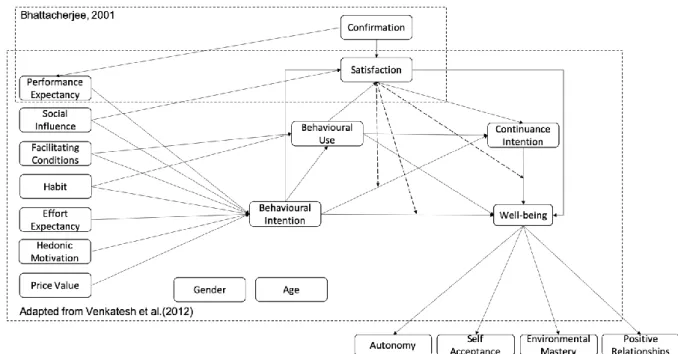
Being a set of technologies that adapt to individual’s needs (Perumal et al., 2013), smart home technologies convey the ability to automate our daily activities, affecting one’s well-being by stimulating the dimensions proposed by Ryff & Singer (2008) through their use. Therefore, we used UTAUT2 to comprehend the factors that explain consumer’s use context. Moreover, well-being literature describes this phenomenon as a measure of satisfaction, correlated with other factors that exist on individual’s life. For this purpose, we elected ECT to help determine how smart home technologies satisfaction impacts well-being. Accordingly, we theorized a model by combining the UTAUT2 and ECT in which we can measure all IS adoption stages (intention, use and continuance) and IT satisfaction to understand the complex phenomena that is well-being, regarding the OWB theory, as shown in Figure 3.1. The innovation of this study resides in the paradigm change proposed by Martin (2016).
6
Confirmation (CONF)
Confirmation results from the previously conceived expectations (Bhattacherjee, 2001) and its positively related with satisfaction and the perceived performance of the technology, as also observed during the study of continuance use of mobile apps Ding (2019), and smart watches (Nascimento et al., 2018). Confirmation occurs when perceived expected pre-consumption expectancies are met during the post-consumption stage. When expectancy is not met, consumers are likely to adjust their usefulness perceptions to match reality (Bhattacherjee, 2001). Hence, when expectancy is met and confirmation occurs, we are likely to have an increased usability perception and satisfaction. Smart home technologies are very susceptible to expectancy as they are likely to adapt to our needs. Therefore, research led us to propose the following hypotheses:
▪ H1: Confirmation positively affects satisfaction
▪ H2: Confirmation positively affects perceived expectancy
Satisfaction (SAT)
According to Bhattacherjee (2001) satisfaction is the result of the disconfirmed expectation about the consumption experience. Consequentially, resulting as the summary of the experience, a positive disconfirmation leads to a state of “wellness” (Ryan & Deci, 2001), therefore satisfaction can be perceived as a well-being antecedent. Moreover, being a result of user’s expectancy, it directly influences the user’s continuance intention to use a technology. Thus, the following hypotheses are formulated:
▪ H3: Well-being is positively affected by satisfaction
▪ H4: Satisfaction positively influences Continuance Intention ▪ H5a: Satisfaction moderates the relationship between BI and WB ▪ H5b: Satisfaction moderates the relationship between USE and WB ▪ H5c: Satisfaction moderates the relationship between CI and WB
Perceived expectancy (PE)
Perceived expectancy or perceived usefulness can be understood as the performance expectation that the individual will acquire from the technological use (Davis, 1989; Goodhue & Thompson, 1995). Research has proven a positive and hedonic motivation impact within the perceived usefulness, as seen in different studies such has the continuance use of smartwatches (Nascimento et al., 2018)or the consumer’s acceptance of smart speakers (Kowalczuk, 2018). An increase in usability/usefulness users may find in smart home technologies suggests a bigger set of benefits. Therefore, with an increased set of benefits we are likely to have higher levels of satisfaction which can increase their intention to use smart home technologies. As such, we hypothesize:
7
Social influence (SI)
Social influence “is the degree to which an individual considers important how others believe he or she should use a technology”(Chiu & Wang, 2008, p. 196). Research has shown that social influence affects the user’s desire to use technology and has a significant effect on continuance usage (Tam et al., 2018). Moreover, the concretization of the user’s desire to be in agreement with the “social expectancies”, can also have an effect in their satisfaction. Henceforth, we hypothesize:
▪ H7: SI negatively influences BI ▪ H8: SI positively affects SAT
Facilitating conditions (FC)
Facilitating conditions is the “degree to which an individual believes that organizational and technical infrastructure exist to support use of the IS” (Venkatesh et al., 2003). According to Tam et al. (2018) an individual whose perception of a favorable set of facilitating conditions is more likely to adopt a technology. Therefore, if users believe they can get support whenever they need, it is expected an increase in their intention to use. As so, we suggest:
▪ H9: FC positively influences BI ▪ H10: FC positively influences USE
Habit (HT)
Limayem, Hirt, & Cheung (2007) explains habit as the automation of behavioural action (IS use) due to learning, because repeating actions aids users to perform better. Meaning that, by repeating activities users become more comfortable performing those tasks (due to learning), which, ultimately results in repeating them (behaviour automation). Hence, by using smart home technologies more often, they are expected to perform better, promoting their intention to use and continue using. Consequently, we theorize:
▪ H11: Habit positively influences BI ▪ H12: Habit positively influences USE
Effort expectancy (EE)
Contrarily on perceived expectancy, perceived ease of use or effort expectancy is described as an extension to the user’s beliefs to determine the lack of effort needed to use the system (Davis, 1989). Thus, if the user’s perceive smart home technologies as “easy to use” then they are more likely to want to use them. This has been shown in the adoption of smart speakers (Kowalczuk, 2018) and smart home adoption studies (Shin et al., 2018). Hence, we posit:
8
Hedonic Motivation (HM)
Hedonic motivation is defined as the fun or pleasure derived from using a technology, and it has been shown to play an important role in determining technology acceptance and use (Venkatesh et al., 2012). Adapted to our study, increasing the pleasure that smart home technologies provide, users will likely be continuing using them and enjoying them, theorizing the following hypothesis:
▪ H14: Hedonic Motivation positively influences BI
Price Value (PV)
Price value is defined as the tradeoff between the financial cost and the benefit of using the
technology (Venkatesh et al., 2012). Hence, if the benefits of using smart home technologies are high then the users will be more eager to use them. Nevertheless, this is only true if they believe the financial costs are adequate to the benefits they offer. Thus, we postulate:
▪ H15: PV negatively influences BI
Behavioral intention (BI)
Followed by the underlying theories of intention models it is expected that behavioral intention posits a positive influence over technological use (Venkatesh et al., 2003). It is the likelihood of engaging in some behavior. Therefore, a higher intention to use smart home technologies will promote user’s use and continuance. Furthermore, it is expected that a higher intention leads to an increase in user’s perceived expectancy and possible growth, leading to a positive relationship with satisfaction and well-being. Therefore, we posit:
▪ H16: BI positively influences CI
▪ H17: BI positively influences well-being ▪ H18: BI positively influences USE ▪ H19: BI positively influences SAT
Behavioral use (BU)
Similar to the innovation diffusion theory (Rogers, 2010) in its 5 stage adoption decision process, there is a confirmatory phase where users reevaluate their decisions confirming/disconfirming their beliefs, in moments of pre/post consumption , as discussed by Bhattacherjee (2001). Consequentially, this appraisal poses that continuance use co-varies with technological acceptance, but also the satisfaction of the individual towards technology. Moreover, the use of smart home technologies spurs the user’s psychological development (Ryff & Singer, 2008) by meeting to one’s needs.
▪ H20: BU Positively influences CI ▪ H21: BU Positively influences SAT ▪ H22: BU positively influences well-being
9
Continuance intention (CI)
Continuance intention is a post-acceptance stage when IS use becomes part of our normal routine activity (Bhattacherjee, 2001). This continuance intention is a consequence of the user’s beliefs confirmation of the technology use. Therefore, by meeting/confirming the user’s expectancy, smart home technologies are fulfilling user’s needs and therefore inducing their psychological growth, as proposed by Ryff & Singer (2008). Hence, we theorize:
▪ H23: CI positively influences well-being
Well-being (WB)
According to Diener (2009) PWB is achieved by measuring life satisfaction, frequent pleasant emotion and infrequent unpleasant emotions. Moreover, by grasping well-being as a complex phenomenon (Ryan & Deci, 2001) that is achieved by the state of eudaimonia (Lowry et al., 2015). Consequentially, eudaimonia (Kahneman et al., 1999) is achieved by the realization of ones’ inner potential. Hence, we propose the following hypotheses accordingly to (Ryff & Singer, 2008).
▪ H24a: Well-being is positively affected by Autonomy ▪ H24b: Well-being is positively affected by Self-Acceptance ▪ H24c: Well-being is positively affected by Environmental Mastery ▪ H24d: Well-being is positively affected by Positive Relationships
10
4. METHODS
4.1. MEASUREMENT
INSTRUMENTS
The measurement items were adapted from literature. The items for CONF were adapted from Nascimento et al. (2018), Samar et all (2019) and Huang (2019); BI, USE, PE, EE, SI FC, HM, PV and HT where adapted from Venkatesh et al. (2012); The items for AUT, EM, PG, PR, PL and SA where adapted from Ryff et al. (2008); SAT was adapted from Nascimento et al. (2018). All measurement items used can be found in Appendix. The questionnaire was developed in English and hosted on a free platform. All items with exception of the ones respecting well-being (Ryff & Singer, 2008) were measured using a seven-point Likert scale, ranging from “Strongly Disagree” (1) to “Strongly Agree” (7).
4.2.
DATA
COLLECTION
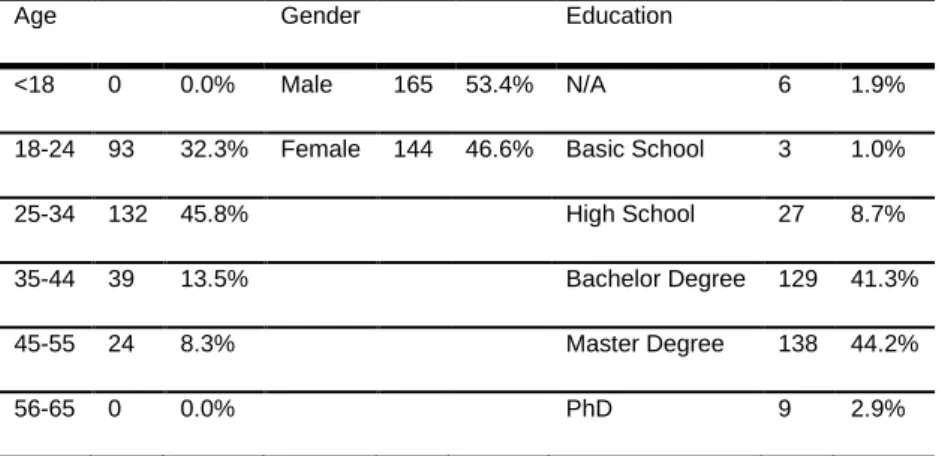
A pilot survey was conducted to polish questions and retrieve comments over the content and structure of the questionnaire. There were no changes to the items and pilot survey data was used in the main survey. The main survey was hosted on a free platform and was conducted online. Concerning demographic data 88.5% of the respondents had a higher level of education and average age of 28 years. More than half of our sample has a higher level of education as seen in Table 1.
Age Gender Education
<18 0 0.0% Male 165 53.4% N/A 6 1.9%
18-24 93 32.3% Female 144 46.6% Basic School 3 1.0%
25-34 132 45.8% High School 27 8.7%
35-44 39 13.5% Bachelor Degree 129 41.3%
45-55 24 8.3% Master Degree 138 44.2%
56-65 0 0.0% PhD 9 2.9%
11
5. RESULTS
Structural equation modelling (SEM) is a statistical method for testing and estimating causal relationships using a combination of statistical data and qualitative causal assumptions. Because some of our items were not normally distributed (p < 0.01 using the Kolmogorov-Smirnov test), our model was estimated using the partial least squares (PLS), this research model has not been yet tested in the literature and is regarded as complex. Smart PLS v.3.2.8 was used to analyse the relationships defined in the theoretical model(Ringle, Wende, & Becker, 2015).
5.1. MEASUREMENT
MODEL
To access the measurement validity and reliability we must ensure construct reliability, indicator reliability, convergent validity and discriminant Validity. Construct reliability was achieved by the observation of the composite reliability (CR) and Cronbach’s alpha (CA). According to literature, these values should be greater than 0.7, nonetheless, for exploratory purposes a range between [0.6 ; 0.7] is considered acceptable. In a preliminary assessment of the model, personal growth and purpose in life didn’t meet these criteria and were removed. Therefore, after a re-estimation of the model, as shown in Table 2 (Appendix), all constructs meet these criteria. Indicator reliability was tested recurring to a criterion in which the outer loadings should be greater than 0.7 and that every loading smaller than 0.4 should be removed. However, to constructs between [0.4,0.7[ should be removed if their deletion poses an increase of the average variance explained (AVE) or CR. Hence AUT1, EM1, PL2, PR2 and HT3 were removed. To assess the convergent validity of the constructs, following the literature we posed the AVE should be greater than 0.5.
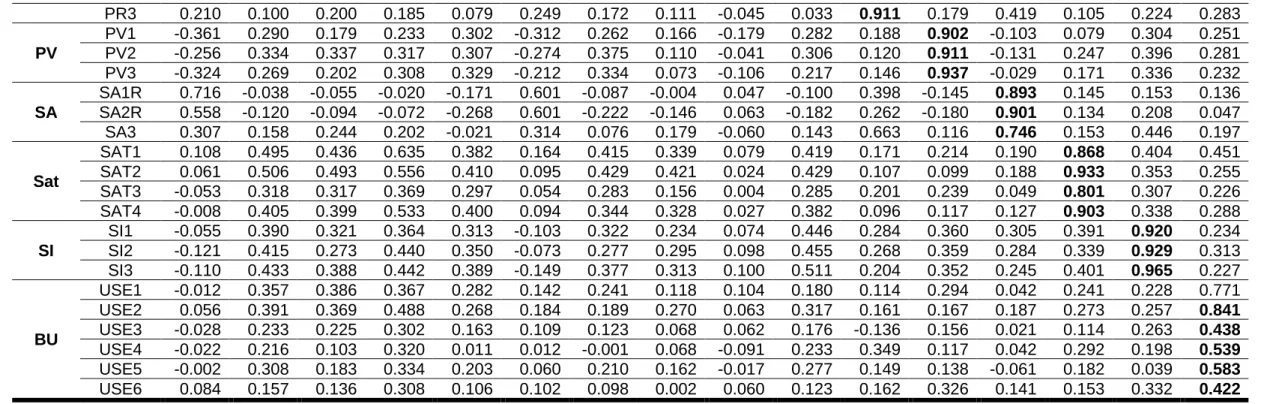
After all the previous validation criteria were met, discriminant validity was assessed using the cross loadings and the Fornell-Larcker criteria. The first criterion poses that all the loadings of each indicator should be greater than all cross-loadings, which can be observed in Table 3 (Appendix). The
Fornell-Larcker criterion stances that the square-root of the AVE should be greater than the correlation
between the construct, as seen in Table 2 (Appendix). Consequently, both criteria are met. Furthermore, to confirm discriminant validity we also assessed the HTMT method, which has proven better results than the previous ones (Ringle et al., 2015). This test poses that the observed value should be lesser than 0.9, to indicate discriminant validity. The criteria were met for the HTMT test, confirming the results from the previous test.
All the reflective measurement items were validated. Moreover, this model includes formative measurement items, USE1 to USE6. To validate these measures validity and reliability we should evaluate the collinearity of the indicators, their relative importance and absolute importance. Since the construct is explained 100% by the indicator’s we used the bootstrapping method to understand the indicator’s relative contribution. As seen in Table 4 (Appendix) the indicators all have a VIF < 5 meaning there are no collinearity issues with the items. On the other hand, after applying a bootstrapping method of 5000 iterations (Hair, 2014), and analysing the outer weights and loadings, of the items, all were statistically significant, and therefore significance and relevance were verified.
12
5.2. STRUCTURAL
MODEL
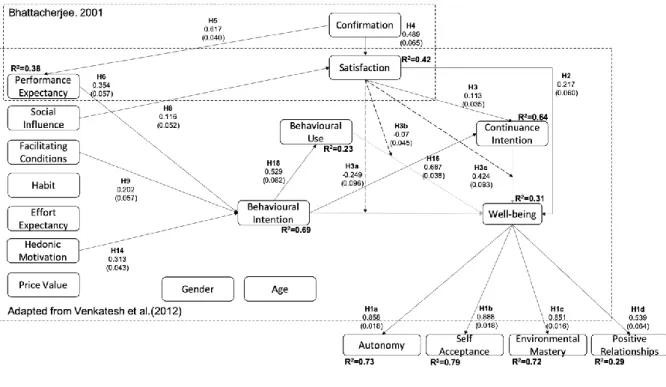
The structural model was estimated using R2 measures and path coefficients’ level of significance. Figure 5.1 shows the model results. The R2 of dependent variables are 0.39, 0.42, 0.69, 0.64,0.23 and 0.31 for performance expectancy, satisfaction, behavioural intention, continuance intention, behavioural use and well-being respectively. The significance was assessed based on similar criterion used for formative measurement instruments using a bootstrapping procedure (Hair, 2014), with 5000 resamples.
Figure 5.1 – Results
The model explains 38.5% of the variation in performance expectancy and all variables are statistically significant. Confirmation (̂ = 0.62; p < 0.01). Respectively H5 is confirmed.
The model explains 41.5% of satisfaction. Confirmation (̂ = 0.55; p < 0.01) and social influence (̂ = 0.12; p < 0.01) are statistically significant. Thus, H1 and H8 are confirmed.
The model explains 69.1% of the variance in behavioural intention. Hedonic motivation (̂= 0.31; p < 0.01), performance expectancy (̂ = 0.35; p < 0.01) and facilitating conditions (̂ = 0.19; p < 0.01) are statistically significant therefore, H6, H9 and H14 are confirmed.
The model explains 64% of the variance in continuance intention. Behavioural intention (̂ = 0.71; p < 0.01) and satisfaction (̂ = 0.11; p < 0.01) are statistically significant. As so, H4 and H16 are confirmed. The model explains 23.2% of the variance in behavioural use. Behavioural intention (̂ = 0.54; p < 0.01) is statistically significant. Henceforth H18 is confirmed
13 The model explains 31.4% of the variance in well-being. From all the hypothesis only satisfaction (̂ = 0.22; p < 0.01) is statistically significant. Thus, H3 is confirmed.
The modelling paths between well-being and the proposed dimensions are all statistically significant. Autonomy (̂ = 0.84; p < 0.01), environmental mastery (̂ = 0,86; p < 0,01), positive relationships (̂ = 0.73; p < 0.01) , self-acceptance (̂ = 0.89; p < 0.01). Therefore, H24a to H24d are confirmed.
5.3. MODERATING
EFFECT
Moderation occurs when a variable alters a relationship between two constructs. Therefore, to measure it we applied the PLS product-indicator approach (Chin, Marcolin, & Newsted, 2003) to evaluate satisfaction as a moderator of behavioural Intention, use behaviour and continuance-intention on well-being, as shown below in the Figures 5.2, 5.3 and 5.4, respectively.
Figure 5.2 shows that the relationship between well-being and behaviour intention is weaker on individuals with high satisfaction levels rather than individuals with low satisfaction levels. Figure 5.3 illustrates that the relationship between well-being and use behaviour is weaker on individuals with high satisfaction levels than for people with low satisfaction levels. Figure 5.4 indicates that the relationship between well-being and continuance use is stronger on individuals with high satisfaction rather than low satisfaction. Therefore, well-being encouraged by technology adoption/use is not a direct proxy, meaning they are influenced other proxies such as satisfaction.
Figure 5.2 – Well-being moderation between satisfaction and behaviour intention
Figure 5.3 – Well-being moderation between satisfaction and use behaviour
Figure 5.4 – Well-being moderation between satisfaction and continuance intention
14
6. DISCUSSION
6.1. THEORETICAL
IMPLICATIONS
The theoretical framework proposed in this study aims to comprehend the effect of smart home technologies on well-being by understanding the consumer’s use context [by using UTAUT2 (Venkatesh et al., 2012)] and technology satisfaction [by using ECT (Bhattacherjee, 2001)]. Additionally, we proposed two new hypotheses. First, that behavioral intention (BI) has a positive impact on continuance intention (CI). Second, that behavioral use (BU) has a positive impact in CI. These new hypotheses increased the explanatory power of CI by 19 p.p. when compared with Bhattacherjee (2001) ECT model, as illustrated in Table 5 (Appendix). Hence, proposing this modification to the ECT ultimately leads to a better understanding of smart home technologies continuance intention. Moreover, the model we theorized proposed that the different adoption stages (intention, use and routinization) impact well-being, shifting the actual paradigm “innovation for wealth” to “innovation for well-being” (Martin, 2016). Nonetheless, the findings in this study suggest that the relationship between IS adoption stages and well-being is not direct, since this relationship is moderated by SAT. This is of major importance because, to our knowledge, no studies have understood how technology innovation can impact well-being. Therefore, this model gives us a starting point to continue research on “innovation for well-being”.
6.2. PRACTICAL
IMPLICATIONS
The findings of this study showed that the user’s continuance intention to use smart home technologies was the most important factor in explaining well-being, especially in users with high levels of satisfaction, as shown in Figure 5.4. This is a product of the user’s beliefs confirmation as defined by Bhattacherjee (2001). Consequently, satisfaction also plays an important role in respecting smart home technologies and well-being. Hence, given the purpose of this study regarding innovation for wellness, smart home technologies should aim to maximize the satisfaction of the individual’s use. For this to happen, smart home technologies should be able to meet user expectations, by confirming their beliefs. This occurs when companies “over-deliver” or “under-promise” their product, leading to higher levels of confirmation and also satisfaction (Limayem et al., 2007). Moreover, in smart home context, individuals expect their technologies to create an integrated environment that adapts to their needs (Perumal et al., 2013). Therefore, following the innovation paradigm proposed by Martin (2016), smart home technologies should evolve to fulfil these purposes, responding to user’s needs by being integrated and capable of acquiring knowledge from their surroundings.
15
6.3. LIMITATIONS
AND
FUTURE
RESEARCH
Despite the increase to the current knowledge, we understand the limitations of this study. The first is related to sampling, since the study was applied in Portugal. Hence, this study may not be generalizable. Another limitation of this study is related with the panoply of sub-technologies that smart home technologies include. This could affect user’s responses due to a lack of smart home technologies penetration in Portugal. Finally, this was an early attempt to measure well-being in IS studies, this proved difficult being such a subjective item. Therefore, the measuring items may need some adjustment.
We recommend increasing the geographical application of the questionnaire to disclose possible significant changes. Additionally, we propose in the next studies to measure other technologies impact on individual’s well-being and compare their possible differences. Other suggestions may be to extend this theory by adding new constructs/relationships that may help increase technological impact on well-being perception, and the possibility for some underlying relationships between variables as satisfaction with intention, use and continuance.
16
7. CONCLUSION
Most IS studies have been focused on innovation for wealth, studying IT acceptance or IT continuance, neglecting “innovation for wellness” as a paradigm. To our knowledge well-being hasn’t been studied in IS context. By addressing this gap, this study contributes by creating a framework to help us disclosure how technology can influence individual’s well-being, promoting a change in the existing paradigm.
This framework also contributes to the expansion of IT adoption and continuance theories, by combining the ECT with UTAUT2, broadening the applicability of these theories concerning smart home technologies. Our findings indicate that technology adoption/use does not directly affect individual’s well-being, being moderated by one’s satisfaction. Hence, the confirmation/disconfirmation of user’s expectancy have an important role in understanding the impact of smart home technology on individual’s well-being.
17
8. BIBLIOGRAPHY
Balta-Ozkan, N., Boteler, B., & Amerighi, O. (2014). European smart home market development: Public views on technical and economic aspects across the United Kingdom, Germany and Italy.
Energy Research & Social Science, 3, 65–77. https://doi.org/10.1016/j.erss.2014.07.007
Bhattacherjee, A. (2001). Understanding information systems continuance: An expectation-confirmation model. MIS Quarterly, 25(3), 351. https://doi.org/10.2307/3250921
Castellacci, F., & Tveito, V. (2018). Internet use and well-being: A survey and a theoretical framework.
Research Policy, 47(1), 308–325. https://doi.org/10.1016/j.respol.2017.11.007
Chen, S., Chen, H., & Chen, M. (2009). Determinants of satisfaction and continuance intention towards self‐service technologies. Industrial Management & Data Systems, 109(9), 1248–1263. https://doi.org/10.1108/02635570911002306
Chin, W. W., Marcolin, B. L., & Newsted, P. R. (2003). A partial least squares latent variable modeling approach for measuring interaction effects: Results from a monte carlo simulation study and an electronic-mail emotion/adoption study. Information Systems Research, 14(2), 189–217. https://doi.org/10.1287/isre.14.2.189.16018
Chiu, C.-M., & Wang, E. T. G. (2008). Understanding web-based learning continuance intention: The role of subjective task value. Information & Management, 45(3), 194–201.
https://doi.org/10.1016/j.im.2008.02.003
Davis, F. D. (1989). Perceived usefulness, perceived ease of use, and user acceptance of information technology. MIS Quarterly, 13(3), 319. https://doi.org/10.2307/249008
Diener, E. (Ed.). (2009). Culture and well-being. Dordrecht ; New York: Springer.
Ding, Y. (2019). Looking forward: The role of hope in information system continuance. Computers in
Human Behavior, 91, 127–137. https://doi.org/10.1016/j.chb.2018.09.002
Goodhue, D. L., & Thompson, R. L. (1995). Task-technology fit and individual performance. MIS
Quarterly, 19(2), 213. https://doi.org/10.2307/249689
Gram-Hanssen, K., & Darby, S. J. (2018). “Home is where the smart is”? Evaluating smart home research and approaches against the concept of home. Energy Research & Social Science, 37, 94–101. https://doi.org/10.1016/j.erss.2017.09.037
Hair, J. F. (Ed.). (2014). A primer on partial least squares structural equations modeling (PLS-SEM). Los Angeles: SAGE.
Kahneman, D., Diener, E., & Schwarz, N. (1999). Well-being: Foundations of hedonic psychology. Russell Sage Foundation.
Kowalczuk, P. (2018). Consumer acceptance of smart speakers: A mixed methods approach. 15. Limayem, Hirt, & Cheung. (2007). How habit limits the predictive power of intention: The case of information systems continuance. MIS Quarterly, 31(4), 705. https://doi.org/10.2307/25148817
18 Lowry, P., Gaskin, J., & Moody, G. (2015). Proposing the multimotive information systems
continuance model (misc) to better explain end-user system evaluations and continuance intentions.
Journal of the Association for Information Systems, 16(7), 515–579.
https://doi.org/10.17705/1jais.00403
Marikyan, D., Papagiannidis, S., & Alamanos, E. (2019). A systematic review of the smart home literature: A user perspective. Technological Forecasting and Social Change, 138, 139–154. https://doi.org/10.1016/j.techfore.2018.08.015
Martin, B. R. (2016). Twenty challenges for innovation studies. Science and Public Policy, 43(3), 432– 450. https://doi.org/10.1093/scipol/scv077
Nascimento, B., Oliveira, T., & Tam, C. (2018). Wearable technology: What explains continuance intention in smartwatches? Journal of Retailing and Consumer Services, 43, 157–169.
https://doi.org/10.1016/j.jretconser.2018.03.017
Oliver, R. L. (1980). A cognitive model of the antecedents and consequences of satisfaction decisions.
Journal of Marketing Research, 17(4), 460. https://doi.org/10.2307/3150499
Park, K., Kwak, C., Lee, J., & Ahn, J.-H. (2018). The effect of platform characteristics on the adoption of smart speakers: Empirical evidence in South Korea. Telematics and Informatics, 35(8), 2118–2132. https://doi.org/10.1016/j.tele.2018.07.013
Perumal, T., Sulaiman, N., Sharif, K. Y., Ramli, A. R., & Leong, C. Y. (2013). Development of an embedded smart home management scheme. International Journal of Smart Home, 7(2), 12. Ringle, C. M., Wende, S., & Becker, J.-M. (2015). SmartPLS 3. Retrieved from
http://www.smartpls.com
Risteska Stojkoska, B. L., & Trivodaliev, K. V. (2017). A review of internet of things for smart home: challenges and solutions. Journal of Cleaner Production, 140, 1454–1464.
https://doi.org/10.1016/j.jclepro.2016.10.006
Rogers, E. M. (2010). Diffusion of innovations. Simon and Schuster.
Ryan, R. M., & Deci, E. L. (2000). Self-determination theory and the facilitation of intrinsic motivation, social development, and well-being. American Psychologist, 11.
Ryan, R. M., & Deci, E. L. (2001). On happiness and human potentials: A review of research on hedonic and eudaimonic well-being. Annual Review of Psychology, 52(1), 141–166.
https://doi.org/10.1146/annurev.psych.52.1.141
Ryff, C. D., & Singer, B. H. (2008). Know thyself and become what you are: A eudaimonic approach to psychological well-being. Journal of Happiness Studies, 9(1), 13–39. https://doi.org/10.1007/s10902-006-9019-0
Shen, X.-L., Li, Y.-J., & Sun, Y. (2018). Wearable health information systems intermittent discontinuance: A revised expectation-disconfirmation model. Industrial Management & Data
19 Shin, J., Park, Y., & Lee, D. (2018). Who will be smart home users? An analysis of adoption and
diffusion of smart homes. Technological Forecasting and Social Change, 134, 246–253. https://doi.org/10.1016/j.techfore.2018.06.029
Statista. (2019). Statistics Portal: Smarthome. Retrieved 5 January 2019, from https://www.statista.com/outlook/279/100/smart-home/worldwide
Tam, C., Santos, D., & Oliveira, T. (2018). Exploring the influential factors of continuance intention to use mobile Apps: Extending the expectation confirmation model. Information Systems Frontiers. https://doi.org/10.1007/s10796-018-9864-5
Venkatesh, Morris, Davis, & Davis. (2003). User acceptance of information technology: Toward a unified View. MIS Quarterly, 27(3), 425. https://doi.org/10.2307/30036540
Venkatesh, Thong, & Xu. (2012). Consumer Acceptance and use of information technology: extending the unified theory of acceptance and use of technology. MIS Quarterly, 36(1), 157.
https://doi.org/10.2307/41410412
Waterman, A. S. (1993). Two conceptions of happiness: Contrasts of personal expressiveness (eudaimonia) and hedonic enjoyment. Journal of Personality and Social Psychology, 64(4), 678–691. https://doi.org/10.1037/0022-3514.64.4.678
Wilson, C., Hargreaves, T., & Hauxwell-Baldwin, R. (2017). Benefits and risks of smart home technologies. Energy Policy, 103, 72–83. https://doi.org/10.1016/j.enpol.2016.12.047
20
9. APPENDIX
Construct Operationalization
Construct Acronym Description Adapted from
Performance Expectancy
PE The extent to which a person believes that a system enhances his or her performance
Venkatesh et al. (2012) Expected Effort EE The extent to which a learner believes that
using a system is free of effort
Venkatesh et al. (2012) Social Influence SI Is the degree to which an individual
considers important how others believe he or she should use a technology
Venkatesh et al. (2012)
Facilitating Conditions
FC Is the degree to which an individual believes that organizational and technical infrastructure exist to support use of the IS
Venkatesh et al. (2012)
Hedonic Motivation HM Hedonic motivation is defined as the fun or pleasure derived from using a technology
Venkatesh et al. (2012)
Price Value PV Is the financial cost required to obtain and
use a product
Venkatesh et al. (2012)
Habit H Is the extent to which people tend to
perform behaviours (use IS) automatically because of learning
Venkatesh et al. (2012)
Confirmation CONF Cognitive appraisal of the
expectation-performance discrepancy
Bhattacherjee (2001)
Satisfaction SAT The summary psychological state
resulting when the emotion surrounding disconfirmed expectations is coupled with the consumer’s prior feelings about the consumption experience
Bhattacherjee (2001)
Well-being WB well-being is a measure of self-awareness
and self-accomplishment with ones’ life
Ryff et al. (2008) Self-acceptance SA Is the self-evaluation of awareness and
acceptance of ones’ strengths and weaknesses
Ryff et al. (2008)
Autonomy A Is defined as the autonomous functioning
and resistance to enculturation through a sense of freedom of the norms governing everyday life
Ryff et al. (2008)
Purpose in Life PL Having a clear comprehension of life’s purpose through a sense of directness and intentionality
Ryff et al. (2008)
Environmental Mastery
EM Is defined as the individual’s ability to choose or create environments suitable to his/her psychic conditions
Ryff et al. (2008)
Positive Relationships
PR The capacity for great love, deep friendship, and close identification with others
Ryff et al. (2008)
Personal Growth PG Is the self-realization of the individual through self-actualization
21
Construct Items:
Construct Item Adapted from
Confirmation
CONF1 My experience using smart house technologies is better
than I expected Nascimento et al.
(2018) CONF2 Overall, most of my expectations from using smart house
technologies were confirmed
CONF3 The various features of smart home technologies were better than what I expected
Samar Rahi, Mazuri Abd. Ghani, (2019) CONF4 I think that the virtual desktop is more useful than I
expected
Huang (2019)
Behavioral Intention
BI1 I intend to continue using smart home technologies in the future
Venkatesh et al. (2012) BI2 I will always try to use smart home technologies in my
daily life
B3 I plan to continue to use smart home technologies frequentely
Use
U1 Please choose your usage frequency for each of the following:
a) Speakers
b) Voice Activated Personal Assistants c) Lighting d) Domestic Robots e) Thermostats f) Door locks Venkatesh et al. (2012) Continuance Intention
CI1 I intend to continue using the smart home technologies, rather than discontinue its use
Nascimento et al. (2018) CI2 I plan to continue using smart home technologies
CI3 I will continue using smart home technologies
CI4 I predict I will continue using smart home technologies in the future
Satisfaction
SAT1 How do you feel about your overall experience of smart house technology use: Very dissatisfied / Very Satisfied
Nascimento et al. (2018) SAT2 Very displeased/Very pleased
SAT3 Very frustrated/Very contended SAT4 Absolutely terrible /Absolutely delighted Performance
Expectancy
PE1 I find smart home technologies useful in my daily life
Venkatesh et al. (2012) PE2 Using smart home technologies help me accomplish
things more quickly
PE3 Using smart home technologies increase my productivity Effort Expectancy EE1 Learning how to use smart home technologies is easy for
me
Venkatesh et al. (2012) EE2 My interaction with smart home technologies is clear and
understandable
EE3 I find smart home technologies easy to use
EE4 It is easy for me to become skillful at using smart home technologies
Social Influence SI1 People who are important to me think that I should use smart home technologies
Venkatesh et al. (2012) SI2 People who influence my behavior think that I should use
smart home technologies
SI3 People whose opinions that I value prefer that I use smart home technologies
Facilitating Conditions FC1 I have the resources necessary to use smart home technologies
Venkatesh et al. (2012) FC2 I have the knowledge to use smart home technologies
FC3 Smart home technologies are compatible with other technologies I use
FC4 I can get help from others when I have difficulties using smart home technologies
22
Hedonic Motivation HM1 Using smart home technologies is fun
Venkatesh et al. (2012) HM2 Using smart home technologies is enjoyable
HM3 Using smart home technologies is very entertaining Price Value PV1 Smart home technologies are reasonably priced
Venkatesh et al. (2012) PV2 Smart home technologies are a good value for the money
PV3 At the current price, smart home technologies provide a good value
Habit HT1 The use of smart home technologies has become a habit
for me Venkatesh et al.
(2012) HT2 I am addicted to using smart home technologies
HT3 I must use smart home technologies
W el l-b ei n g
Autonomy A1 I tend to be influenced by people with strong opinions
Ryff et al. (2008) A2 I have confidence in my own opinions, even if they are
different from the way most other people think
A3 I judge myself by what I think is important, not by the values of what others think is
important Environmental
Mastery
EM1 The demands of everyday life often get me down
Ryff et al. (2008) EM2 In general, I feel I am in charge of the situation in which I
live
EM3 I am good at managing the responsibilities of daily life Personal Growth PG1 For me, life has been a continuous process of learning,
changing, and growth
Ryff et al. (2008) PG2 I think it is important to have new experiences that
challenge how I think about myself and the world PG3 I gave up trying to make big improvements or changes in
my life a long time ago Positive
Relationships
PR1 Maintaining close relationships has been difficult and frustrating for me
Ryff et al. (2008) PR2 People would describe me as a giving person, willing to
share my time with others
PR3 I have not experienced many warm and trusting relationships with others
Purpose in life PL1 Some people wander aimlessly through life, but I am not one of them
Ryff et al. (2008) PL2 I live life one day at a time and don't really think about
the future
PL3 I think it is important to have new experiences that challenge how I think about myself and the world Self-acceptance SA1 I like most parts of my personality
Ryff et al. (2008) SA2 When I look at the story of my life, I am pleased with how
things have turned out so far
SA3 In many ways I feel disappointed about my achievements in life
1
Measurement tables
Mean SD CA CR Aut BI BU CI Conf EE EM FC Gen HM HT PE PR PV SA SI Sat
Aut 4.428 1.904 0.90 0.95 0.95 BI 4.976 1.403 0.92 0.95 -0.09 0.93 BU 3.160 1.580 NA NA 0.04 0.45 NA CI 5.299 1.512 0.97 0.98 -0.02 0.78 0.40 0.96 Conf 4.528 1.388 0.91 0.94 -0.12 0.69 0.54 0.65 0.89 EE 5.337 1.500 0.96 0.97 -0.28 0.67 0.29 0.59 0.61 0.95 EM 4.443 1.843 0.89 0.95 0.75 -0.03 0.17 0.04 -0.05 -0.23 0.95 FC 5.028 1.349 0.87 0.91 -0.17 0.69 0.23 0.66 0.68 0.82 -0.17 0.85 HM 5.098 1.551 0.95 0.97 -0.09 0.69 0.24 0.64 0.59 0.61 -0.22 0.61 -0.04 0.95 HT 5.086 1.130 0.47 0.79 0.08 0.02 0.05 0.03 0.08 0.01 0.02 0.01 0.06 0.04 0.81 PE 4.970 1.459 0.94 0.96 -0.21 0.74 0.34 0.60 0.62 0.62 -0.19 0.62 -0.12 0.60 0.05 0.95 PR 4.493 1.893 0.80 0.91 0.22 0.14 0.32 0.21 0.20 0.06 0.26 0.13 -0.05 0.18 -0.06 0.08 0.91 PV 3.307 1.234 0.91 0.94 -0.34 0.33 0.28 0.27 0.31 0.34 -0.29 0.36 0.00 0.13 -0.11 0.30 0.16 0.92 SA 4.539 1.728 0.81 0.89 0.64 -0.01 0.14 0.02 0.03 -0.19 0.61 -0.10 0.05 0.00 0.03 -0.07 0.50 -0.10 0.85 SI 3.639 1.632 0.90 0.93 -0.10 0.44 0.27 0.35 0.44 0.37 -0.12 0.35 -0.10 0.30 0.10 0.50 0.27 0.38 0.30 0.94 SAT 5.187 1.071 0.93 0.96 0.04 0.50 0.36 0.48 0.61 0.43 0.12 0.43 -0.17 0.37 0.04 0.44 0.16 0.19 0.17 0.40 0.88
2
Item Aut BI CI Conf EE EM FC HM HT PE PR PV SA Sat SI BU
Aut AUT2R 0.950 -0.124 -0.052 -0.156 -0.253 0.709 -0.178 -0.119 0.116 -0.244 0.233 -0.343 0.550 -0.003 -0.103 0.016 AUT3R 0.955 -0.044 0.013 -0.079 -0.278 0.718 -0.150 -0.047 0.032 -0.159 0.190 -0.304 0.669 0.080 -0.091 0.067 BI BI1 -0.064 0.915 0.755 0.717 0.695 0.007 0.750 0.644 0.000 0.705 0.123 0.377 -0.022 0.501 0.340 0.342 BI2 -0.109 0.919 0.667 0.555 0.532 -0.023 0.489 0.631 0.080 0.655 0.169 0.245 -0.032 0.413 0.409 0.490 BI3 -0.072 0.948 0.752 0.644 0.620 -0.055 0.667 0.650 -0.022 0.693 0.114 0.284 0.014 0.480 0.476 0.424 CI CI1 0.040 0.757 0.934 0.612 0.564 0.015 0.651 0.638 0.030 0.562 0.226 0.245 0.094 0.464 0.354 0.347 CI2 -0.036 0.762 0.967 0.590 0.541 0.030 0.601 0.598 -0.021 0.575 0.209 0.280 -0.007 0.429 0.321 0.389 CI3 -0.062 0.726 0.960 0.661 0.614 0.025 0.639 0.580 0.074 0.576 0.146 0.250 -0.042 0.455 0.321 0.396 CI4 -0.018 0.758 0.975 0.647 0.560 0.066 0.647 0.629 0.030 0.597 0.228 0.250 0.018 0.481 0.349 0.385 Conf CONF1 -0.189 0.633 0.647 0.924 0.573 -0.020 0.586 0.499 0.071 0.593 0.101 0.290 -0.066 0.579 0.396 0.563 CONF2 0.052 0.728 0.639 0.873 0.556 0.048 0.632 0.620 0.080 0.570 0.298 0.271 0.159 0.617 0.451 0.492 CONF3 -0.155 0.543 0.555 0.887 0.535 -0.149 0.620 0.476 0.051 0.514 0.149 0.289 0.035 0.520 0.426 0.448 CONF4 -0.161 0.540 0.470 0.883 0.514 -0.085 0.585 0.508 0.073 0.525 0.173 0.267 -0.043 0.441 0.294 0.417 EE EE1 -0.319 0.577 0.552 0.584 0.961 -0.252 0.770 0.557 0.004 0.561 0.080 0.334 -0.186 0.420 0.354 0.253 EE2 -0.224 0.696 0.562 0.585 0.931 -0.165 0.767 0.633 0.057 0.645 0.024 0.283 -0.130 0.435 0.378 0.263 EE3 -0.216 0.642 0.552 0.552 0.945 -0.233 0.775 0.594 -0.035 0.576 0.086 0.308 -0.188 0.372 0.339 0.253 EE4 -0.312 0.592 0.581 0.599 0.952 -0.243 0.812 0.530 -0.002 0.574 0.050 0.374 -0.227 0.395 0.344 0.323 EM EM2R 0.705 -0.030 -0.007 -0.072 -0.194 0.951 -0.169 -0.227 0.035 -0.194 0.262 -0.319 0.613 0.070 -0.072 0.158 EM3R 0.718 -0.019 0.076 -0.027 -0.251 0.947 -0.154 -0.184 0.003 -0.174 0.226 -0.233 0.545 0.163 -0.151 0.159 FC FC1 -0.059 0.544 0.513 0.578 0.602 -0.132 0.870 0.446 -0.050 0.483 0.129 0.337 -0.028 0.394 0.301 0.237 FC2 -0.096 0.632 0.548 0.530 0.847 -0.183 0.872 0.643 0.009 0.575 0.018 0.264 -0.091 0.343 0.320 0.156 FC3 -0.222 0.525 0.577 0.602 0.661 -0.120 0.841 0.486 -0.029 0.486 0.082 0.321 -0.157 0.430 0.153 0.131 FC4 -0.210 0.626 0.606 0.603 0.679 -0.139 0.817 0.478 0.099 0.557 0.219 0.293 -0.083 0.302 0.384 0.257 HM HM1 -0.068 0.662 0.590 0.560 0.557 -0.216 0.560 0.975 0.023 0.548 0.171 0.080 0.017 0.365 0.307 0.174 HM2 -0.092 0.680 0.676 0.603 0.622 -0.173 0.611 0.954 0.066 0.588 0.189 0.084 0.044 0.417 0.364 0.246 HM3 -0.088 0.638 0.553 0.530 0.577 -0.235 0.564 0.931 0.035 0.579 0.163 0.207 -0.074 0.268 0.181 0.266 HT HT1 0.052 -0.005 0.028 0.072 -0.017 0.017 0.021 0.008 0.787 0.054 -0.070 -0.071 0.024 0.053 0.078 0.044 HT2 0.071 0.034 0.019 0.054 0.028 0.016 0.001 0.061 0.827 0.024 -0.028 -0.112 0.019 0.017 0.078 0.033 PE PE1 -0.148 0.727 0.597 0.601 0.607 -0.134 0.648 0.583 0.047 0.955 0.118 0.309 -0.055 0.412 0.412 0.348 PE2 -0.216 0.710 0.589 0.611 0.601 -0.175 0.592 0.552 0.019 0.960 0.062 0.273 -0.110 0.421 0.409 0.342 PE3 -0.237 0.662 0.523 0.548 0.568 -0.248 0.523 0.571 0.071 0.929 0.055 0.259 -0.036 0.419 0.622 0.275 PR PR1 0.194 0.164 0.186 0.187 0.036 0.221 0.074 0.221 -0.063 0.118 0.915 0.121 0.486 0.185 0.263 0.305
3 PR3 0.210 0.100 0.200 0.185 0.079 0.249 0.172 0.111 -0.045 0.033 0.911 0.179 0.419 0.105 0.224 0.283 PV PV1 -0.361 0.290 0.179 0.233 0.302 -0.312 0.262 0.166 -0.179 0.282 0.188 0.902 -0.103 0.079 0.304 0.251 PV2 -0.256 0.334 0.337 0.317 0.307 -0.274 0.375 0.110 -0.041 0.306 0.120 0.911 -0.131 0.247 0.396 0.281 PV3 -0.324 0.269 0.202 0.308 0.329 -0.212 0.334 0.073 -0.106 0.217 0.146 0.937 -0.029 0.171 0.336 0.232 SA SA1R 0.716 -0.038 -0.055 -0.020 -0.171 0.601 -0.087 -0.004 0.047 -0.100 0.398 -0.145 0.893 0.145 0.153 0.136 SA2R 0.558 -0.120 -0.094 -0.072 -0.268 0.601 -0.222 -0.146 0.063 -0.182 0.262 -0.180 0.901 0.134 0.208 0.047 SA3 0.307 0.158 0.244 0.202 -0.021 0.314 0.076 0.179 -0.060 0.143 0.663 0.116 0.746 0.153 0.446 0.197 Sat SAT1 0.108 0.495 0.436 0.635 0.382 0.164 0.415 0.339 0.079 0.419 0.171 0.214 0.190 0.868 0.404 0.451 SAT2 0.061 0.506 0.493 0.556 0.410 0.095 0.429 0.421 0.024 0.429 0.107 0.099 0.188 0.933 0.353 0.255 SAT3 -0.053 0.318 0.317 0.369 0.297 0.054 0.283 0.156 0.004 0.285 0.201 0.239 0.049 0.801 0.307 0.226 SAT4 -0.008 0.405 0.399 0.533 0.400 0.094 0.344 0.328 0.027 0.382 0.096 0.117 0.127 0.903 0.338 0.288 SI SI1 -0.055 0.390 0.321 0.364 0.313 -0.103 0.322 0.234 0.074 0.446 0.284 0.360 0.305 0.391 0.920 0.234 SI2 -0.121 0.415 0.273 0.440 0.350 -0.073 0.277 0.295 0.098 0.455 0.268 0.359 0.284 0.339 0.929 0.313 SI3 -0.110 0.433 0.388 0.442 0.389 -0.149 0.377 0.313 0.100 0.511 0.204 0.352 0.245 0.401 0.965 0.227 BU USE1 -0.012 0.357 0.386 0.367 0.282 0.142 0.241 0.118 0.104 0.180 0.114 0.294 0.042 0.241 0.228 0.771 USE2 0.056 0.391 0.369 0.488 0.268 0.184 0.189 0.270 0.063 0.317 0.161 0.167 0.187 0.273 0.257 0.841 USE3 -0.028 0.233 0.225 0.302 0.163 0.109 0.123 0.068 0.062 0.176 -0.136 0.156 0.021 0.114 0.263 0.438 USE4 -0.022 0.216 0.103 0.320 0.011 0.012 -0.001 0.068 -0.091 0.233 0.349 0.117 0.042 0.292 0.198 0.539 USE5 -0.002 0.308 0.183 0.334 0.203 0.060 0.210 0.162 -0.017 0.277 0.149 0.138 -0.061 0.182 0.039 0.583 USE6 0.084 0.157 0.136 0.308 0.106 0.102 0.098 0.002 0.060 0.123 0.162 0.326 0.141 0.153 0.332 0.422
Indicator
VIF
USE1
1.956
USE2
2.129
USE3
2.809
USE4
1.424
USE5
1.622
USE6
2.372
Table 3 - Loadings and cross-loadings for the measurement model
4
Bhattacherjee (2001) ECM Research Model
Construct R2 R2 Adj Construct R2 R2 Adj.
Continuance Intention 0.45 0.44 Continuance Intention 0.64 0.63
Performance Expectancy 0.27 0.27 Performance Expectancy 0.38 0.37
Satisfaction 0.57 0.47 Satisfaction 0.42 0.40
Behavioural Intention 0.70 0.68
Use 0.23 0.21
Well-being 0.31 0.29