Página | 186
https://periodicos.utfpr.edu.br/rbgeo
Determination of vertical deviations of
guide rails with different surveying
techniques
ABSTRACT Alyne Raminelli Siguel Gemin
[email protected] orcid.org/0000-0001-6855-8412 Universidade Tecnológica Federal do Paraná (UTFPR), Dois Vizinhos, Paraná, Brasil.
Érica Santos Matos
[email protected] orcid.org/0000-0003-4423-272X Universidade Federal do Paraná (UFPR), Curitiba, Paraná, Brasil.
Pedro Luis Faggion
[email protected] orcid.org/0000-0002-4881-8720 Universidade Federal do Paraná (UFPR), Curitiba, Paraná, Brasil.
Due to the diverse application areas of dimensional metrology and the demand for surveys where precision is guaranteed, the approach through geodetic surveying techniques is an alternative for large-scale metrology. In the Laboratory of Geodetic Instrumentation of the Federal University of Paraná, a structure was developed for calibration of vertical Invar rods and digital leveling systems, in which this structure is composed of two parallel guide rails. The vertical deviations of these guide rails can cause deviations during the calibration processes, and consequently, affect the results of the calibration procedure. Therefore, an investigative study is proposed to determine these deviations of the guide rails by different techniques and equipment. Direct leveling methods (differential leveling using digital level and optical level), indirect methods (trigonometric leveling using total station) and electronic level were used. As results, the vertical deviations of the guide rails were obtained with submillimetre precision, regardless of technique and methodology applied. The results were evaluated using the Pearson correlation coefficient, indicating that there were no statistical differences between the calculated deviations.
Página | 187
INTRODUCTION
Metrology is defined by the International Bureau of Weights and Measures (BIPM) as the science of measurement, which covers theoretical and practical aspects of measurements, regardless of uncertainty level and field of application (BIPM, 2017). Among the various classification areas there is dimensional metrology, whose purpose is to determine lengths, angles, shapes and other geometric relationships (SMITH, 2016; BIPM, 2013). Thus, dimensional metrology becomes important in the most diverse fields of engineering, architecture, construction and surveying (NADAL, 2000).
In this context, large-scale metrology is inserted and relates to measurement processes used in the field of technology production for geometric inspection of objects, which dimensions can vary from one meter to hundreds of meters (OGUNDARE, 2015). Therefore, large scale metrology, engineering survey or industrial geodesy are some of the terms used for the application of geodetic or photogrammetric techniques for precise measurement of large objects when conventional techniques are not appropriate (LEICA GEOSYSTEMS, 2011), such as the use of traditional coordinate measuring machines (CUYPERS et al., 2009). Other terms, such as industrial surveying or industrial metrology, are also adopted and refer to this same concept.
Several applications of industrial geodesy can be cited when precise surveys are required, such as positioning and alignment of industrial machines, aerospace alignment, geometric verification of ship and car components, calibration of industrial robots, control of machine stability, positioning, displacements, monitoring of civil and mechanical design, and various other purposes (MAYOUD, 2004; LEICA GEOSYSTEMS, 2006).
However, the precision required during a geodetic survey influences the choice of instruments, methods and techniques to be applied in the solution (MATOS; GEMIN; FAGGION, 2017). Therefore, it is sought in this paper to compare different methods and instruments frequently used in precision surveys to determine the vertical deviations of guide rails.
The Laboratory of Geodetic Instrumentation (LAIG) of the Federal University of Paraná (UFPR) has developed a structure for calibration of vertical Invar rod and digital leveling systems, which consists of two parallel guide rails used to move a transport system that contains part of the equipment used in the calibration process. Since the geometry of these guide rails can cause deviations in the calibration result, it is important to model possible vertical deviations that are compatible with the quality of the calibration process.
In this way, the study of vertical deviations of guide rails through different geodetic methods was carried out. Direct method (differential leveling using digital level and optical level) and indirect methods (trigonometric leveling using total station) were employed, as well as the use of electronic level. In addition, the environmental conditions of the laboratory as well as the instruments used in the surveys were controlled to achieve sub-millimeter order precision, compatible with the industrial needs (MATOS; GEMIN; FAGGION, 2017).
The methodology used during the surveys allowed the comparison of vertical deviations of observed points on the guide rails, with the advantage of performing
Página | 188
Finally, the approach adopted was proved applicable to solve several problems where the geometric inspection of objects is necessary, whether or not they are in industrial environments, becoming an alternative to the techniques traditionally used in large-scale metrology.
METHODOLOGY
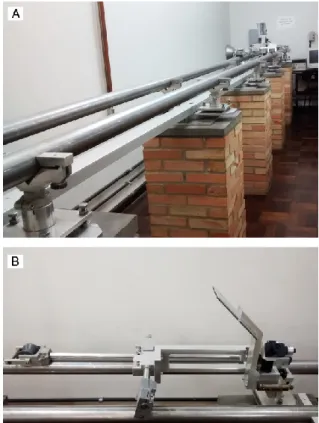
At LAIG, the research focus is given on verification, correction, calibration and classification of topographic and geodetic instruments. Among the procedures performed, emphasized the calibration system of the vertical Invar rods and digital level system. This system is composed of two parallel cylindrical guide rails made of steel, measuring five meters in length and with an external diameter of 6 cm (Figure 1A), a laser interferometer and horizontal transport system (Figure 1B).
Figure 1 – Calibration system of the vertical Invar rods and digital leveling systems of LAIG with (A) two parallel steel rails measuring five meters in length and (B) horizontal
transport system
Source: Own authorship (2018).
In the calibration system influence factors are considered (temperature, pressure and relative humidity). The laboratory is equipped with an air conditioning system, which allows maintaining the reference temperature for calibration (± 20°C). In addition, the windows are isolated by styrofoam plates, which help in maintaining the temperature stability. To monitor environmental conditions are also used temperature, pressure and relative humidity sensors. The structure of the calibration device was made with reinforced concrete pillars inserted at the foundation of laboratory. This minimizes the influence of external factors that occur outside the laboratory. On the concrete pillars are fixed the parts that make up the calibration system (for example, support for the equipment that will be
Página | 189
calibrated, guide rail fixing system and guide rails). This equipment was manufactured in aluminum, so they are less susceptible to temperature changes. The horizontal transportation system is a structure made of aluminum with a length of 1 m, which enables the motion of the interferometer mobile reflectors, in addition to a precision tubular level, a plane mirror is inclined at 45º and a pointing system, which are used during the calibration processes. More information about this system can be analyzed in Gemin et al. (2016). This system moves horizontally on the guide rails and is supported under three wheels, and due to its size, its maximum displacement on guide rails is 4.1 m, which is compatible with the dimensions of the vertical Invar rod.
As mentioned, this study aims to investigate the vertical deviations of the guide rails and compare the results obtained with methods and instruments commonly used in geodesic surveys. For this purpose, the survey method adopted was the leveling. The leveling method can be defined as the process for measuring vertical distances between two or more points and then determine their heights (BRINKER; WOLF, 1977).
The leveling methods can be classified in direct and indirect, according to the quantities measured during the surveys. In the direct method the difference of elevation is directly obtained and in the indirect methods these are obtained
through trigonometric relations between angles and distances (BRINKER; WOLF,
1977). In this study, surveys with both classes of methods were performed. For the direct method, a Wild N3 optical level with a pair of targets (specific points recorded on a plate used to perform aim) and a Leica DNA03 digital level with a pair of barcode Invar rods were used. In the indirect method, a Leica TS15 total station with a pair of Leica mini prism and the Taylor-Robson Talyvel 3 electronic level were used.
In addition, specific precautions were taken before surveys. First, verification and rectification processes were carried out on each of the equipment’s employed, according to the indications of the manufacturers. Afterwards, each equipment was set up, as well as the temperature control of the laboratory. The temperature adopted was 20 °C, which is similar to the temperature used during other calibration processes (BRECHER et al., 2014 apud SCHMITT et al., 2016).
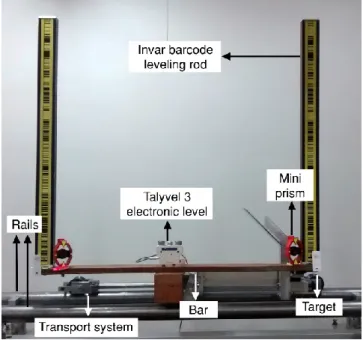
The methodology adopted by Faggion (1993) was applied to simultaneously carry out the measurements with direct and indirect leveling methods, in order to guarantee the observation of the same points on the guide rails under the same environmental conditions. For this purpose, it was installed a bar with 1 m in length on the horizontal transport system. Thus, this bar can be used to fix auxiliary equipment (pair of targets, pair of rods and pair of mini prisms used with the optical level, digital level and total station respectively), and position the electronic level, used during observation of the points of interest (Figure 2).
Página | 190
Figure 2 – Auxiliary equipment fixed on the bar in the horizontal transport system
Source: Own authorship (2018).
Three series of observations were performed in 41 positions along the guide rails through direct and indirect leveling methods. The displacements of the horizontal transport system with the auxiliary equipment’s were performed every 100 mm, being controlled by the interferometric system. This interferometric system guarantees the precision of the repeatability of the observed positions. In addition, this enabled to compare the results and precisions achieved in each of the configurations.
The methodology of each survey and the description of instruments used will be discussed in the topics below.
DIFFERENTIAL LEVELING WITH OPTICAL LEVEL
The geometric leveling consists in determining the elevation difference between points through readings corresponding to horizontal sight, obtained with a level at rods placed vertically in the referred to points (GHILANI; WOLF, 2012). Among the techniques of differential leveling, the most precise is the leveling by equal sights, which minimizes errors due to systematic effects, for example, lack of parallelism between the line of sight and the axis of the tubular level of the equipment. Using this technique, the level is positioned between the points to be obtained the elevation difference, usually called backsight and foresight points.
The equipment used in this survey was the Wild N3 optical level, where the precision is ± 0.2 mm per kilometer for double leveling (Figure 3A) and a pair of acrylic targets (Figure 3B). This equipment allows the reading of the tenth of the millimeter and estimate of the hundredth of the millimeter to each position. The targets were fixed at the ends of the bar to maintain the principle of equal sights, allowing to carry out the survey in each position on the guide rail to perform backsight and foresight readings (Figure 3b).
Página | 191
Figure 3 – Surveying by differential leveling with (A) a Wild N3 optical level installed in the LAIG (b) and a pair of targets used for backsight and foresight
Source: Own authorship (2018).
Backsight (𝐿𝑏𝑎𝑐𝑘𝑠𝑖𝑔ℎ𝑡 ) and foresight (𝐿𝑓𝑜𝑟𝑒𝑠𝑖𝑔ℎ𝑡) readings were performed at each
position of the horizontal transport system on the guide rail, which level difference (∆ℎ𝑖) can be calculated by Equation 1:
∆hi=Lbacksight -Lforesight (i=0...41) (1)
The vertical deviations of the guide rails (𝑉∆ℎ) is calculated by the residual between
the elevation difference of each of the other positions (∆ℎ𝑖) in relation to the
elevation difference in the zero position (∆ℎ0), adopted as origin (point adopted as
origin of the guide rail next to the laser interferometer), according to Equation 2:
Página | 192
DIFFERENTIAL LEVELING WITH DIGITAL LEVEL
Differential leveling by equal sights was also used to determine the vertical deviations of the guide rails with a Leica DNA03 digital level (Figure 4A), which precision is ± 0.3 mm per kilometer for double leveling with barcode invar rods (GUM, 2008). The digital level was installed on an industrial tripod. Readings were automatically made on a pair of barcode Invar rods with 1 m length, which were positioned at the ends of the bar (Figure 4B).
Figure 4 – Surveying by differential leveling with (A) a Leica DNA03 digital level installed in the LAIG (B) and a pair of barcode invar rods used for backsight and foresight
Source: Own authorship (2018).
The process to determine the vertical deviations of the guide rails is based on the same principles of Equations 1 and 2.
TRIGONOMETRIC LEVELING
The trigonometric leveling aims to determine the elevation difference between points indirectly, based on the trigonometric relationship between the vertical angle and the distance measured (GHILANI; WOLF, 2012). The authors decided not to include the height of the instrument and the sighting object for the calculation of the differential leveling, thus avoiding possible errors in their determination. Another care taken was to keep similar distance while reading each point on the guide rail.
Página | 193
The equipment used was a Leica TS15 total station (figure 5A), which nominal angle precision is 1'' and linear of ± 1 mm + 1.5 ppm (KAHMEN; FAIG, 1988) and two Leica mini prisms (figure 5B) fixed on bar.
Figure 5 – Surveying by Trigonometric Leveling with (A) a Leica TS15 total station installed in the LAIG and (B) a pair of mini prisms used for backsight and foresight
Source: Own authorship (2018).
First, vertical distance between each of the mini prisms and the optical center of the instrument was calculated by Equation 3, and then calculated the backsight and foresight readings for each rail position observed. The automatic target aiming (ATR) was used to aiming the observed points and to calculate the vertical distance (𝑑𝑣𝑖
)
were observed the slope distance (𝑑𝑖𝑖)
and the zenith angle (𝑍𝑖) (Equation
3).
dvi=dii∙cos (Zi) (i=0...41) (3)
The differences between vertical distances of backsight (𝑑𝑣𝑖𝑏𝑎𝑐𝑘𝑠𝑖𝑔ℎ𝑡) and foresight (𝑑𝑣𝑖𝑓𝑜𝑟𝑒𝑠𝑖𝑔ℎ𝑡) measurements for each position on the guide rails were determined
Página | 194
in relation to the vertical distances calculated in the zero position (𝑑𝑣0𝑏𝑎𝑐𝑘𝑠𝑖𝑔ℎ𝑡 and 𝑑𝑣0𝑓𝑜𝑟𝑒𝑠𝑖𝑔ℎ𝑡) adopted as origin, such that:
∆dvi backsight =dvi backsight -dv0 backsight (i=0...41) (4) ∆dvi foresight =dvi foresight -dv0 foresight (i=0...41) (5) Where
∆𝑑𝑣𝑖𝑏𝑎𝑐𝑘𝑠𝑖𝑔ℎ𝑡– difference between the vertical distance of backsight point for each position and the zero position in the guide rail;
∆𝑑𝑣𝑖𝑓𝑜𝑟𝑒𝑠𝑖𝑔ℎ𝑡– difference between the vertical distance of foresight point for each position and the zero position in the guide rail.
Finally, the vertical deviations of the guide rails (𝑉∆ℎ𝑡 ) were determined by Equation
6:
V∆ht =
൫
∆dvi foresight൯
-൫
∆dvibacksight൯
(i=0...41) (6)ELECTRONIC LEVELING
Taylor Hobson’s® Talyvel Electronic Level systems provides a versatile and precise measurement for a wide variety of industrial and optical engineering applications (SILVA, 2002). The Talyvel 3 Electronic Level can be used to determine slopes and its principle of operation is based on a body suspended in an electric field, where the variation of this electric field is correlated with the inclination of the equipment and consequently with the inclination of what is being measured (FAGGION, 1993). In the experiment, the electronic level was positioned in the center of the bar which was used in previous tests (Figure 6). Then, angles of inclination were measured on each position in the guide rail with precision of 0.2 seconds of arc.
Página | 195
Figure 6 – Slope measurement with electronic level. Surveying with Talyvel 3 Electronic Level positioned on the bar
Source: Own authorship (2018).
Elevation differences (∆ℎ𝑖𝑡) were calculated with the angles of inclination (𝛼𝑖) in
each position in the guide rail as well as the distance between each reading (𝑑𝑖 = 100 𝑚𝑚) provided by the interferometric laser system, where:
∆hi t
=di∙ sin (αi)
(i=0...41) (7)
Then, vertical deviations of the guide rails were calculated by Equation 2. According (GUM, 2008) accuracy means the closeness of the agreement between the result of a measurement and a true value of the measurement. However, a true value cannot be determined because is the value that would be obtained by a perfect measurement, but sometimes, the true value to a particular quantity is accepts by convention (GUM, 2008). So, in this paper the vertical deviations of the guide rails calculated by electronic leveling were used as reference (true value) to investigation and evaluation of the other method. This choice occurred because the electronic level is the most precise instrument of this set (optical level, digital level and total station), concomitant to the fact that its measurements are performed with less independently of the operator.
RESULTS AND DISCUSSION
Table 1 presents partial set of the results of the deviations calculated from the position 1.0 m to 4.1 m at the guide rails. This information was obtained from the average of the three series of observations made with each equipment where each reading was the average of three consecutive readings, which made it possible to analyze the standard deviations (s) and to verify the precision of the measurements performed. Precision refers to the degree of refinement or
Página | 196
If multiple observations are made of the same quantity and small discrepancies result, this indicates high precision (GHILANI; WOLF, 2012). So, the standard deviations of measurements were used to characterize the dispersion (discrepancy) of the observed values (GUM, 2008).
Table 1 – Vertical deviations of the guide rails and respective standard deviations by equipment used Position in the rail (mm) Electronic Level (reference) (mm) σ (mm) Optical Level (mm) σ (mm) Digital Level (mm) σ (mm) Total Station (mm) σ (mm) 100 0.09 0.01 0.02 0.04 0.08 0.01 0.16 0.10 200 0.11 0.02 0.02 0.02 0.12 0.02 0.16 0.13 600 0.07 0.03 0.04 0.03 0.07 0.02 0.12 0.32 700 0.05 0.04 -0.03 0.04 0.06 0.03 -0.05 0.51 1100 0.71 0.04 0.69 0.03 0.72 0.01 0.71 0.30 1200 0.63 0.05 0.61 0.03 0.64 0.02 0.58 0.14 1600 0.45 0.05 0.44 0.01 0.46 0.02 0.43 0.12 2100 0.06 0.07 0.07 0.15 0.06 0.02 -0.08 0.15 2600 0.26 0.03 0.21 0.01 0.28 0.03 0.19 0.70 3100 0.25 0.03 0.25 0.08 0.27 0.04 0.17 0.46 3600 0.42 0.05 0.44 0.05 0.45 0.04 0.39 0.19 4100 -0.10 0.04 -0.03 0.11 -0.09 0.06 -0.20 0.03
Source: Own authorship (2018).
The complete results obtained for the investigation of the vertical deviations of the guide rails are shown in Figure 7.
Figure 7 – Vertical deviations of the guide rails. The vertical deviations of the guide rails were obtained by different surveys and equipment from point 0.1 m to point 4.1 m
Source: Own authorship (2018).
The maximum vertical deviation (Figure 7 and Table 1) occurred at the position of 1.1 m in relation to the origin of the guide rail, reaching a value of 0.72 mm ± 0.01 mm with the digital level. This maximum deviation was also obtained with all equipment used. In relation to the minimum deviation, when compared to the reference survey, that is, with the electronic level, they occurred around the 0.7 m
Página | 197
of the rail, reaching 0.06 mm ± 0.03 mm, -0.035 mm ± 0.04 mm and -0.05 mm ± 0.51 mm using the digital level, optical level and total station respectively.
Regarding the settlements, the vertical descending deviation was observed with greater magnitude in the position of 4.1 m with all methods and equipment used: -0.09 mm ± 0.06 mm (digital level), -0.03 mm ± 0.1 mm (optical level), -0.10 mm ± 0.04 mm (electronic level) and -20 mm ± 0.03 mm (total station). Furthermore, the maximum amplitude of the guide rails, considering the reference instrument, was 0.82 mm ± 0.04 mm.
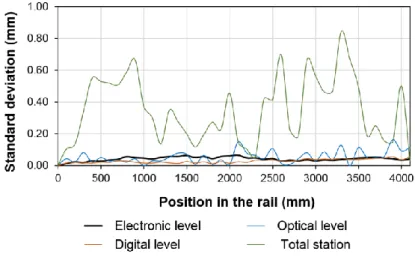
The standard deviations parameter, associated with the result of a measurement, that characterizes the dispersion of the values (GUM, 2008). Therefore, the comparison of the respective standard deviations was used to better evaluate the differences between the surveys, and to compare methodologies and instruments used (Figure 8). Based on the results, the survey with lower standard deviations from the reference survey (electronic level) was obtained with the digital level, in which the mean standard deviation was ± 0.03 mm. This information can also be visualized in Figure 7, with the proximity of both curves, and this is attributed to the fact that the measurement is performed with less influence of the observer in comparison with the other methods.
Figure 8 – Standard deviation of vertical deviations. The standard deviation of vertical deviations was obtained by different surveys and equipment from point 0.1 m to point
4.1 m.
Source: Own authorship (2018).
The mean standard deviation of observations by electronic level was ±0.04 mm. On the other hand, the mean standard deviation of readings by optical level was ±0.05 mm, which is consistent with the expected, since the operator needs to aim at the target, focus the image and perform the position reading manually, facts that reflect directly in the observations. However, the readings with the greatest deviations were obtained using the total station, achieving a mean of ± 0.35 mm. This greater variability, when compared with electronic, digital and optical levels, is related to the specification of the instrument, as well as the repeatability of observed target centering, because the zenith angle measure is a function of the aim, which significantly influence the results. The law of the propagation of variances can also be an alternative for the user of these equipment to verify the expected precision of the parameters observed in the indirect method (distance
Página | 198
and angle), where the nominal precision of the equipment must be considered. This approach can be considered in future research.
The comparison of the mean standard deviations of all the surveys carried out allows to affirm that the vertical deviations of the guide rails were determined with submillimetre precision (small dispersion) in any of the solutions. The degree of correlation between two or more variables is characterized by the estimated correlation coefficient (GUM, 2008). This is a statistical measures of correlation, therefore, Pearson's correlation coefficients were calculated to evaluate the degree of linear correlation between the surveys, analyzed pair a pair (MUDELSEE, 2003), as indicated in Table 2. The correlation was used to verify if the surveys can be considered statistically equal.
Table 2 – Pearson’s correlation coefficients between different surveys
Analyzed surveys Pearson’s correlation coefficients
Digital level x Optical level 0.96
Digital level x Electronic level 0.99
Digital level x Total station 0.95
Optical level x Electronic level 0.95
Optical level x Total station 0.89
Electronic level x Total station 0.95
Source: Own authorship (2018).
The Pearson’s coefficient values from Table 2 indicate the strong correlation between the comparison pairs, since the values found are close to 1.00. The correction coefficients of the survey with electronic level, adopted as reference, was values equal to 0.99, 0.95 and 0.95 in relation to the digital level, the optical level and the total station respectively. Therefore, it was noted that the results of all the surveys did not differ from each other.
CONCLUSION
According to the results, all the survey methods employed made possible to determine the vertical deviations of the guide rails with small variation, providing submillimetre precision. Besides that, the results can be considered statistically equivalent, regardless of the methodologies and instruments used, since the Pearson's correlation coefficients were close to about 1. Therefore, it was verified that the different leveling techniques, used in precise surveying, can be applied in large-scale metrology, if specific care, presented in this paper, shall be taken. During surveying, several parameters can influence the measurements performed with the different equipment and techniques presented, such as the thermal expansion of the measured material, refractive index or possible instabilities of the guide rails. However, several precautions were considered before the observations, for example, verification and rectification of the instruments, control and monitoring of the temperature and the instrument adjustment to the ambient temperature. Even so, in order to be able to indicate the uncertainty of the measures and to better evaluate the results, it is recommended in other papers to investigate the sources of errors and the standard uncertainties of the observations.
Página | 199
Based on the investigations of this paper, future users can select the best solution, which involves a choice of different factors, such as the equipment and techniques, based on the precision, agility and speed, according to the environment and structure to be studied. In addition, the degree of precision achieved is dependent on equipment sensitivity and observer skill (GHILANI; WOLF, 2012). The digital level provides more agility and precision, however the optical level also provides precision, but the reading is not performed automatically. Regarding the total station, the difficulty was the high precision aim, due to the distance between the mini prisms and the equipment (3m), except this fact, also provides precision and agility like the other solutions.
In LAIG, the calibration structure of vertical Invar rods was adequate to allow the calibration of digital leveling systems. This adequacy has, as the main difference from the existing horizontal comparators (used in the calibration of digital leveling systems), the characteristic of keeping the rod stopped. In this case, a plane mirror positioned at 45° is fixed in the transport system that moves on the guide rails presented, making possible electronic measures through the reflection of the image of a bar code rod (GEMIN et al., 2016).
The condition for the digital level view a vertical image of the rod is that the mirror is inclined at 45° to the line of sight of the level and simultaneously to the normal line of the rod. However, the vertical deviations of the guide rails may move the mirror from the ideal position when the transport system is moved for the observations of the whole length of the rod. Considering the rotation property of a plane mirror, if there is rotation of an angle α in the mirror, the angular displacement of the observed image will be two times larger than the rotation angle of the mirror. Thus, considering the worst case during the calibration of a digital leveling system, where the maximum vertical deviation of the guide rails is equal to 0.72 mm and the observation distance between the digital level and the rod is equal to 1800 mm, it is estimated that the image displacement will be equal to 0.29 mm (more information about this math's calculation can be verified in Gemin (2017)). These displacements originated from vertical deviations of the guide rails may cause a change in the length of the step adopted between consecutive readings taken with the digital level, resulting in systematic errors. However, due to the constructive design of the calibration system, the inclination of the mirror can be corrected with the leveling of the precision tubular level fixed in the transport system, minimizing the influence of such errors and guaranteeing the conditions for calibration.
The investigation of the vertical deviations of the guide rails should be performed periodically for checking the stability of the calibration structure over time, showing the importance of leveling the transport system that carries the equipment used in the calibration.
Página | 200
Determinação dos desvios verticais de
trilhos utilizando diferentes técnicas de
levantamento
RESUMO
Considerando as diversas áreas de aplicação da metrologia dimensional e a demanda por levantamentos em que assegura-se precisão, a abordagem através de técnicas de levantamentos geodésicos são uma opção para a metrologia em grande escala. No Laboratório de Instrumentação Geodésica (LAIG) da Universidade Federal do Paraná (UFPR) foi construído uma estrutura para a calibração de miras verticais de ínvar, onde esta estrutura é composta por dois trilhos paralelos. Os desvios verticais destes trilhos podem causar desvios durante os procedimentos de calibração, e consequentemente, afetar os resultados do procedimento de calibração. Portanto, propõem-se uma metodologia específica para aplicar diferentes métodos e instrumentos utilizados em levantamentos geodésicos, a fim de determinar os desníveis dos trilhos. Foram utilizados métodos de nivelamento direto (nivelamento geométrico utilizando nível digital e nível óptico) e métodos indiretos (nivelamento trigonométrico utilizando estação total) e nível eletrônico. Como resultados, obteve-se os desníveis dos trilhos com precisão submilimétrica, independente da técnica e da metodologia aplicada. Os resultados também foram avaliados através do coeficiente de correlação de Pearson, indicando que não houve diferenças entre as irregularidades verticais calculadas.
PALAVRAS-CHAVE: Trilhos. Técnicas de levantamentos geodésicos. Metrologia em grande escala.
Página | 201
REFERÊNCIAS
BRECHER, C. KLOCKE, F. SCHMITT R. SCHUH G.. Industrie 4.0: Aachener Perspektiven: Aachener Werkzeugmaschinenkolloquium 2014. 1st ed. Shaker, Herzogenrath.
BIPM-Bureau International of Weights and Measures. Classification of services in
length. 2013. Accessed April 2, 2017.
https://kcdb.bipm.org/appendixC/L/L_services.pdf
BIPM-Bureau International of Weights and Measures. What is metrology? 2017.
Accessed April 20, 2017. http://www.bipm.org/en/worldwide-metrology/
CUYPERS, W., VANGESTEL, N., VOET, A., KRUTH, J. P., MINGNEAU, J., BLEYS, P.. Optical measurement techniques for mobile and large-scale dimensional metrology. Optics and Lasers in Engineering, v. 47, p.292–300, Apr. 2009.
http://dx.doi.org/10.1016/j.optlaseng.2008.03.013.
FAGGION, P. L.. Contribuição para a implantação de um sistema de aferição de miras na UFPR. Dissertation, Federal University of Paraná. Curitiba, Brazil, 1993. 147 p.
GEMIN, A. R. S.. Desenvolvimento de um sistema de calibração horizontal para sistemas de nivelamento digitais. Dissertation, Federal University of Paraná. Curitiba, Brazil, 2017. 135 p.
GEMIN, A. R. S., MATOS, E. S., FAGGION, P. L.. Investigações preliminares do processo de calibração de sistemas de nivelamento digitais utilizando comparador horizontal na UFPR. Revista Brasileira de Cartografia, v. 68, n. 10, Dez. 2016. GHILANI, C. D., WOLF, P. R.. Elementary Surveying: An introduction to geomatics. Book. New Jersey: Prentice Hall, 2012. 984 p.
GUM- Guide to the expression of uncertainty in measurement. Evaluation of measurement data — Guide to the expression of uncertainty in measurement 2008. 134 p.
KAHMEN, H., FAIG, W.. Surveying. Book. Berlin/New York: De Gruyter, 1988, 578 p.
Página | 202
Leica Geosystems Ltd. User Guide: Leica TS11/TS15. Version 2.0, English, 2011. MATOS, É. S., GEMIN, A. R. S., FAGGION, P. L.. Model for determination of three-dimensional coordinates of hidden points. Boletim de Ciências Geodésicas, v. 23, n. 1, p.182-195, Jan. 2017. http://dx.doi.org/10.1590/S1982-21702017000100012 MAYOUD, M.. Large Scale Metrology for Research and Industry – Application to Particle Accelerators and Recent Developments. FIG Working Week. Athens, p. 1-15, 2004.
MUDELSEE, M.. Estimating Pearson's Correlation Coefficient with Bootstrap Confidence Interval from Serially Dependent Time Series. Mathematical Geology, v. 5, n. 6, p.651-665. Aug. 2003.
NADAL, C. A.. Método da interseção óptica tridimensional aplicado à engenharia de precisão. Thesis, Federal University of Paraná. Curitiba, Brazil, 2000. 126 p. Accessed March 6, 2017. http://www.acervodigital.ufpr.br/handle/1884 /41165. OGUNDARE, J. O.. Precision Surveying: The Principles and Geomatics Practice. New Jersey: Wiley-Blackwell, 2015. 648 p.
SILVA, G. M. S. DE.. Basic Metrology for ISO 9000 Certification. Woburn, Butterworth-heineman, 2002. 240 p.
SCHMITT, R. H., PETEREK, M., MORSE, E., KNAPP, W., GALETTO, M., HÄRTIG, F., GOCH, G., HUGHES, B., FORBES, A., ESTLER, W. T.. Advances in Large-Scale Metrology - Review and future trends. CIRP Annals - Manufacturing Technology, v. 65, n. 2, p.643-665. Jun. 2016. https://doi.org/10.1016/j.cirp.2016.05.002. SMITH, G. T.. Machine Tool Metrology. An Industrial Handbook. Switzerland: Springer International Publishing. 2016, 685 p. https://doi.org/10.1007/978-3-319-25109-7
Página | 203
Recebido: 25 fev. 2019 Aprovado: 01 out. 2019 DOI: 10.3895/rbgeo.v7n4.9661
Como citar: GEMIN, A. R. S.; MATOS, É. S.; FAGGION, P. L. Determination of vertical deviations of guide rails with different surveying techniques. R. bras. Geom., Curitiba, v. 7, n. 4, p. 186-203, out/dez. 2019. Disponível em: <https://periodicos.utfpr.edu.br/rbgeo>. Acesso em: XXX.
Correspondência: Alyne Raminelli Siguel Gemin
Estrada para Boa Esperança, Km 04, Comunidade São Cristovão, CEP 85660-000, Dois Vizinhos, Paraná, Brasil.
Direito autoral: Este artigo está licenciado sob os termos da Licença Creative Commons-Atribuição 4.0 Internacional.