Determination of aldehyde compounds and other
lipid peroxidation products in biological samples
by GC-MS.
Evaluation of aldehydes as possible markers of
prostate cancer in urine samples.
Ana Isabel Faria Azevedo
Dissertation thesis for the Master Degree in Analytical, Clinical and
Forensic Toxicology to the Faculty of Pharmacy, University of Porto
Dissertação de candidatura ao grau de Mestre em Toxicologia Analítica,
Clínica e Forense apresentada à Faculdade de Farmácia, Universidade do
Porto
Supervisor
Doutora Maria Paula do Amaral Alegria Guedes de Pinho
Co-supervisors
Doutora Joana Isabel Monteiro Pinto
Professora Doutora Maria de Lourdes Pinho de Almeida Souteiro Bastos
November, 2018
II
É AUTORIZADA A REPRODUÇÃO PARCIAL DESTA TESE, APENAS PARA EFEITOS DE INVESTIGAÇÃO, MEDIANTE DECLARAÇÃO ESCRITA DO INTERESSADO, QUE A
III
This work received financial support from the European Union (FEDER funds POCI/01/0145/FEDER/007728) and National Funds (FCT/MEC, Fundação para a Ciência e a Tecnologia and Ministério da Educação e Ciência) under the Partnership Agreement PT2020 UID/MULTI/04378/2013.
The study is a result of the project NORTE-01-0145-FEDER-000024, supported by Norte Portugal Regional Operational Programme (NORTE 2020), under the PORTUGAL 2020 Partnership Agreement (DESignBIOtecHealth—New Technologies for three Health Challenges of Modern Societies: Diabetes, Drug Abuse and Kidney Diseases), through the European Regional Development Fund (ERDF).
IV Acknowledgments
Durante a realização deste trabalho e no decorrer da minha formação académica, foram muitas as pessoas que, de diferentes maneiras, me ajudaram para que os meus objetivos fossem concretizados. Este trabalho não teria sido possível sem a colaboração e a boa vontade daqueles a quem me dirijo e, a quem desde já, agradeço profundamente.
À Doutora Paula Guedes, expresso o meu agradecimento pela orientação e disponibilidade sempre demonstrada, assim como a oportunidade de realizar este projeto e por toda a confiança depositada. Agradeço todos os conhecimentos científicos transmitidos, que me ajudaram durante todo este projeto.
À Doutora Joana Pinto, por todo o tempo que dispensou para me ajudar, comentários e sugestões, que ajudaram no decorrer deste trabalho, mas também para o futuro.
À Professora Doutora Maria de Lourdes Bastos, por toda a dedicação a este mestrado e também por ter coorientado este trabalho. Obrigada pela disponibilidade.
Ao IPO do Porto por ter cedido as amostras biológicas, para a realização deste trabalho.
À Ana Rita Lima, agradeço profundamente todo o acompanhamento durante estes meses. Por todo o apoio, ajuda e tempo dispensado, obrigada pela paciência. Obrigada por estares sempre disponível para me ajudar, para conversar e para me transmitires o teu conhecimento. Muito obrigada por tudo.
A todos os meus colegas e colaboradores do Departamento de Toxicologia da Faculdade de Farmácia da Universidade do Porto, por toda a disponibilidade.
À minha família, por todo o apoio incondicional, por toda a paciência que têm comigo ao longo destes anos, por acreditarem em mim e não me deixarem desanimar.
Ao meu namorado, por todo o apoio ao longo destes anos, por estar presente em todos os momentos, quer sejam eles bons ou maus. Obrigada por toda a paciência, pelo companheirismo e por todo o amor com que me presenteias todos os dias.
V
Às minhas amigas, por estarem sempre presentes, pelos conselhos e pela troca de experiências ao longo destes anos.
A todos os que me acompanharam nesta fase da minha vida, e continuarão a acompanhar no futuro, o meu muito obrigada!
VI Abstract
Aldehyde compounds, and other lipid peroxidation products, have high importance in clinical research since these compounds are present in several biological matrices and can be potential biomarkers for the detection of diseases such as cancer. Cancer is a severe health problem in world, with high levels of morbidity and mortality. Prostate cancer (PCa) is one of the most diagnosed cancer and the second cause of death in men worldwide. Prostate serum antigen (PSA) is frequently used as biomarker for PCa diagnosis, however, this biomarker has limited sensitivity and specificity. The use of metabolites derived from metabolomic approaches offers potential advantages in sensitivity and specificity compared to classical diagnostic methods and other conventional biomarkers used in clinic.
In this work, a gas chromatography-mass spectrometry (GC-MS) based metabolomics approach was used to investigate the performance of volatile carbonyl compounds present in urine of PCa patients as diagnostic markers of this type of cancer.
The carbonyl compounds present in urine samples of PCA patients (n=58) and control individuals (n=58), were previously derivatized using O-(2,3,4,5,6-pentafluorobenzyl) hydroxylamine hydrochloride (PFBHA), followed by extraction and concentration by HS-SPME and analysis by GC/MS analysis. Statistical analysis was performed to search for differences between the two groups, namely multivariate analysis (principal component analysis, PCA and partial least squares-discriminant analysis, PLS-DA) and univariate analysis, aiming to find new possible biomarkers for PCa diagnosis.
Results showed that PCa patients can be differentiated from control individuals based on their urinary carbonyl compounds profile with significantly differences in the levels of several carbonyl compounds. 2-Butanone (p=0.003), 2-pentanone (p=0.0356), cyclohexanone (p=0.0021), hexadecane (p=0.0308), phenylacetaldehyde (p<0.0001) and 3-phenylpropionaldehyde (p<0.0001) were found increased in urine samples of PCa patients compared with control individuals, while 2-butenal (p=0.0040), decanal (p=0.0210), glyoxal (p=0.0342) and methylglyoxal (p=0.0101) were found decreased. These results demonstrated that some aldehydes and other lipid peroxidation products, such as ketones, were able to discriminate between PCa patients and control individuals.
By evaluating the altered metabolites (methylglyoxal and phenylacetaldehyde), in terms of possible dysregulated metabolic pathways, it was possible to advance potential alterations in pyruvate and some amino acid (pyruvate, phenylalanine and serine, glycine and threonine) metabolisms.
VII
Key words: Prostate cancer; Metabolomics; Urine; Carbonyl compounds; Gas chromatography/ Mass spectrometry
VIII Resumo
Os aldeídos e outros produtos de peroxidação lipídica têm elevada importância na investigação clínica devido à sua presença em diversas matrizes biológicas, podendo ser potenciais biomarcadores para a deteção de várias doenças como o cancro. O cancro é um problema sério de saúde mundial, com níveis elevados de morbilidade e mortalidade. O cancro da próstata é um dos mais diagnosticados e a segunda causa de morte nos homens em todo o mundo. Para o diagnóstico do cancro da próstata é frequentemente usado como biomarcador o antigénio específico da próstata (PSA), no entanto, este biomarcador tem sensibilidade e especificidade limitadas. O uso de metabolitos derivados de abordagens metabolómicas oferece vantagens potenciais na sensibilidade e especificidade comparativamente com metodologias clássicas de diagnóstico e outros biomarcadores convencionais usados na clínica.
Neste trabalho foi utilizada uma abordagem metabolómica, baseada na análise por cromatografia gasosa acoplada à espectrometria de massa (GC-MS) para investigar o potencial dos compostos carbonílicos voláteis presentes na urina de pacientes com cancro da próstata, como marcadores de diagnóstico neste tipo de cancro. Os compostos carbonílicos presentes na urina de pacientes com cancro da próstata (n=58) e indivíduos controlo (n=58), foram previamente derivatizados com PFBHA, seguindo-se a extração e concentração por HS-SPME e análise por GC/MS. A análise estatística foi efetuada para procurar possíveis diferenças entre os dois grupos de amostras e foi efetuada usando analise multivariada (análise de componentes principais, PCA e análise discriminante pelo método de mínimos quadrados parciais, PLS-DA), e análise univariada, com o objetivo de descobrir potenciais biomarcadores para diagnóstico de cancro da próstata.
Os resultados mostram que os pacientes com cancro da próstata podem ser distinguidos dos indivíduos controlo com base no perfil urinário de compostos carbonilo com diferenças significativas entre vários compostos carbonílicos. A 2-butanona (p=0.0003), a 2-pentanona (p=0.0356), ciclohexanona (p=0.0021), hexadecano (p=0.0308), fenilacetaldeído (p<0.0001) e o 3-fenilpropionaldeído (p<0.0001) possuem níveis aumentados em amostras de urina de pacientes com cancro da próstata, enquanto que o 2-butenal (p=0.0040), decanal (p=0.0210), glioxal (p=0.0342) e metilglioxal (p=0.0101) estão diminuídos. Estes resultados demonstram que alguns aldeídos e outros produtos de peroxidação lipídica, como as cetonas, têm capacidade de discriminar entre pacientes com cancro da próstata e indivíduos controlo.
IX
Através da avaliação de metabolitos alterados (metilglioxal e fenialcetaldeído) em termos de possíveis desregulações nas vias metabólicas, foi possível avançar alterações potenciais no metabolismo do piruvato e de alguns aminoácidos.
Palavras-chave: Cancro da próstata; Metabolómica; Urina; Compostos carbonilo; Cromatografia gasosa/espectrometria de massa
X General Index
Acknowledgments ... IV Abstract ... VI Resumo ... VIII Abbreviation list ... XII Index of figures ... XIV Index of tables ... XV
Chapter 1. Introduction ... 1
1.1. Prostate Cancer ... 2
1.1.1. Prevalence ... 2
1.1.2. Risk factors and symptoms ... 2
1.1.3. Diagnosis and classification ... 3
1.1.4. Treatment ... 6
1.2. Metabolomics applied to prostate cancer diagnosis ... 7
1.2.1. General strategy ... 7
1.2.2. Principles of gas chromatography coupled to mass spectrometry (GC-MS) 12 1.2.3. Principles of multivariate analysis ...14
1.2.4. Profiling of metabolites present in urine of PCa patients by GC-MS ...17
1.3. Aims ... 23
Chapter 2. Experimental section ...24
2.1. Chemicals ... 25
2.2. Urine samples collection ... 25
2.3. Analysis of carbonyl compounds present in urine by HS-SPME-GC/MS ... 26
2.3.1. Sample preparation ...26
2.3.2. HS-SPME-GC/MS analysis...27
2.4. Statistical analysis ... 27
2.4.1. Multivariate analysis ...27
XI
2.4.3. Quantification of carbonyl compounds in urine samples ...29
Chapter 3. Results and discussion ...30
3.1. GC-MS profiling of carbonyl compounds present in urine from healthy individuals and prostate cancer patients ... 31
3.2. Prostate cancer biomarker discovery based on the untargeted analysis of carbonyl compounds in urine ... 31
3.3. Prostate cancer biomarker discovery based on targeted analysis of carbonyl compounds in urine ... 43
3.4. Discussion... 47
Chapter 4. Conclusions ...52
References ...54
XII Abbreviation list
ADT Androgen deprivation therapy ANOVA Analysis of variance
AR Androgen receptor
ATP Adenosine triphosphate
AUC Area under the curve
BPH Benign prostatic hyperplasia BLOQ Below limit of quantification
CAS number Chemical abstracts service number CRPC Castration-resistant prostate cancer
CR Classification rate
DI-SPME Direct injection- solid phase microextraction
DNA Deoxyribonucleic acid
DRE Digital rectal examination EDCs Endocrine disrupting chemicals
EI Electron impact
FDA Food and drug administration
FT-ICR-MS Fourier transform- ion cyclotron resonance-gas chromatography
GC-MS Gas chromatography/mass spectrometry
GS Gleason score
HC Healthy control
HMDB Human metabolome database
HS-SPME/GC-MS Headspace solid-phase microextraction/gas chromatography-mass spectrometry
IS Internal standard
IUPAC International union of pure and applied chemistry
KI Kovats indices
LC-MS Liquid chromatography/mass spectrometry LDA Linear discriminant analysis
Max Maximum
mCRPC Metastatic castration-resistant prostate cancer MetPa MetaboAnalyst pathway analysis
Min Minimum
XIII
m/z Mass to charge
NA Not available
NEM No evidence of malignancy
NIST National institute of standards and technology
NMR Nuclear magnetic resonance
NS Not specified
OPLS Orthogonal partial least squares
Par Pareto
PCa Prostate cancer
PCA Principal component analysis
PDMS/DVB Polydimethylsiloxane/divinylbenzene
PFBHA O-(2,3,4,5,6-pentafluorobenzyl) hydroxylamine hydrochloride PLS-DA Partial least squares-discriminant analysis
PSA Prostate serum antigen
QCs Quality control samples
RF Random forest
ROC Receiver operatoring characteristic
ROS Reactive oxygen species
RSD Relative standard deviation
RT Retention time
Sens. Sensitivity
SD Standard deviation
Spec. Specificity
SREs Skeletal-related events
TCA Tricarboxylic acid
TNM Primary tumor, regional lymph nodes, distant metastasis
UV Unit variance
VIP Variable importance to the projection VOCs Volatile organic compounds
XIV Index of figures
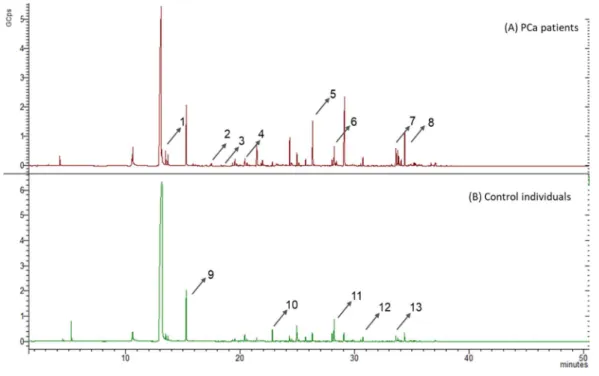
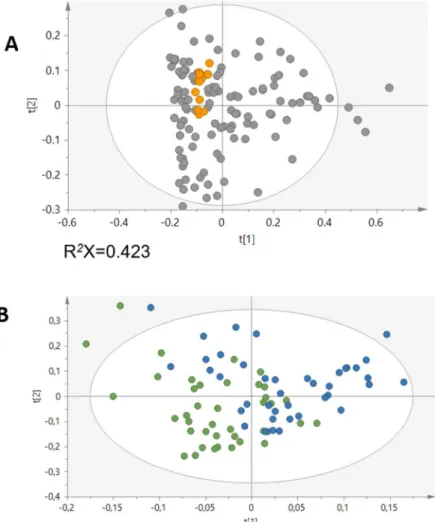
Figure 1. From genomics to metabolomics: representation of the four “omics” . ... 8 Figure 2. The untargeted and target metabolomic workflows. ... 9 Figure 3. Workflow of HS-SPME/GC-MS ... 14 Figure 4. PCA model results in the projection of the data on a low dimension model plane . ... 15 Figure 5. PLS-DA of two sample groups well separated . ... 16 Figure 6. Representative HS-SPME-GC-MS chromatograms of urine from (A) PCa patients and (B) control individuals, after derivatization with PFBHA.. ... 31 Figure 7. (A) PCA scores plot obtained for the urinary carbonyl compounds profile of QCs (orange) and PCa and controls (grey). (B) PLS-DA scores plot obtained for the urinary carbonyl compounds profile of PCa patients (blue, n=40) and controls (green, n=40), before variable selection. ... 32 Figure 8. (A) PCA and (B) PLS-DA scores plot obtained for the urinary carbonyl compounds profile of PCa (blue, n=40) and controls (green, n=40), after variable selection. ... 33 Figure 9. Permutation plot obtained for PLS-DA model of the urinary carbonyl compounds profile, after variable selection (200 random permutations of Y-observations).. ... 34 Figure 10. ROC curves obtained for the statistically significant altered carbonyl compounds, namely 2-butanone (blue), cyclohexanone (black), 3-phenylpropionaldehyde (orange) and phenylacetaldehyde (green). ... 39 Figure 11. Boxplots of the significantly increased metabolites between PCa patients and controls.. ... 40 Figure 12. Boxplots of the significantly decreased metabolites between PCa patients and controls.. ... 41 Figure 13. Heatmap with correlations between the significantly compounds that discriminate between PCa patients and controls. . ... 42 Figure 14. Calibration curves obtained for 2-butanone, 2-butenal, cyclohexanone, phenylacetaldehyde, glyoxal and methylglyoxal. ... 44 Figure 15. Calibration curves obtained for 2-butanone, glyoxal and methylglyoxal. ... 45 Figure 16. Potentially altered metabolic pathways related with compounds found significantly different in urine from PCa patients compared with control individuals. ... 51
XV Index of tables
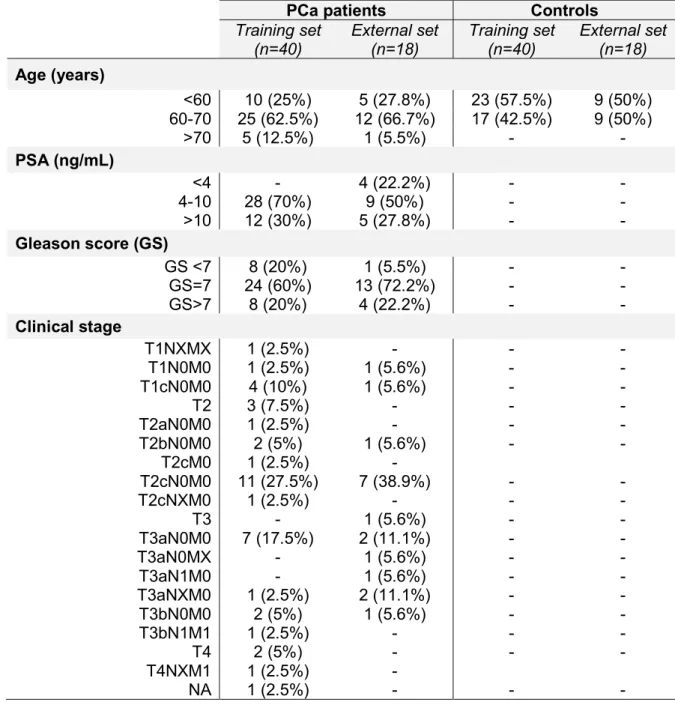
Table 1. TNM scores. ... 5 Table 2. Advantages and disadvantages of analytical techniques used in metabolomics. ... 11 Table 3. Metabolomics studies of PCa performed in urine samples by GC-MS. ... 21 Table 4. Characteristics of PCa patients and control individuals divided into training and external sets. ... 26 Table 5. List of metabolites with VIP >1 selected in the PLS-DA model obtained for the urinary profile of PCa patients and control individuals, after variable selection. ... 35 Table 6. Statistically significant discriminant metabolites present in urine of PCa patients and control individuals. ... 38 Table 7. Results obtained from the external validation set ... 43 Table 8. Concentrations (ng/mL) of the discriminant carbonyl compounds, for which standards are commercially available, found in urine of PCa patients (n=40) and control individuals (n=40). ... 46 Table 9. HMDB information obtained for the set of significantly altered metabolites found in urine from PCa patients compared with control individuals. ... 48 Table S1. All metabolites tentatively identified in chromatograms obtained by GC-MS….67
1
2 1.1. Prostate Cancer
1.1.1. Prevalence
Cancer is one of the most public health problems worldwide and a leading cause of death economically developed and undeveloped countries 1,2. In 2012, 14.1 million new cancer cases and 8.2 million cancer deaths occurred worldwide 1. Cancer is responsible for an estimated 9.6 million deaths in 2018. In Europe, cancer is the second cause of death and morbidity, with more than 3.7 million new cases and 1.9 million deaths each year 3. In 2010, about 50.000 new cases were diagnosed in Portugal 4.
Prostate cancer (PCa) is the second most common cancer in men 5, diagnosed in 29% of all cases among men in Europe and America 6. In Portugal, PCa is the most diagnosed cancer in men with 6080 new cases in 2010, corresponding to 23.7% of all cancer diagnosed in men 4. In 2018, 164.690 new cases and 29.430 deaths were predicted in USA7. PCa is a slow growing cancer that affects men over 50 years old and is still a lethal disease 6. Due to its slow growing nature and long latency period, this type of cancer is an important candidate for screening, for an early detection and characterization 6,8. It is estimated that 25% of men diagnosed with PCa developed metastasis, mainly in bones and lymph nodes 8–10. Hence, PCa patients can suffer complications related with bones, which are the most common site of metastasis in advanced cancer. The loss of bone mineral density is a consequence of androgen deprivation therapy and consequently has an increased incidence of osteoporotic fractures. The bone metastases can induce several complications such as pain, and the potential for skeletal events like spinal cord compression and pathological fractures. These clinical situations can be a point of therapeutic intervention for prevention of skeletal morbidity and mortality 11.
The incidence of PCa differs among regions, with the highest in Australia/New Zealand, Northern America and Western and Northern Europe, and the lowest in South-Central Asia. This variation is strongly related to the use of the prostate-specific antigen (PSA) test as a screening tool and subsequent biopsy in these regions. After the introduction of PSA test, the PCa incidence increased significantly in European countries such as France and Czech Republic 5,12. The mortality rate is generally higher in populations of African descent, intermediate in the Americas and Oceania and very low in Asia 5.
1.1.2. Risk factors and symptoms
The development of PCa can be influenced by several factors such as advanced age (>50 years), oxidative stress, race, family history of the disease and genetics 13. PCa can result from an increase in oxidative stress and hence the intake of antioxidants can
3
offers protection against this type of cancer. The differences in PCa risk according to race can be associated with the diet, diagnostic and genetic differences, since the incidence of PCa is higher in African-American men. In addition, the altered androgen metabolism and elevated concentrations of testosterone can significantly change the PCa growth rates 14. In the last years, researchers have investigated other risk factors that include exogenous sources, such as the exposure to chemicals and radiation, diet, alcohol consumption, sexual activity, body size and body mass index 15. Endocrine disrupting chemicals (EDCs) have received attention since they can alter positively or negatively the hormone activity and lead to the development of carcinogenesis. Some pesticide residues on foods and chemicals used in plastic production behave as EDCs 14. Other study evidenced that consumption of red meat, dietary fat and milk intake can increase the potential of developing PCa, whereas the ingestion of fruit, vegetables and polyphenols can be preventive 16.
Cancer cells also have the capacity to escape from prostate tumor (primary), invading lymphatic and blood vessels, travelling in the circulation to distant sites (bones) and proliferate in the bone environment (osteoclasts and osteoblasts, which maintain bone integrity). These steps are regulated by tumor cells with help of non-cancerous cells 17. Osteoclasts and osteoblasts, together with endothelial, mesenchymal stem, adipocytes and reticular cells, can interact with cancer cells and transform the normal microenvironment to a metastatic microenvironment 11,18.
Several symptoms such as weak or interrupted flow of urine, sudden and frequent urination, trouble starting the flow of urine, pain or burning while urinating, blood in urine or semen, shortness of breath, tiredness, fast heartbeat and dizziness are associated with PCa, however, are not specific. Other diseases in the prostate such as benign prostatic hyperplasia (BPH) cause similar symptoms to PCa 19.
1.1.3. Diagnosis and classification
For PCa diagnosis, the most used screening techniques are the quantification of PSA and the digital rectal examination (DRE). However, a prostate biopsy procedure is always necessary for a final diagnosis 8.
PSA is the most used marker for PCa screening and follow-up, nevertheless, some limitations are recognized such as low sensitivity and specificity 6,9. PSA levels higher than 4.0 ng/mL are an indication of PCa, though some PCa patients may present a PSA level below 4.0 ng/mL, since PSA can be affected by other medical conditions such as urinary tract infection, BPH and prostatitis. Hence, PSA blood screening has some issues since it can be detected in 30-50% of the cases of BPH and only 25% are associated with PCa,
4
when PSA levels are increased 9. Other factors can affect PSA levels such as differences in androgen levels, prostate manipulation or ejaculation. In addition, sample handling, laboratory processing and assay standardization can affect the PSA measurements 20. Screening of PSA has contributed to decrease PCa mortality in many countries, but false negative results are also common, as no reliable cut-off value exists for PSA to diagnose PCa 21,22. The discovery of new and more precise biomarkers for PCa detection is very important, as well as the identification of patients which can develop aggressive tumor and need immediate treatment 6. Other parameters can be taken into account to characterize PCa with some accuracy, such as age (PSA levels increase with age), free versus total PSA, PSA velocity, the doubling time (period of time necessary to duplicate PSA concentration), pro-PSA (distinct molecular form of free PSA in serum 23) and PSA density of the transition zone 9.
The definitive PCa diagnosis is done by prostate biopsy. The necessity of prostate biopsy is defined by PSA level, DRE result, patient age, potential comorbidities and therapeutic consequences, according to the European Association of Urology guidelines 24. However, the biopsy analysis also provides false-negative results due to several factors, such as small tumor, heterogenous distribution of cancer cells and early stage 8,20. Therefore, it can be necessary to repeat prostate biopsy if PSA levels increase or are persistently elevated, the DRE result are dubious and the presence of an atypical small acinar proliferation of a previous biopsy 20.
Gleason score is the most common method used for classifying PCa. The biopsy from a prostate with suspicious of cancer is analyzed and classified in a grade from one to five, where a higher grade indicates more aggressiveness. The Gleason score is calculated with the sum of most and the second most predominant Gleason grades within the prostate tissue section, and it extends from two to ten 25. At Gleason scores ranging from 2 to 6, cancer usually grows and spreads slowly, and several years can pass before being a problem. At Gleason score of 7, cancer grows and spreads more quickly, and treatment is necessary to prevent complications. At Gleason scores between 8 to 10, cancer grows and spreads quickly and treatment is needed immediately 26. One of the most important prognostic tools in cancer treatment planning is the use of Gleason score, though it is dependent on subjective factors in the evaluation of the aggressiveness and limited by biopsy under-sampling, which can lead to underestimation. Hence, other tools are usually necessary to evaluate the cancer aggressiveness 27, such as the classification of malignant tumor (TNM) scores that describe different location of cancer growth and are important for treatment planning 26. These TNM scores are described below in Table 1.
5 Table 1. TNM scores (adapted from 19,24,26).
T Primary tumor
TX Primary tumor not evaluable T0 No evidence of primary tumor
T1 Tumor clinically imperceptible, non-palpable or visible through image
T1a Tumor due to incidental histological finding in 5% or less of the resected tissue
T1b Tumor due to incidental histological finding in more than 5% of the resected tissue
T1c Tumor found by biopsy (high levels of PSA) T2 Tumor confined to prostate
T2a Tumor affects one-half or less of one lobe of the prostate T2b Tumor affects more than one-half of one lobe
T2c Tumor affects both lobes
T3 Tumor extends through the prostatic capsule T3a Extracapsular extension (unilateral and bilateral) T3b Tumor extends to seminal vesicles
T4 Tumor has spread from the seminal vesicles to tissue or organs (external sphincter, rectum, levator muscles, and/or pelvic wall)
N Regional lymph nodes
NX Regional lymph nodes not evaluable N0 No metastasis in regional lymph nodes N1 Metastasis in regional lymph nodes
M Distant metastasis
MX Distant metastasis not evaluable M0 No distant metastasis
M1 Distant metastasis
M1a No-regional lymph node(s) M1b Bone(s)
M1c Other locations
6 1.1.4. Treatment
PCa treatment depends on the stage of the disease 28. The healing treatment is based on surgery and radiation therapy and sometimes on cryosurgery. When PCa achieves advanced stages, hormonal therapy and chemotherapy are used, though combined therapies can be implemented such as hormonal therapy and radiation therapy 9. Part of the patients with localized tumor fail in local therapy and disease progresses to an advanced or metastatic stage in 10 years 29. In these cases, androgen deprivation therapy (ADT) is often used to decrease circulating testosterone levels by surgical or chemical castration 30. Most patients develop a highly morbid state of PCa, castration-resistant PCa (CRPC), with skeletal-related events (SREs) such as bone pain, fractures, spinal cord compression and vertebral collapse 28,30. Most patients initially resist, but the tumor gains resistance to primary hormonal therapy in 14-30 months, and the median survival in phase III studies of patients with metastatic CRPC (mCRPC) is 15 to 19 months 29. For many years, the only treatment for mCRPC was the chemotherapeutic drug docetaxel, with a low survival rate (2-3 months). Nowadays, new therapies focused in the androgen signaling pathway, immunotherapeutic options and radium-223 treatment have improved the patient survival rate and the quality of life 29.
Alpha therapy with radium-223 dichloride has proven to be beneficial for mCRPC treatment with symptomatic bone metastases and was approved by the Food and Drug Administration (FDA) in 2013. This therapy is administered intravenously, mimics calcium and is selectively absorbed in osteoblastic bone metastases, binding to hydroxyapatite, a major component of the bone. Radium-223 dichloride induces T cell-mediated lysis, which combined with immunotherapy treatments can increase the clinical benefit 31.
The combination of androgen suppression with external irradiation was the standard treatment of locally advanced PCa with high level of evidence. The use of androgen suppression improves the outcome of external irradiation and these two therapies have an addictive effect on local control by induction of apoptosis 10.
Radiotherapy induces lethal DNA damage that leads to cancer cell death and apoptosis. More effects of radiotherapy include inflammation in the cancer microenvironment, sub-lethal damage in cancer cells, changes in the tumor vasculature and activation of immune cells 32.
Chemotherapy is also used for PCa treatment. Several drugs have already been used, for example, docetaxel and cabazitaxel, approved by the FDA for mCRPC in 2004 and 2010, respectively. These drugs are administered intravenously every three weeks with the aim of preventing tubulin depolymerization and consequently the mitotic cell division. Mitoxantrone is also used but has a limited survival benefit in patients compared with
7
docetaxel. This drug relieves symptoms, but its use is limited due to significant adverse events 30.
Testosterone can stimulate cancer prostate cells proliferation, because is transformed into an active form (dihydrotestosterone). These two forms have affinity to androgen receptor in the cytoplasm, creating a complex that enters in cell nucleus and binds to DNA sequences responsible for growth, proliferation and metabolism of cancer cells 33. Due to this capacity, testosterone suppression (castration) is used for PCa treatment 28. Several drugs (abiraterone acetate and enzalutamine) have demonstrated potential to decrease androgen receptor (AR) signalling 34. Abiraterone acetate is an inhibitor of CYP17A1 of cytochrome P450, approved by the FDA in 2011 for late-stage CRPC patients. This drug block androgen production in the testis, adrenal glands and prostate tumors, preventing cancer growth 30. Enzalutamide was approved by FDA in 2012 for mCRPC post treatment and in 2014 for pre-docetaxel therapy, respectively 30. Also, Sipuleucel-T was approved by the FDA for the mCRPC asymptomatic treatment and consists on the use of patients own immune cells 34. This therapy consists in collecting antigen-presenting cells from the patient which are activated ex vivo, with the aim of increasing the immune recognition of the tumor being subsequently re-infused into the patient organism 32. The activation of immune cells induces an immune response that destroys PCa cells 29.
1.2. Metabolomics applied to prostate cancer diagnosis 1.2.1. General strategy
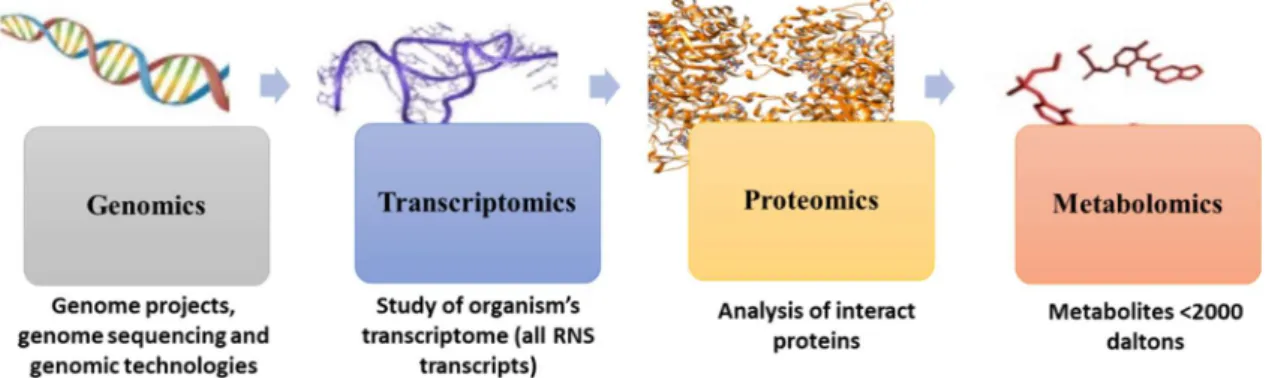
The decoding of human and other genomes revolutionized many research areas, allowing the simultaneous mapping of changes in multiple genes (genome), transcripts (transcriptome), proteins (proteome) or metabolites (metabolome) (Figure 1). These “omics” technologies are important tools for interpreting and understanding the complex biological processes. They have the ability to measure alterations in several entities, providing an overview of different physiological or pathological conditions 35,36. Metabolomics, defined as the comprehensive analysis of all metabolites (metabolome) of an organism, cell system, tissue or biological fluid, appeared later, dating from 1990s to early 2000s, but has gained scientific relevance with an increase in the number of publications. In addition, the improvement in the analytical techniques and data treatment methods has contributed to the implementation of metabolomic experiments 37.
8
Figure 1. From genomics to metabolomics: representation of the four “omics” (adapted from 37,38).
Metabolomics has contributing to a better understanding of cancer metabolism using several analytical techniques to evaluate the metabolite levels in biological samples of healthy individuals and cancer patients. This is a powerful tool to recognize metabolic alterations in biological samples, giving semi-quantitative and quantitative information about the abundance of intermediates from several metabolic pathways and an overview of the deviations in the metabolic networks related with the disease 39. The application of metabolomics covers several areas of research, such as disease diagnosis, drug discovery and development, pharmacometabolomics, nutrigenomics, metabolic engineering/biotechnology, functional genomics and proteomics, toxicometabolomics and taxonomy 37. Metabolomics offers a more comprehensive assessment of patient´s status than the measure of single metabolites due to ability to cover the metabolome. This capability makes metabolomics a powerful instrument for the identification, quantification and development of potential biomarkers 40. Other advantage of metabolomics is related to the size/weight of such molecules (metabolites) which can be distributed all over the body in contrast with proteins and nucleic acids that are not secreted into biofluids (non-invasive collection and easy to work) such as urine. Also, metabolites have the same basic chemical structure independent of the organism and hence the same methods can be used 37. However, metabolomics has some limitations associated to the study design that decreases the applicability to system biology studies and the validation of new biomarkers, namely the lack of consistency of sample collection and handling protocols, data analysis and integration, patients heterogeneity and the small cohorts studied 37,38. Despite all difficulties to obtain relevant and reliable results, metabolomic has still great potential for discovery of new cancer biomarkers.
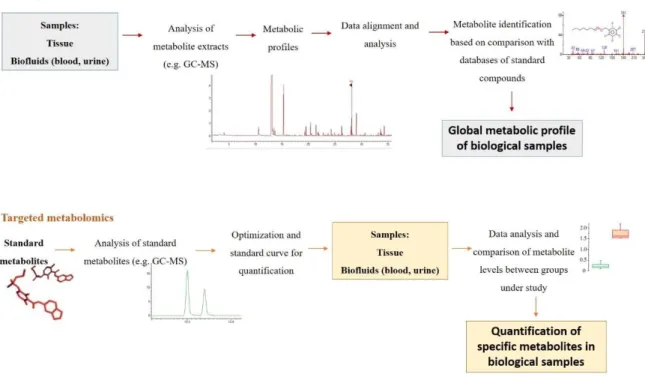
The metabolomics studies can use two different approaches, an untargeted and a targeted approach (Figure 2). Untargeted metabolomics consists in the simultaneous analysis of a wide range of metabolites in a biological sample 38,41. For the detection of
9
hundreds and thousands of metabolites in one analysis, it is mandatory to develop and standardize methodologies for sample collection, preparation and analysis. The precision and accuracy are lower than for the targeted approach, however is enough for the purpose, and the semi-quantitative data is used to search for differences in the levels of metabolites 42. The targeted approach is focused in a number of metabolites related in function or class, normally less than 20, and provides quantitative concentrations with high levels of specificity, precision and accuracy 42. This approach is used to confirm hypothesis and measure the concentration of the metabolites under study (e.g., amino acids, hormones, lipids or carbohydrates) 37, using sample preparation methodologies to separate the specific metabolites from all metabolites in a sample 42.
Figure 2. The untargeted and target metabolomic workflows (adapted from 43).
Several factors, usually called “confounding factors”, such as age, diet, gender, diurnal changes, lifestyle and consumed drugs can affect the human metabolome 44. It is fundamental to control all these factors and obtain all information about individuals enrolled in the studies. In addition, the existence of a matched control-group is essential to give reliable results to be used for diagnostic purposes 45. During experimental design, all these aspects should be considered in order to ensure limited interferences in the results, thus avoiding the overlap with the metabolomic alterations caused by a pathology and other condition in study 46.
10
The metabolomic analysis of biological samples has been performed using different analytical techniques, such as nuclear magnetic resonance (NMR) spectroscopy, liquid chromatography coupled to mass spectrometry (LC-MS) and gas chromatography coupled with mass spectrometry (GC-MS). These analytical techniques have advantages and limitations including differences in sensitivity, reproducibility and analysis costs. The choice of the analytical technique depends on the aim of the analysis, the nature of samples and compounds under investigation 37.
Considering NMR, energy levels of the nuclear spin are excited by a radiofrequency (RF) pulse in a magnetic field. Different individual signals and signal combinations correspond to a unique metabolite. In a biological sample, composed by hundreds of metabolites, the different patterns of energy are represented as peaks in a spectrum and the area of the peaks is indicative of the relative concentration of each metabolite 21. Unlike NMR, MS allow to detect metabolites that exist at low concentrations because this technique has much higher sensitivity. The MS allow the identification of metabolites based on their ionization and fragmentation. Each metabolite has a specific fragmentation pattern and different characteristic fragments will be formed and separated accordingly to their mass-to-charge ratio (m/z) 37.The disadvantages of MS-based techniques are related with the sample preparation, that is more complex than for NMR, and the necessity of using more laborious sample preparation protocols (e.g., a derivatization procedure for GC-MS analysis) 21,35. The NMR, LC-MS and GC-MS advantages and disadvantages are described in the table below (Table 2).
Before statistical data treatment, pre-processing is required due to the large and complex datasets generated by MS-based techniques. This step is essential to transform the raw data into a format that can be correctly analysed to minimize the variations in data, such as background, noise and retention time fluctuations. The pre-processing steps usually applied to MS-based techniques are filtering, peak detection, deconvolution, alignment, normalization and scaling. Filtering is used to remove random noise and baseline in the raw data. Peak detection allows the identification of all individual components (m/z ions). Deconvolution is applied to separate two or more co-eluting peaks. Chromatogram alignment consists in the correction of deviations in peak retention times 49. Normalization consists in minimizing differences associated with sample dilution and/or experimental fluctuations, thus allowing the comparison between samples. Scaling strategies can be used to compensate the high dynamic range in metabolite concentration that can interfere in statistical models 50. The most common used scaling method is unit variance (UV), where all peaks are similarly weighted becoming equally important for class discrimination. Mean centering is other scaling strategy, that preserve the original spectra structure, though the
11
metabolites with higher concentrations are emphasized. Pareto scaling is the best strategy for MS-based techniques, reducing the relative importance of more concentrated metabolites 51. After these pre-processing steps, all spectral information will be transformed in a matrix containing the m/z/RT pairs and their respective area for each sample 46.
Table 2. Advantages and disadvantages of analytical techniques used in metabolomics (adapted from35,47,48).
Technique Advantages Disadvantages
NMR - Simple sample preparation - High reproducibility and accuracy - Quantitative
- Identification of unknown metabolites
- Rapid and automated - Non-destructive
- Low sensitivity
- High instrumental cost - Needs skilled technicians
LC-MS - Minimal sample preparation - No limitation in the molecular weight of the analytes
- Analysis of thermolabile molecules
- Destructive
- Instrumental cost higher than GC-MS
- Long acquisition time - High solvent consumption - Suffers ion suppression GC-MS - High sensitivity, robustness and
reproducibility
- Compound identification through databases
- Relatively low cost
- Multiple options for sample preparation
- Destructive
- Limited to volatile and/or volatilizable compounds - Long acquisition time
12
One of the main challenges in metabolomics is the high complex datasets generated from biological samples leading to the use of methodologies based on multivariate analysis 52. These methodologies are based on projection methods offering a number of efficient and useful methods for analysis of these complex datasets 53. There are two types of multivariate analysis techniques, non-supervised and supervised. The two methods most routinely applied are principal component analysis (PCA) and partial least squares discriminant analysis (PLS-DA), corresponding to non-supervised and supervised techniques, respectively 54.
After multivariate analysis, it is important to confirm the relevance of metabolites for the separation between samples using univariate approaches 55,56. To evaluate the significance of potential biomarkers, univariate statistical methods are usually used, such as Student’s t-test and ANOVA, for normally distributed data, and Wilcoxon Rank Sum test for non-normally distributed data 57. However, hypothesis lack information about the overlap, direction or specificity of the alteration, unlike the effect size, which is independent of the number of hypothesis tested, giving information about the direction and magnitude of the alteration 58,59. Hence, univariate methods are have been used to test the individual statistical significance of potential biomarkers. The sensitivity and specificity of potential biomarkers are also important steps of univariate analysis and are usually computed through the receiver operating characteristic (ROC) curve. The specificity refers to the percentage of controls correctly classified by the model as non-cancer samples and the sensitivity refers to the percentage of cancer samples correctly classified by the model as cancer 55,56.
1.2.2. Principles of gas chromatography coupled to mass spectrometry (GC-MS)
GC-MS is a robust and very widely used analytical technique, with high sensitivity and specificity for analysis of several compounds such as hydrocarbons, essentials oils and organic acids 60.This technique is a powerful tool for semi-quantification and quantification of metabolites, enabling the separation of volatile and semi-volatile compounds in the GC stationary phase and the analysis of each separated compound by MS 48,61. When the MS is operating in full-scan mode, it is possible to use spectral mass libraries, for example the National Institute of Standards and Technology (NIST), to help the identification of compounds eluted from the GC-column 61,62. The main advantages of GC-MS are the high sensitivity, easy metabolite identification (mass libraries available), relatively cheap and allows multiple options for sample preparation. However, GC-MS has some disadvantages,
13
being limited to the analysis of volatile and thermally stable compounds weighing less than 1000 Da 48. Nevertheless, derivatization procedures can be applied to allow the analysis of the majority of metabolites in a given metabolome, including polar molecules (acids, amines and sugars), higher molecular weight compounds and even non-thermolabile molecules 37. For instance, the reactivity of the carbonyl group leads to the development of derivatization methods for detection and quantification of minor aldehydes 63. In the derivatization process, aliphatic aldehydes react with a derivative compound (e.g. O-(2,3,4,5,6-pentafluorobenzyl) hydroxylamine hydrochloride - PFBHA) producing stable and volatile oximes, which are ready for GC analysis 64,65. The oximes formed exhibit excellent chromatographic properties, specific mass spectra and it is possible to use detectors such as electron capture, thermionic or mass spectrometers 63,66. The derivatization can decrease polarity and increase volatility, improve chromatographic resolution and increase the thermal stability of compounds. However, the derivatization procedure has some issues, such as the increase of analysis time, increase the probability of losing the metabolites and can also lead to a complex chromatogram which can make the identification of metabolites more difficult, since each compound after derivatization corresponds to two enantiomer oximes 37.
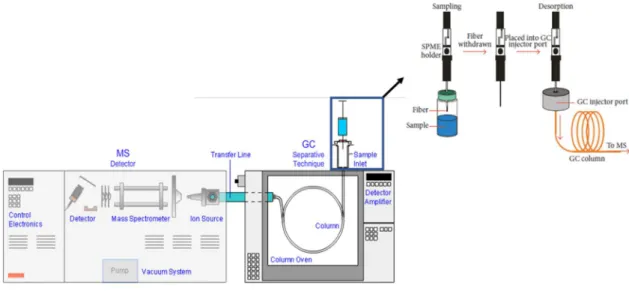
One of the most used sample preparation techniques for detection of volatile compounds by GC-MS is solid-phase microextraction (SPME) (Figure 3). This method was developed in 1990s by Pawliszyn 67 and combines four steps in just one: sampling, extraction, pre-concentration and sample injection 68. The procedure consists in a fused-silica fiber covered with a thin organic film (polydimethyl siloxane) of stationary phase, attached to the base of a syringe with a metal needle which can be extended or retracted inside the needle. The fiber can be exposed directly in the sample matrix (DI-SPME) or in the headspace (HS-SPME) for a predetermined time in order to extract the analytes present in the sample into the fiber 60,69. After extraction, the fiber is removed from the sample and inserted into the gas chromatograph injector which is programmed to a high temperature to completely desorb the analytes. The desorbed analytes are separated in the GC column and detected in the MS analyzer 70. Different types of fibers are commercially available, and their choice is usually made according to the molecular weight and polarity of the analytes in study. In headspace sampling-solid phase microextraction (HS-SPME), the sample is placed in a vial which is heated, and the volatile compounds pass to vapor phase. After the partition of the analytes between sample (liquid) and gas phase, the compounds adsorbed into the fiber are injected in the gas chromatograph 60. This technique allows the analysis of complex matrices without the interference of non-volatile compounds 71. In addition, it is easy, fast, solvent free, economic, reusable and very versatile, allowing the automatization
14
in any chromatographic system 72. SPME has been used for analysis of aldehydes and ketones present in water and other aqueous matrices, since this method enables the extraction and pre-concentration of volatile compounds without the interference of water 73.
Figure 3. Workflow of HS-SPME/GC-MS (adapted from 65).
In GC-MS system, the sample is injected in a current of an inert gaseous mobile phase (He, Ar or N2). The sample is then transported through a capillary column where the components of the sample are separated based on their chemical affinity to the stationary phase 74. After separation in the GC system, the analytes are transported to the detector to be ionized and detected. The detector should have low detection limits, a linear response, must be selective for a class of solutes and be insensitive to changes in flow rates or temperature 60. First, the compounds enter in a source of ionization (based on the physical and chemical properties of the analytes) and break their chemical bonds into several ionized fragments. These fragments go through the mass analyzer, which selects the ions according to their mass-to-charge ratio (m/z) values. The separated ions are analyzed and an electric signal is produced (intensity vs m/z) 62,75.
1.2.3. Principles of multivariate analysis
As mentioned above, one of the principal challenges in metabolomics is the large volume of data leading to the use of complex multivariate analysis techniques 52. In metabolomics, what differentiate two classes (e.g. disease vs healthy) is a group of
15
variables rather than one variable. Hence, multivariate analysis is the elected statistical technique to observe differences among individuals 76.
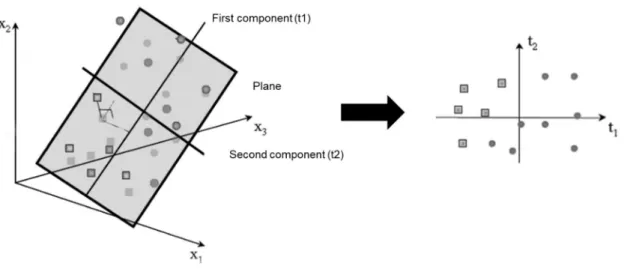
There are two types of multivariate analysis techniques, unsupervised and supervised methods, as mentioned before. The unsupervised methods are commonly the first step in data analysis without using knowledge of class membership. PCA is the most frequent unsupervised method used (Figure 4), consisting in an algorithm that reduces the high-dimensional data to a small number of dimensions, thus explaining the maximum possible variance between data 52. The unsupervised methods have been substantially used in several studies, namely to find new metabolite markers for diseases 77. PCA has been applied to MS-based datasets to reduce data complexity as well as visualize grouping trends and outliers and provides an overview of all samples in the study 53.
Figure 4. PCA model results in the projection of the data on a low dimension model plane (adapted from 53).
Supervised methods are used to increase the separation between classes and identify the strongest biomarkers. These methods use information of class membership and can develop classifiers and predicting where a sample falls relatively to samples already classified. These methods, such as partial least squares (PLS) and orthogonal PLS (OPLS), use the class information of the training set to improve the separation between two or more sample classes 78. DA is the most commonly used supervised method (Figure 5). PLS-DA defines a surface in n-dimensional space that separates data in classes 52.
16
Figure 5. PLS-DA of two sample groups well separated (adapted from 79).
The comprehension of PCA and PLS-DA models is easier by the scores scatter plot which maps the spectra onto the two principal components based on the metabolic profile of samples, observing if there are groupings, trends or outliers. The corresponding loadings plot describes the influence of the variables in the model plane for these two principal components 56. The metabolites that contribute most to the variation between the two groups are ascribed through the loadings plot and variable importance of projection (VIP). When VIP is higher than one in the model, the metabolite is considered relevant for discrimination between classes and pointed as potential biomarker 76. To prevent false discoveries and the risk of overfitting, the validation of the training set is necessary through cross-validation or permutation tests, that guarantee the generalization capability of the constructed models 77. The permutation test can evaluate if the specific classification of the individuals into two groups is significantly better than any other random classification and consists in the multiple random rearrangements of the class labels of case and control. This test is also used to evaluate validation procedures such as cross validation 79. The cross validation is used for validation of a classification model due to the low number of samples. The results of this validation test are summarized by the value of different parameters such as R2, which measures the goodness of fit, and Q2 that measures the predictive ability of the model. R2=1 and Q2=1 indicate perfect description of the data by the model and perfect predictability, respectively 80.
The statistical methods used in metabolomics also include univariate analysis. However, the univariate analysis evaluates the statistical significance of each peak individually and focus only on the mean and the variance of one variable, while the
17
multivariate combines multiple variables 77, using mean, co-variances and correlations which reflect the extent of the relations among variables 54.
1.2.4. Profiling of metabolites present in urine of PCa patients by GC-MS
Carbonyl compounds have high importance in clinical research since these compounds are present in several biological matrices and can be important biomarkers for the detection of diseases such as cancer. Carbonyl compounds contain a carbon atom double-bonded to an oxygen (C=O) and can be classified into three main categories: aldehydes, ketones, carboxylic acids and respective derivatives 81. Changes in intracellular metabolite concentrations have been detected as a result of the altered metabolism of cancer cells. For instance, altered levels of aldehydes and ketones have been associated to genetic mutations and cancer modification in protein expression, leading to cancer initiation and progression 82. Aldehydes and ketones can also be intermediary or final products of oxidative stress and glycation 83, and their presence in the cell is often linked to an increase of oxidative stress 84, which can be defined as an imbalance in the production of free radicals and reactive oxygen species (ROS) and their elimination by antioxidants 85. Moreover, ROS can cause lipid peroxidation, leading to the oxidative degradation of lipid membranes and resulting in the formation of over 200 types of highly reactive and extremely toxic aldehydes 86.
Aldehydes, ketones and other volatile organic compounds (VOCs) have been recognized as potential cancer biomarkers of several types of cancers, mainly lung cancer, among others such as breast and bladder cancer 87–89. Thus, these small molecules produced in the human body during metabolic processes have gained greater interest in the last years 90. Using GC-MS and other analytical techniques, several carbonyl compounds (e.g., aldehydes and ketones) have been identified as candidates to cancer-specific substances in urine, tissue, exhaled breath and blood 91.
Several biological samples, such as blood, urine, tissue and semen have been used in metabolomic studies of PCa 92,93. Blood is an important sample because it is rich in proteins, potential biomarkers for PCa detection and prognosis. Semen gives information directly from the prostate, however it has high variability 8. The best source of PCa specific biomarkers may be prostate tissue, however it is the most invasive and expensive sample and can cause bleeding or infections 94. Urine has been the most investigated biological sample for the PCa evaluation. This sample is composed by blood wastes, providing information from distant organs, and not only from kidney and urinary tracts, having several advantages such as non-invasive and inexpensive collection, easy to handle and available
18
in large amounts 6,95. Nevertheless, urine has some disadvantages such as low concentrations of metabolites and high variability among patients due to age, hormonal status, diet, among other factors 94.
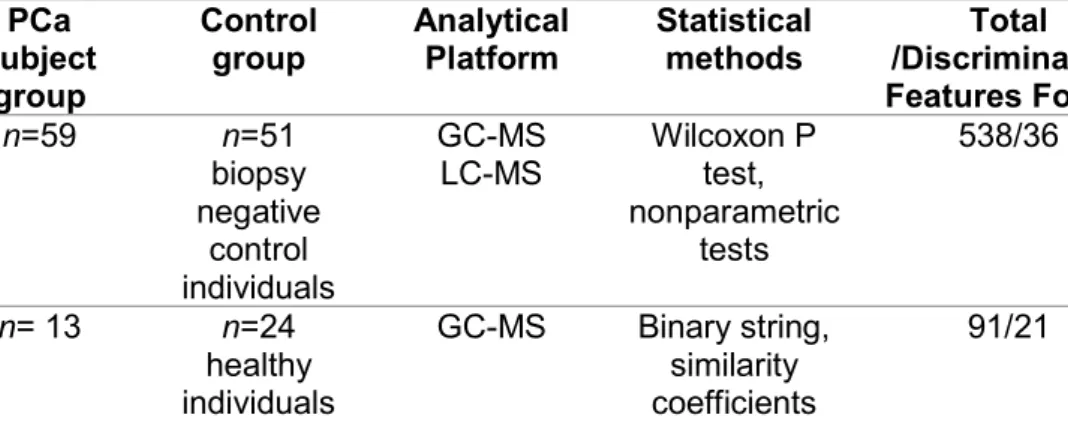
Several metabolomic studies focused in the discovery of new urinary biomarkers of PCa have been already perform 93,96–98, as described in table 3. Sreekumar et al. 93 performed a metabolomic study on urine samples from biopsy positive cancer patients (n=59) and biopsy-negative control individuals (n=51), by LC-MS and GC-MS. In urine, from 583 metabolites, 36 were found altered (p<0.05) between biopsy-positive and negative individuals. Sarcosine, an N-methyl derivative of the amino acid glycine, was found as a discriminative metabolite due to its highly increased levels during prostate cancer progression to metastasis 93.
Other study performed by Smith et al. 96 used urine samples from asymptomatic men (n= 24) and men with PCa (n=13) to detect the presence or absence of VOCs, by GC-MS analysis. This study identified 21 VOCs (butyrolactone, methyl vinyl ketone, methylamine, N-ethylformamide, acetonitrile dimethylamino, pyridine, N-methyl-formamide, acetaldehyde, acetamide, 1-methyl-piperidine, 1-piperidineacetronitrile, dimethylamine, pyrrole, methacrolein, N,N-dimethylformamide, 3-methyl-pyridine, methyl-1H-pyrrole, 2-octanone, 1-ethyl-1H-pyrrole, 2-n-butylacrolein, methyl propyl disulfide) with statistical significance (p<0.05), that demonstrate a positive association with the presence of PCa 96.
The study of Jentzmik et al. 97 consisted in a target approach focused in the measurement of sarcosine levels in urine samples from PCa patients (n= 106), patients with no evidence of malignancy (NEM) (n=33) and control individuals (n=12). Sarcosine was determined by GC-MS and the ROC analysis showed that sarcosine values were 13% lower in PCa than in NEM. These results were not associated with tumor stage or grade, thus discording with the previous study of Sreekumar et al. 93. Hence, this study concluded that sarcosine in urine cannot be considered a biomarker to differentiate patients with or without PCa 97.
Stabler et al. 98, performed a study based on GC-MS analysis of urine from PCa patients that developed biochemical recurrence (n=25) and patients that remained recurrence free (n=29). Multiple methionine metabolites were measured in urine and serum and the results showed that urinary sarcosine (p=0.03) and cysteine (p=0.007) levels were significantly higher in recurrent group at the time of prostatectomy, compared to those that remained recurrence free five years after surgery. Thus the urinary analysis in a pre-surgical patient population suggested that products of methionine metabolism can be associated with PCa progression 98.
19
To validate the diagnostic value of sarcosine for PCa diagnosis and study the urine metabolomic profiles of patients with PCa, Wu et al. 99, performed a study using GC-MS for analysis of urine from PCa patients (n=20), patients with benign prostate hypertrophy (n=8) and control individuals (n=20). Five metabolites were found with statistical significance (p<0.05) discriminating between PCa and the non-cancerous group (patients with benign prostate hypertrophy), such as dihyroxybutanoic acid and xylonic acid, that were up-regulated, and pyrimidine, xylopyranose and ribofuranoside that were downregulated. Nine metabolites with statistical significance (p<0.05) were found between PCa and control individuals, such as propenoic acid, dihydroxybutanoic acid and xylonic acid, that were up-regulated, and pyrimidine, creatinine, purine, glucopyranoside, ribofuranoside and xylopyranose that were downregulated. According to this study, abnormal metabolism of carbohydrates can be associated with tumor growth due to the large energy needs for cell proliferation 99.
Other two studies from Bianchi et al. 100 and Khan et al. 101 evaluated the sarcosine levels in urine samples by GC-MS, to differentiate between PCa patients and control individuals. Bianchi et al. 100 studied urine samples of PCa patients (n=33), control individuals (n=13) and patients with BPH (n=10). The results showed that the medians of sarcosine/creatinine in urine were 267, 137 and 103 µg/g, corresponding to PCa patients, BPH patients and control individuals, respectively. These results showed that sarcosine was significantly associated with the presence of cancer (p<0.0001) 100. The study of Khan et al. 101 used biopsy-positive (n=211) and biopsy-negative (n=134) urine sediments and the results found were in accordance with the previous one 100, showing that sarcosine levels were significantly elevated in PCa urine sediments compared to controls 101.
The determination of possible metabolite biomarkers in urine of PCa patients, by GC-MS, was the aim of the study of Shamsipur et al. 102. The comparison of urine from control individuals (n=20) and PCa patients (n=12) showed higher levels of sarcosine and proline, and lower levels of leucine, in PCa patients compared to controls 102.
Struck-Lewicka et al. 92 performed a study based on the analysis of urine from PCa patients (n=32) and control individuals (n=32) by GC-MS and LC-MS analysis. Several metabolites, including amino acids, organic acids, sphingolipids, fatty acids and carbohydrates were found statistically significant different (p<0.05) between the two groups. Low levels of glycine (p=1.244x10⁻²), serine (p=7.866x10⁻³), threonine (p=4.061x10⁻⁶) and alanine (p=3.156x10⁻⁹) were observed in PCa group compared to control group. Decreased levels of glutamine (p=0.028) and also decreased levels of isocitrate, aconitate and succinate were also observed in urine of PCa patients, thus suggesting disturbances in glutaminolysis and energy metabolism. The statistically significant decrease in the levels of
20
sucrose (p=5.559x10⁻⁵), sorbose (p=6.417x10⁻³), arabinose (p=1.727x10⁻³), arabitol (p=1.210x10⁻⁶), inositol (p=4.093x10⁻²) and galactaric acid (p=3.532x10⁻²) in urine of PCa patients may indicate alteration in carbohydrates degradation by cancer cells for energy production. Some carnitines, such as dimethylheptanoyl carnitine (p=0.003), propanoylcarnitine (p=0.007), butyrylcarnitine and octanoylacarnitine (p=0.002) were present in lower levels in urine of PCa group compared to controls. Carnitines are important for conservation of regular mitochondrial function being involved in the transport of activated long chain fatty acids 92.
VOC levels were determined in urine from PCa patients (n=59) and a non-cancer group of individuals (n=43) by GC-MS for classification purposes 103. The results showed alterations in the levels of four VOCs, namely 2,6-dimethyl-7-octen-2-ol, pentanal, 3-octanone and 2-3-octanone. All these compounds, except pentanal, were found down-regulated in urine samples from PCa patients compared with the non-cancer group. The production of aldehydes has been linked with inflammatory conditions with the excessive production of ROS that induce lipid peroxidation 103.
Finally, other study was performed to identify potential urinary VOCs that can be sensitive and specific for PCa diagnosis. Pacheco et al. 104 performed a study that included urine from patients with PCa (n=29) and BPH (n=21) analysed by GC-MS. The GC-MS urinary VOC profile unveiled fifty-seven VOCs, but only nine showed statistically significant differences between the two groups. In this study, urine samples were obtained from each patient before and after prostate massage, which has been demonstrated to increase PSA levels. Before prostate massage, the statistically significant metabolites were furan (p<0.001), 2-ethylhexanol (p=0.032), 3,5-dimethylbenzaldehyde (p=0.027), santolin triene (p=0.032) and 2,6-dimethyl-7-octen-2-ol (p=0.003). After prostate massage, furan (p<0.001), 3-methylphenol (p=0.014), p-xylene (p=0.002), phenol (p<0.001) and 2-butanone (p=0.001) were found statistically significant different 104.
21
Table 3. Metabolomics studies of PCa performed in urine samples by GC-MS. PCa subject group Control group Analytical Platform Statistical methods Total /Discriminative Features Found
Results found for PCa group Ref.
n=59 n=51 biopsy negative control individuals GC-MS LC-MS Wilcoxon P test, nonparametric tests 538/36 Sarcosine (↑)
Alterations in glycine synthesis and degradation 93 n= 13 n=24 healthy individuals GC-MS Binary string, similarity coefficients
91/21 Butyrolactone (↑), methyl vinyl ketone (↑), methylamine (↑), N-ethylformamide (↑), acetonitrile dimethylamino (↑), pyridine (↑), N-methyl-formamide (↑), acetaldehyde (↑), acetamide (↑), methyl-piperidine (↑), 1-piperidineacetronitrile (↑), dimethylamine (↑), pyrrole (↑), methacrolein (↑), N,N-dimethylformamide (↑), 3-methyl-pyridine (↑), 2-methyl-1H-pyrrole (↑), 2-octanone (↑), 1-ethyl-1H-pyrrole (↑), 2-n-butylacrolein (↑), methylpropyldisulphide (↑) 96 n=106 n=57 (33 NEM and 24 HC) GC-MS Non-parametric tests and ROC
NS/0 Sarcosine levels were 13% lower in PCa than in NEM patients. Sarcosine in urine is not suitable for improving the PCa diagnostic performance. 97 n= 25 recurrent n=29 recurrent free
GC-MS ROC 4/2 Recurrent group: Sarcosine (↑), cysteine
(↑) 98 n= 20 n= 28 (20 HC and 8 BPH) GC-MS PCA ROC
81/5 Dihyroxybutanoic acid (↑), pyrimidine (↓), xylonic acid (↑), xylopyranose (↓),
ribofuranoside (↓)
22 PCa subject group Control group Analytical Platform Statistical methods Total /Discriminative Features Found
Results found for PCa group Ref.
n=33 n= 23 (13 HC and 10 BPH) GC-MS Non-parametric tests, ROC NS/1 Sarcosine (↑) 100 n=211 n=134 biopsy negative individuals GC-MS ROC NS/1 Sarcosine (↑) 101 n=12 n=20 control individuals GC-MS LC-MS
NS 6/3 Sarcosine (↑), leucine (↓), proline (↑) 102
n=32 n=32 control individuals GC-MS LC-MS PCA PLS-DA
1132/15 Glycine (↓), serine (↓), threonine (↓), alanine (↓), glutamine (↓), isocitrate (↓), aconitate (↓), succinate (↓), sucrose (↓), sorbose (↓), arabinose (↓), arabitol (↓), inositol (↓), galactaric acid (↓) and carnitines (↓) 92 n=59 n=43 control individuals GC-MS RF LDA 197/4 2,6-dimethyl-7-octen-2-ol (↓), pentanal (↑), 3-octanone (↓), 2-octanone (↓) 103
n=29 n=21 BPH GC-MS ANOVA 57/9 Before prostate massage: furan (↑),
3,5-dimethylbenzaldehyde (↓), santolin triene (↓), 2,6-dimethyl-7-octen-ol (↓), 2-ethylhexanol (↓)
After prostate massage: furan (↑), 2-butanone (↑), p-xylene (↑), phenol (↑), 3-methylphenol (↑)
104
ANOVA: Analysis of variance; BPH: benign prostatic hypertrophy; GC-MS: gas chromatography-mass spectrometry; HC: healthy control; LDA: Linear discriminant analysis; LC-MS: Liquid chromatography-mass spectrometry; NEM: No evidence of malignancy; NS: not specified; PCA: Principal component analysis; PLS-DA: Partial least squares discriminant analysis; RF: Random forest; ROC: Receiver-operator characteristic; (↑): levels increased in PCa; (↓): levels decreased in PCa.
23 1.3. Aims
PCa is one of the most common cancers diagnosed in men, with new cases being diagnosed every day 5. Several screening techniques have been used for PCa diagnosis, such as prostate serum antigen (PSA) and digital rectal examination. However, a prostate biopsy is necessary for a final diagnosis. PSA is specific for prostate diseases but not specific for PCa. Thus, the discovery of new biomarkers is necessary for a more efficient, rapid, specific, non-invasive and economic PCa diagnosis and prognosis 8. Metabolomic studies using several biological matrices (e.g., urine, blood) have been conducted for improvement of PCa diagnostic approaches 105. Nevertheless, studies focused in the profiling of carbonyl compounds in urine samples from PCa patients are still limited.
In order to search for potential new biomarkers of PCa and increase the knowledge of PCa pathological mechanism, the aim of this thesis was to identify and interpret alterations in the levels of carbonyl compounds (aldehydes and ketones) present in urine samples from PCa patients compared with healthy individuals (control group), using a HS-SPME/GC-MS based metabolomic approach. As far as we know, this is the first time that a HS-SPME/GC-MS based metabolomic study is performed for profiling of carbonyl compounds in urine from PCa patients.
24