2018
Maryam Salimian
Avanços na síntese e caracterização de
nanocompositos multifuncionais de níquel /
óxido de grafeno reduzido
Advances in multifunctional nickel / reduced
graphene oxide nanocomposites, synthesis and
characterization
Maryam Salimian
Avanços na síntese e caracterização de
nanocompositos multifuncionais de níquel / óxido de
grafeno reduzido
Advances in multifunctional nickel / reduced
graphene oxide nanocomposites, synthesis and
characterization
Tese apresentada à Universidade de Aveiro para cumprimento dos requisitos necessários à obtenção do grau de Doutor em Engenharia Mecânica, realizada sob a orientação científica da Doutora Paula Alexandrina de Aguiar Pereira Marques, equiparada a Investigador Principal do Departamento de Engenharia Mecânica da Universidade de Aveiro e co-orientação do Doutor Gil Alberto Batista Gonçalves investigador no Instituto de Ciência de Materiais de Barcelona (ICMAB), Espanha
Apoio financeiro da FCT (SFRH/BD/98337/2013)
Professor Catedrático, Departamento de Engenharia Electrónica e Telecomunicações da Universidade de Aveiro
Doutor Gerard Tobias Rossel
Investigador Coordenador, Instituto de Ciència de Materials de Barcelona, Espanha
Doutor Jérôme Borme
Investigador, International Iberian Nanotechnology Laboratory (INL), Braga, Portugal
Doutor João Carlos Barbas de Oliveira
Investigador Auxiliar, Departamento de Engenharia Mecânica, Faculdade de Ciências da Universidade de Coimbra
Professor Doutor Fernão Domingos de Montenegro Baptista Malheiro de Magalhães
Professor Auxiliar, LEPABE, Departamento de Engenharia Química, Faculdade de Engenharia da Universidade do Porto
Professor Doutor Victor Fernando Santos Neto
Professor Auxiliar Convidado, Departamento de Engenharia Mecânica da Universidade de Aveiro
Doutor Gil Alberto Baptista Gonçalves
Alexandrina de Aguiar Pereira Marques for the continuous support of my Ph.D. study and research, for her motivation and immense knowledge. A very special gratitude goes to my co-advisor Dr. Gil Alberto Batista Gonçalves for his support, great advices and all the useful discussions. My sincere thanks to Professor Jose Gracio who unfortunately is not among us anymore, provided me the opportunity to pursue my PhD study at the University of Aveiro.
I am grateful to Fundação para a Ciência e a Tecnologia (FCT) for my Ph.D. funding under the grant SFRH/BD/98337/2013.
My appreciations extend to all my colleagues, staffs and technicians from TEMA-NRD, mechanical engineering department particularly Dr. Igor Bdikin, Dr. Gonzalo Irurueta, Dr. Maria Hortigüela, Dr. Rahul Krishna, Dr. Olena Okhay, Mrs. Suzana Pinto and Mr. Andre Girao. Special thanks to Dr. Duncan Fagg and his group including Mr. Francisco Loureiro, Dr. Sergey Mikhalev, Dr. Aliaksandr Shaula and Dr. Pukazh Selvan for all their helps, kindness and all the great moments we have had together during my work in mechanical engineering department.
My endless thanks to Dr. Bernd Rellinghaus for giving me the opportunity to work at the institute of solid state and materials research (IFW) in Dresden, Germany, as a visiting PhD student during one year and giving me the access of all needed laboratories and facilities. Also, I would like to thank to all of the members of Institute of metallic materials in IFW including, Dr. Alexander Surrey, Dr. Darius Pohl, Dr. Steffen Oswald and Mrs. Christine Damm for their great help and a friendly atmosphere.
Many thanks to Professor Andrei Kholkin and Dr. Maxim Ivanov from physics department for the AFM measurements and all of the helpful discussions. I would like to thank our collaboration with Dr. Dmitri Petrovykh and Dr. Francis Deepak at the International Iberian Nanotechnology Laboratory (INL) in Braga. And the last but the most appreciations go to my lovely parents and my sisters for all of their endless supports, great love, motivation and encouragement. Without their help, I wouldn’t be able to reach to this point in my life.
resumo O grafeno é constituído por uma monocamada de átomos de carbono
dispostos numa espécie de rede hexagonal perfeita. Devido às suas propriedades extraordinárias, este nanomaterial tem suscitado um grande interesse tanto no setor científico como no industrial. A este respeito, a investigação em torno do grafeno mostrou um aumento exponencial em áreas tão diferentes como a energia, biomedicina, eletrónica, entre outras.
O óxido de grafeno (GO), um dos derivados de grafeno, foi considerado como um substrato interessante para o desenvolvimento de nanocompositos. Isto deve-se fundamentalmente à presença de grupos funcionais de oxigénio na superfície do grafeno, os quais proporcionam locais reativos para a nucleação e o crescimento de outras estruturas.
O níquel (Ni) é um metal de transição muito abundante na terra, possui uma superfície brilhante comum à maioria dos metais e é dúctil e maleável possuindo propriedades magnéticas e catalíticas superiores, condutividade térmica e elétrica razoáveis sendo muito utilizado em diferentes aplicações. As nanopartículas (NPs) de Ni são utilizadas como catalisadores heterogéneos e receberam atenção notável devido ao seu baixo custo, reduzida toxicidade, baixa corrosão, entre outras características. Desta forma, a funcionalização do GO com NPs de Ni pode constituir uma nova família de nanocompósitos com propriedades sinérgicas.
Esta tese está focada no controlo da síntese de nanocompósitos Ni/GO, uma vez que o tamanho, a morfologia e a dispersão de NPs de Ni no grafeno afetam as suas funcionalidades e estão em dependência direta com as metodologias de síntese.
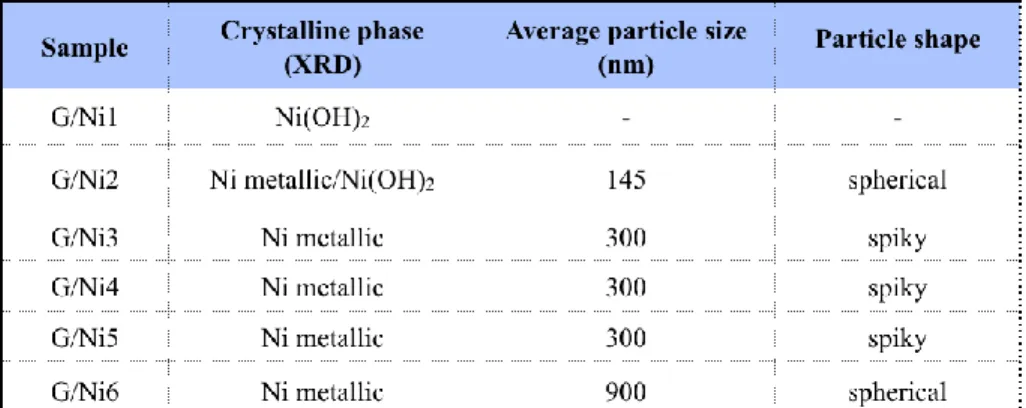
Em primeiro lugar, foi usado um método hidrotérmico de fácil implementação e execução num passo único. Foram estudados vários parâmetros de síntese, incluindo temperatura, tempo de reação e agente redutor. O controlo destes parâmetros influenciou efetivamente o tamanho das NPs de Ni, variando estas de 150 a 900 nm, a morfologia variou de forma esférica a formato em espiga e de partículas finas bem distribuídas para agregados.
Em seguida, o controlo do tamanho das NPs de Ni para valores inferiores a 10 nm e com distribuição de tamanho reduzido no substrato foi conseguido através de um procedimento de síntese em dois passos com base num método solvotérmico seguido por tratamento térmico sob atmosfera redutora de H2. O tempo de reação mostrou ser um fator chave para controlar a distribuição e o tamanho das NPs de Ni simultaneamente com a redução do GO (rGO). O aquecimento em atmosfera de H2 foi crucial para formar as NPs de Ni metálicas cristalinas.
A influência de um tratamento térmico adicional em atmosferas redutora e inerte sobre a estrutura do nanocompósito Ni/rGO foi também investigada. Diferentes nanocompósitos apresentaram boa estabilidade térmica sob H2 até à temperatura de 450 °C durante 2 horas. O tratamento a 900 °C sob o fluxo de árgon alterou a estrutura do Ni/rGO por formação de “sulcos” através da rede de carbono e coalescência das NPs de Ni com formação de partículas maiores. O estudo das propriedades eletrofisicas dos nanocompositos Ni/rGO mostrou que estas são dependentes do tamanho e estrutura das NPs de Ni nas folhas de rGO. Esta é uma potencial vantagem do método de síntese desenvolvido para o design de diferentes nanocompositos de Ni/rGO que poderão ser materiais favoráveis para aplicação em dispositivos eletrónicos integrados.
abstract Graphene, the world thinnest material made of carbon atoms in a dense honeycomb network has captured a great interest in both scientific and industry sectors due to its remarkable properties. In this regard, the graphene research is facing an incredible rise in different areas such as energy, biomedical, sensor and electronic applications, between others.
Graphene oxide (GO), one of the graphene derivatives, has been considered as an interesting substrate to build nanocomposites. This is due to the presence of oxygen functionalities at the graphene surface which provides reactive sites for the nucleation and growth of other structures.
Nickel (Ni) is a transition metal very abundant on earth, it has a shiny surface common to most metals and is both ductile and malleable possessing different properties such as superior magnetic and catalysis properties, a fairly good heat and electrical conductivity and is widely used in different areas of application. Ni nanoparticles (NPs) find use as heterogeneous catalyst and received noteworthy attention because of its inexpensive, non-toxic, low corrosion, waste minimization, between other characteristics. In this way, the functionalization of GO with Ni NPs can establish a new family of nanocomposites with synergic properties.
This thesis is focused on the control of the synthesis of Ni/GO nanocomposites, since the size, morphology and dispersion of Ni NPs on graphene affect their functionalities and are in direct dependence with the synthesis methodologies. First, a facile one pot hydrothermal method was introduced and various synthesis parameters including temperature, reaction time and reducing agent were investigated. The control of these parameters effectively influenced the Ni size, ranging from 150 to 900 nm, the morphology from spherical to spiky shape and from well distributed fine particles to the big aggregation.
Then, the control of the Ni NPs size to values of less than 10 nm with narrow size distribution on the substrate was achieved via a two-step synthesis procedure based on a solvothermal method followed by a heat treatment under H2 reducing atmosphere. The reaction time was shown to be a key factor to
control the size and size distribution of Ni NPs simultaneously through the reduction of GO (rGO). Heating treatment under H2 was crucial to form the
crystalized metallic Ni NPs.
The influence of further thermal treatment under reducing and inert atmospheres on the structure of Ni/rGO nanocomposite was also investigated. Different nanocomposites showed a good thermal stability under H2 up to
450°C during 2 hours’ treatment. Higher temperature (900°C) under Argon flow changed the structure of Ni/rGO by formation of trenches through the carbon etching and coalescence of Ni NPs to form bigger particles. The study of the electrophysical properties of Ni/rGO showed that these properties are dependent on the size and structure of Ni NPs on rGO nanosheets. This is the potential advantage of the synthesis method developed for designing different matrix of Ni/rGO nanocomposites which could be a favorable material for integrated electronic devices application.
I
Table of Contents
List of Figures ... V List of Tables ... VII List of Abbreviation and Acronyms ... IX
Chapter 1 ... 1 Introduction ... 1 1. Introduction ... 3 1.1 Carbon ... 3 1.2 Graphene ... 5 1.3 Graphene fabrication ... 6
1.3.1 Top down approach ... 7
1.3.2 Bottom-up approach ... 9
1.4 Graphene Oxide (GO) ... 12
1.4.1 History and fabrication methods (Brodie, Staudenmaier and Hummer’s method) ... 12
1.4.2 Chemical structure ... 15
1.4.3 Preparation of rGO ... 18
1.4.3.1 Thermal annealing reduction ... 19
1.4.3.2 Chemical reduction ... 20
1.4.3.3 Hydrothermal and solvothermal reduction ... 22
1.5 Graphene based nanocomposites ... 23
1.5.1 Graphene nanoparticles nanocomposites ... 24
1.5.2 Graphene based nickel compound (nickel hydroxide, nickel oxide, nickel) nanocomposite... 27
1.5.2.1 Reduced graphene oxide/ nickel hydroxide nanocomposite ... 27
1.5.2.2 Reduced graphene oxide/ nickel oxide nanocomposite ... 28
1.5.2.3 Reduced graphene oxide/ nickel nanocomposite ... 30
1.6 Thesis outline ... 33
1.7 Bibliography ... 35
Chapter 2 ... 49
Synthesis and characterization of reduced graphene oxide/spiky nickel nanocomposite for nanoelectronic applications ... 49
2.1 Scope ... 51
2.2 Introduction ... 51
II
2.4 Results and discussion ... 57
2.4.1 Influence of reaction parameters on the G/Ni nanocomposite structure ... 57
2.4.2 rGO nanocomposites with spiky nickel nanoparticles ... 63
2.4.3 SPM measurements of Ni/GO nanocomposites ... 68
2.6 Conclusion ... 72
2.7 Bibliography ... 75
A.1 Supplementary material of chapter 2 ... 79
Chapter 3 ... 83
Solvothermal synthesis of Ni/rGO nanocomposite: from nickel nanoclusters to homogeneously distributed discrete nickel nanoparticles ... 83
3.1 Scope ... 85
3.3 Material and Methods ... 88
3.3.1 Materials ... 88
3.3.2 Synthesis of graphene oxide ... 89
3.3.3 Solvothermal synthesis of nickel/graphene oxide nanocomposites (Ni/GO) ... 89
3.3.5. Materials Characterization ... 90
3.4 Results and discussion ... 91
3.4.1 Solvothermal synthesis of Ni/GO nanocomposites ... 91
3.4.2 Reduction of Ni/GO nanocomposites by thermal treatment under hydrogen atmosphere ... 95
3.5 SPM measurements of Ni/rGO nanocomposites ... 104
3.6 Conclusions ... 110
3.7 Bibliography ... 113
A.2 Supplementary material of chapter 3 ... 119
Chapter 4 ... 123
Structural changes of Ni/rGO nanocomposites by thermal annealing ... 123
4.1 Scope ... 125
4.2 Introduction ... 126
4.3 Experimental section ... 129
4.3.1 Thermal annealing treatment of Ni/rGO nanocomposites ... 129
4.3.2 Characterization ... 130
4.4 Results and discussion ... 130
4.4.1 Structural study of samples Ni/rGO3-H2, Ni/rGO6-H2 and Ni/rGO24-H2 ... 130
4.4.2 Morphology and structural study of samples Ni/rGO24-Ar and Ni/rGO24-Ar-H2 ... 136
4.5 Conclusion ... 140
4.6 Bibliography ... 141
III
V
nanotube, adapted from ref [1]. ... 3
Figure 1.2 The crystal structure of graphite, adapted from reference [3]. ... 4
Figure 1.3 Graphene as a building material for other carbon materials[9]. ... 5
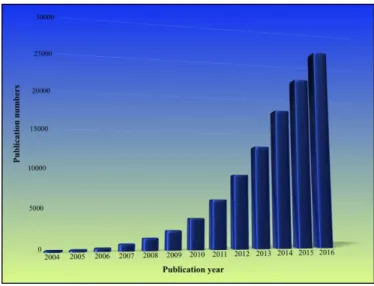
Figure 1.4 Evolution number of publication about graphene during 2004-2016. Obtained by searching key word “Graphene” data source: Web of Science, Date:07/14/2017. ... 6
Figure 1. 5 Schematic of top down and bottom up approach for graphene fabrication7 ... 7
Figure 1.6 Micromechanical exfoliation of graphene (a) [23] and liquid based direct exfoliation (b) [24]... 8
Figure 1.7 Schematic representation of a) pure graphene, individual GO layer with different functional groups and single layer of rGO; b) preparation of rGO via chemical exfoliation of graphite [26]. ... 9
Figure 1.8 Schematic illustration of graphene fabrication via CVD method, orange color resembling high temperature and a gas phase while the blue color related to the cold and etchant [27]. ... 10
Figure 1.9 The growth of epitaxial bilayer graphene on Si surface of SiC substrate and its structural models. Blue color shows the carbon atom while red is silicon [38]. ... 11
Figure 1.10 Crystal structure of 6H-SiC and corresponding few layers graphene (FLG) on silicon terminated surface and multilayers graphene (MLG) on carbon terminated surface, blue and red shows carbon and silicon atoms respectively [38]. ... 12
Figure 1.11 Representation of three different methods for oxidizing of graphite flakes (GF). Three bottles showing the hydrophobic carbon materials after purification of HGO, IGO and HGO +. The IGO has a lower under-oxidized material which proves the efficiency of improved Hummers’ method[45]. ... 13
Figure 1.12 Representation of the three steps mechanism of GO formation from graphite flakes with the respective optical images. The black line, blue line, purple line and black dotted line, represents respectively graphene layers, H2SO4/HSO4- intercalant, a mixture of H2SO4/HSO4- with reduced oxidizing agent and a GO monolayer [46]. ... 14
Figure 1.13 Different earliest models for GO structure (Images are adapted from references [50, 51, 52, 53 and 54]). ... 16
Figure 1.14 Aberration corrected TEM image of a single layer of GO. The blue, yellow and red color indicating the holes, graphitic domain and disordered regions with oxygen groups respectively, scale bar denoting 2 nm, adapted from ref [56]. ... 17
Figure 1.15 a) Atomic structure of GO obtained by (AC-TEM) during the heating process at 700 ºC, b) The structure of only one area in (a) that is shown in white the resolved structure [57]. ... 18
Figure 1.16 Schematic illustration of GO preparation and its reduction with hydrazine hydrate [76]. ... 21
Figure 1.17 The effect of exfoliation of GO on the reduction degrees [77]. ... 22
Figure 1.18 Schematic representation of different preparation of graphene/NPs composites [78]. ... 25
Figure 1.19 Different experimental conditions to synthesize different TiO2/graphene nanosheets structure [114]. ... 27
Figure 2.1 XRD profile of G/Ni nanocomposites for different N2H4.H2O concentration (G/Ni1, G/Ni2, G/Ni5, G/Ni6) and different reaction time (G/Ni3, G/Ni4, G/Ni5). ... 59
Figure 2.2 SEM images of G/Ni nanocomposites synthesized with different N2H4.H2Oconcentrations. ... 60
Figure 2.3 SEM images of G/Ni3, G/Ni4 and G/Ni 5 nanocomposites at three different reaction times 5, 11 and 22 hours respectively showing the increase in the growth of spiky Ni NPs and a schematic representation of Ni NPs morphology changes with reaction time. ... 62
Figure 2.4 TEM image of one single spiky Ni particle at the surface of rGO sheet. Diffraction pattern (SAED) on the core (1) and on a single nonothorn (2) with the respective crystalline planes of NiO. ... 63
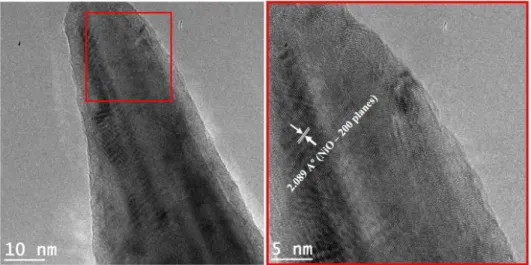
Figure 2.5 HRTEM images of single nanothorn (on the left) and its selected area with high resolution (on the right) showing the lattice structure of NiO. ... 64
Figure 2. 6 Ni 2p XPS spectra of G/Ni3, G/Ni4, G/Ni5 samples. ... 65
Figure 2.7 High-angle annular dark-field scanning transmission electron microscopy (HAADF-STEM) image of G/Ni5 nanocomposite and the corresponding elemental mapping of nickel (Ni) and oxygen (O). ... 67
Figure 2.8 Images of the rGO matrix with Ni particles in a) SPM microscopy mode b) spreading resistance SPM mode, c) SEM mode and d) a single spiky Ni particle. ... 68
Figure 2.9 SPM images of rGO matrix with Ni particles in a) Kelvin Probe Force Microscopy mode and b) Spreading resistance mode. Current-voltage dependence on the c) most conductive (Ni particle) and d) less conductive (rGO matrix) areas. ... 70
VI
FigureA.1.3 High-angle annular dark-field scanning transmission electron microscopy of G/Ni5 nanocomposite and
corresponding elemental information at selected area of one single nanothorn. ... 81 Figure 3.1 XRD profile and FTIR spectrum of Ni/GO nanocomposites synthesized using different solvothermal reaction
times. ... 93 Figure 3.2 High resolution XPS of C 1s a) and Ni 2p b); Raman spectra c) for the nanocomposites Ni/GO after solvothermal
treatment at different reaction times (1h, 3h, 6h and 24h). ... 94 Figure 3.3 XRD patterns a) and FTIR b) of different Ni/rGO nanocomposite after thermal treatment under hydrogen at 450 ºC during 2 h (Ni/rGO). ... 96 Figure 3.4 High resolution XPS of C 1s a) and Ni 2p b) for the nanocomposites Ni/rGO prepared after thermal treatment in
hydrogen atmosphere at 450 ºC during 2h. ... 97 Figure 3.5 Raman spectra of different nanocomposite samples after reduction under hydrogen atmosphere at 450 ºC during 2h. ... 98 Figure 3.6 TEM images of the Ni/rGO nanocomposites after reduction under hydrogen atmosphere at 450 ºC during 2h
(Ni/rGO1 a), Ni/rGO3 b), Ni/rOG6) and Ni/rGO24). ... 99 Figure 3.7 a) AFM images of the GO and Ni/rGO nanocomposites after thermal annealing under hydrogen atmosphere at 450
ºC during 2h, b) Ni NPs size distribution and c) density of NPs at the surface of the different nanocomposites. ... 100 Figure 3.8 Schematic representation of nucleation and growth of Ni NPs at GO surface (not to scale): Solvothermal treatment
of GO in DEG using nickel acetate as a precursor during t=1h, t=3h, t=6h and t=24h. After solvothermal synthesis, all the Ni/GO nanocomposites were thermal treated under hydrogen atmosphere at 450 ºC during 2h in order to form metallic Ni NPs. ... 102 Figure3.9 HRTEM images of the nanocomposites Ni/rGO1 a), Ni/rGO3 b), Ni/rGO6 c) and Ni/rGO24 d). The blue dot-line
shows the coalescence between two Ni/NiO NPs on rGO. ... 103 Figure 3.10 Topography (left) and corresponding KPFM response (right) of (a) reference rGO sample; the KPFM responses of Ni/rGO1 (b) 3 (c), 6 (d) and 24 (e) composites. ... 105 Figure 3.11 The SR signal measured in the Ni/rGO 1 (a), 3 (b), 6 (c), 24 (d) at 1 V and rGO (e) at 10 V; f) schematic
representation of the deterioration of the rGO matrix induced by Ni NP rearrangement. ... 108 Figure 3.12 a) A comparison of the currents registered in Ni/rGO and rGO samples at ± 3 V; current-voltage behavior of the
rGO (b), Ni/rGO1 (c), 3 (d), 6 (e) and 24 (f) samples. ... 109 Figure 3.13 The schematic view of the energy diagram organized in the Ni/rGO nanocomposites and the effect caused by the
NiO buffer layer. ... 110
Figure A.2.1 XRD spectra of sample Ni-GO 24 synthesized by solvothermal method at 200 °C. ... 119 Figure A.2.2 SEM images of sample Ni-GO 24 prepared by solvothermal method at 200 °C, 24h). ... 120 Figure A.2.3 SEM images of sample Ni/rGO24 prepared by two steps: solvothermal (150 ºC, 24h) and hydrogen reduction
treatment (450 ºC, 2h). ... 120
Figure 4.1 FTIR (a) and Raman (b) spectra of the three nanocomposites after annealing at 450 ºC in H2 during 2h. 131
Figure 4.2 XPS C1s (a) and Ni2p3 (b) spectra of nanocomposites annealed under H2 atmosphere at 450 º C for 2 hours. 132
Figure 4.3 XPS spectra of Ni/rGO6-H2 and Ni/rGO24-H2 after Ar +
sputtering 133
Figure 4.4 XPS reference spectra of (a) Ni before Ar+ sputtering, after Ar+ sputtering, and after the sputtered sample was exposing to the air (for 1.5 h), NiO (b) before and after Ar+ sputtering 134 Figure 4. 5 TEM images of Ni/rGO6-H2 indicating well dispersed Ni NPs and a few trenches made by catalytic etching of
rGO. red circles show the dimension of trenches are comparable with the NPs size. 135 Figure 4.6 TEM images of a) distribution of Ni in Ni/rGO24-Ar b) migrated Ni NPs on rGO to form aggregates c) formation
of trenches and bigger size of Ni by coalescence of Ni NPs, d) a single NP. 136 Figure 4.7 TEM images (a, b) of Ni/rGO24-Ar-H2 showing randomly distributed of Ni and the accumulation of trenches on
rGO c) HRTEM of etched rGO by Ni NPs. 137
Figure 4.8 FTIR (a) and Raman (b) spectra of etched Ni/rGO24-Ar and Ni/rGO24-Ar-H2 samples. 138
VII
Table 2.1 rGO/Ni nanocomposites prepared at different experimental conditions. ... 55 Table 2. 2 A description of the crystalline structure, particle size and shape of Ni NPs achieved depending of the experimental conditions. ... 57
Table 3.1 Recommended work functions for polycrystalline materials [48] ... 106
Table 4.1 Experimental conditions used for the thermal treatment of the nanocomposites Ni/rGO3, Ni/rGO6 and Ni/rGO24. ... 129 Table 4.2 Atomic concentration for C, N, O and Ni of the nanocomposites after annealing at 450 ºC in H2 during 2h. ... 133
Table 4.3 Atomic concentration of samples Ni/rGO24-Ar and Ni/rGO24-Ar-H2 after heat treatment at 900 ºC under Ar... 139
IX
AC-TEM aberration corrected transmission electron microscopy
AFM atomic force microscopy
at. % atomic percentage
BET Brunauer–Emmett–Teller (surface area analysis)
CVD chemical vapor deposition
DFT density functional theory
DMF dimethylformamide
EDS energy dispersive X-ray spectroscopy
EM electromagnetic
FLG Few layer graphene
FTIR Fourier transform infrared spectroscopy
GIC graphite intercalation compound
GO graphene oxide
HAADF-STEM high angle annular dark-field scanning transmission electron microscopy
HH hydrazine hydrate
HOG graphene oxide prepared by Hummers’ method
HOG+ graphene oxide prepared by modified Hummers’ method
HOPG highly oriented pyrolytic graphite
HRG highly reduced graphene oxide
HRTEM high resolution transmission electron microscopy
HSC hydrogen storage capacity
ICP-OES inductively coupled plasma optical emission spectroscopy
IGO graphene oxide prepared by improved Hummers’ method
KPFM kelvin probe force microscopy MWCNT Multiwall carbon nanotube
NMR nuclear magnetic resonance
NPs nanoparticles
PFM piezo response force microscopy
PGO pristine graphite oxide
X
SEM scanning electron microscopy
SGH self-assembled graphene hydrogel
SPM scanning probe microscopy
SR spreading resistance
STEM scanning/transmission electron microscopy TEGO thermally exfoliated graphite oxide
TEM transmission electron microscopy
WF work function
wt.% weight percentage
XPS X-ray photoelectron spectroscopy
1
Chapter 1
Introduction
3
1. Introduction
1.1 Carbon
Carbon is known as one of the most versatile elements, for all known terrestrial life on the earth. It is capable to form many allotropes such as diamond, graphite, lonsdaleite, fullerene and carbon nanotubes, Figure 1.1 [1].
Figure 1.1 carbon allotropes structure A) diamond B) graphite C) lonsdaleite, D-F) fullerene (C60, C540, C70) G) carbon nanotube, adapted from ref [1].
Despite that all carbon allotropes are made entirely out of pure carbon they confer different properties depending on their structure. For example, diamond is a giant tetrahedron structure of carbon atoms. The hardest known material with high transparency which is desirable for both jewelry and use for cutting, grinding or drilling apparatus [2]. Graphite is another allotrope with carbon layered-planar structures. It is greyish- black and opaque, soft and slippery which is used for pencil leads. High electrical conductivity made it a good candidate for electrode materials application. The different fundamental physical properties of different carbon allotropes are the consequence of different molecular configuration.
Carbon atoms have 6 electrons with the configuration of 1s2 2s2 2p2. The core electrons with the energy of around -285 eV are strongly bound to the nucleus and don’t participate in
4 atomic bonding. It has only small influence on the physical properties of carbon-based material as a source of dielectric screening for outer shell electrons. The rest 4 electrons in the second shell of orbitals (2s and 2p) have different energy of about 4 eV which is favorable for configuration of 2 electrons in 2s orbital, one electron in 2px and one in 2py state.
Carbon can form covalent bonds with other carbon atoms or other elements like hydrogen or oxygen with superposition of quantum states form spn (n = 1,2,3) hybridized orbitals which influences molecular geometry and bonding properties.
The sp2 hybridization forms 3 covalent bonds in-plane with the characteristic angle of 120 degrees known as bonds. The additional pz orbital is perpendicular to these sp2 hybrid
orbitals and stablish bonds.
Figure 1.2 The crystal structure of graphite, adapted from reference [3].
Graphite is a typical example of sp2 hybridized crystal structure. It consists of parallel planes of carbons sheets, which are called graphene, arranged in an ABAB bernal stacking sequence. The carbon atoms are strongly bonded within the graphene layer by bonds, the adjacent graphene sheets are weakly bonded by van der Waals interaction caused by bonds creating the interlayer distance of 0.335 nm between two graphene layers (Figure 1.2) [3]. The C-C bonds are the strongest bonds being responsible for the strength of an in plane of graphene and bonds provide the delocalized electron network which makes the graphene an incredible high electrical conducting material. The π bonds are responsible for the weak bonds between the carbon layers in graphite [4].
5
1.2 Graphene
Two dimensional materials have been a target for theoretical studies over the 70 years [5], [6]. According to Landau and Peierls, two dimensional materials could not exist due to the thermodynamic instability at room temperature [7],[8]. Several observations in experimental work have been supported this theory. According to this theory the melting temperature of a thin film is thickness dependent. In other words, decreasing the thickness of the thin film leads to decompose or islands segregation when the range of the thickness is about dozens of atomic layers. In this regards the only way to form 2D structure was epitaxial growing it on a 3D monocrystalline lattice structure [9]. Nevertheless, the existence of two dimensional atomic crystals was discovered by easy isolation of exfoliation of graphite under ambition conditions in 2004 by Andre Geim and Constantin Novoselov from Manchester University. These scientists successfully detached a graphene layer from highly oriented pyrolytic graphite (HOPG) using scotch tape. For this discovery, they won the joint Nobel Prize of Physics in 2010 [10].
As referred previously, graphene is a single layer of carbon atoms in a dense honeycomb structure and after its discovery it has been considered as a wonder material. Actually, graphene sheets are considered the building blocks for other carbon materials from different dimensionalities, (Figure 1.3)[9].
6 The incredible properties attributed to graphene, such as, high surface area 2630 m2/g, light weight, high carrier mobility (10000 cm2 V-1 s-1), high thermal conductivity (5300 W⋅m−1⋅K−1) both at room temperature, high stiffness (1 TPa), high transparency and high mechanical flexibility, opened up a high expectation for different applications in the fields of electronic, energy storage, biomedical, aerospace industry, sensors, between others. These facts about graphene, generated a remarkable research dramatically increasing year by year ( Figure 1.4).
Figure 1.4 Evolution number of publication about graphene during 2004-2016. Obtained by searching key word “Graphene” data source: Web of Science, Date:07/14/2017.
1.3 Graphene fabrication
There are two main routes for graphene fabrication, top-down and bottom-up synthesis (Figure 1.5) [11].
Top down approaches consist on the decoupling of the stacked graphene layers from graphite source including exfoliation of HOPG or natural graphite by mechanical cleavage with scotch tape [10], chemical exfoliation in organic medium [12] and chemical exfoliation involving strong oxidation agents. In the latter case a highly-oxidized form of graphene is obtained called graphene oxide (GO), and due to that a further reduction process needs to be applied by chemical or/and thermal process [13-15].
7 Bottom up approach is a molecular growth on a substrate from molecular carbon sources including chemical vapor deposition (CVD) [16-18] and epitaxial growth [19-22].
Figure 1. 5 Schematic of top down and bottom up approach for graphene fabrication7
Figure 1.5 Schematic of top down and bottom up approaches for graphene fabrication [11].
1.3.1 Top down approach
Micromechanical cleavage of HOPG is the best-known method for mechanical fabrication of high quality graphene [10]. In this method, a single or few layers graphene can be obtained by peeling off the graphene layers from HOPG on SiO2 substrate, Figure 1.6 (a) [23]. The
obtaining graphene by this method is defect free and has high quality which is competent for electronic characterization; however, this method is not suitable for massive production of graphene.
8 Liquid based direct exfoliation which contain ultrasonic, electrochemical and shear exfoliation is another method that recently got attention for fabrication of two-dimensional nanomaterials including graphene Figure 1.6 (b) [24]. In this method, a bulk material is exfoliated to a few layers in liquid media either with or without intervention of a chemical reaction. The minimum chemical reaction is looked-for in order to preserve the high crystallinity of the final 2D nanomaterial. One of the important disadvantages of this method is the difficulty of complete removing of dispersants such as the solvent. This method is cheap and scalable and an appropriate way for production of few layered nanomaterials without defects in large volume but not able to form highly uniform single layered structure for electronic application.
Figure 1.6 Micromechanical exfoliation of graphene (a) [23] and liquid based direct exfoliation (b) [24].
Graphene can be obtained via oxidation of graphite to GO followed by reduction to produce reduced GO (rGO) [25]. In this method, oxygen functional groups like epoxy, hydroxyl, carbonyl and carboxyl groups are introduced in to the layers of graphite by strong acids and oxidants agents. Graphite oxide can be further exfoliated to the individual or few layers GO. The properties of the obtained GO depend on the several factors like the quality of graphite source and the synthetic methods. The obtained rGO by this method is composed of restored pristine graphene areas, together with the defects on the carbon structure like holes and partial content of oxygen functional groups, see Figure 1.7 [26].
9
Figure 1.7 Schematic representation of a) pure graphene, individual GO layer with different functional groups and single layer of rGO; b) preparation of rGO via chemical exfoliation of graphite [26].
1.3.2 Bottom-up approach
Chemical vapor deposition (CVD) is the most popular technique for the production of large-area graphene. In CVD method, firstly a thin layer of transition metal like nickel (Ni) or copper (Cu) is deposited on the substrate. Ni has a close lattice match with graphene so it has been suggested as a good candidate for graphene growth on it. This structure is exposed to the carbonaceous environment H2/CH4 at high temperature (900-1000 ºC). During the heating
process carbon radicals are diffused in to the Ni and precipitate out of it while cooling down forming graphene. After, by chemical etching of Ni, this graphene membrane is detached from the substrate (Figure 1.8) [27]. The graphene grown on Ni contains multilayers regions besides monolayer region which is a drawback of using this substrate. To increase the monolayer graphene region, annealing the Ni substrate in hydrogen atmosphere has been suggested. This treatment reduces the grain boundaries and defects which are responsible for multilayers-graphene growth [28,29].
10
Figure 1.8 Schematic illustration of graphene fabrication via CVD method, orange color resembling high temperature and a gas phase while the blue color related to the cold and etchant [27].
Copper is another interesting element for graphene fabrication in CVD method that was firstly suggested by Ruoff group [30]. The mechanism of graphene formation on Cu is different from Ni in which the former one is based on the carbon segregation or precipitation while the later one is based on the surface adsorption process [31]. Due to the low solubility of carbon in Cu the growth of graphene is limited to the Cu surface even at high temperature leading to the production of predominantly single layer graphene [32]. Different metal substrates have been studied for graphene formation such as Cobalt (Co), Ruthenium (Ru) and Iridium (Ir). The mechanism of growing of graphene on these transition metals is the same as the one was discussed for Ni substrate [33].
Besides the type and crystallinity of metal substrate, the quality of graphene obtained relies also on other factors including growth time, hydrocarbon concentration and the cooling rate. For example, different concentration of hydrocarbon and growth time change the thickness of obtained graphene due to the different amount of carbon radicals diffusing in to the Ni substrate [28].
For the majority of the applications, graphene requires to be on a dielectric substrate removing the catalytic metal and transferring the graphene to a proper substrate, while maintaining the graphene quality. This is another challenge that should be taken in to account for optimization of CVD processes. Reaching the high quality and large scale production of
11 graphene, CVD technique still requires several studies and investigations to meet the criteria for electronic and optoelectronic application [34].
Epitaxial growth is another bottom up methods for the fabrication of graphene which is based on the decomposition of carbon-containing substrate. Usually single crystal silicon carbide (SiC) is used as a substrate. At ultra-high vacuum and high temperature around 1300 ºC, silicon atoms are sublimated and leave the carbon atoms behind. Rearrangement and graphitization of these carbon atoms produce graphene sheets. The annealing temperature and the time are effective to control the thickness of graphene layers [35]. Epitaxial graphene films can be patterned using nanolithography techniques making it compatible with current semiconductor technology which is in high demand for electronic devices application [36]. However, the epitaxial graphene layers are not uniform on thickness, due to the different polar faces of SiC.
Controlled preparation of monolayered epitaxial graphene can be achieved on silicon terminated surface of SiC substrate by tuning the experimental condition. Nevertheless, the epitaxial graphene obtained on the carbon terminated surface is mostly containing multilayers and is more challenging to be controlled by tuning the experimental conditions [37]. Figure1.9 [38] shows the growth of the epitaxial graphene on SiC substrate and Figure1.10 [38] resembles the differences of epitaxial graphene growth on different surfaces of SiC.
Figure 1.9 The growth of epitaxial bilayer graphene on Si surface of SiC substrate and its structural models. Blue color shows the carbon atom while red is silicon [38].
12
Figure 1.10 Crystal structure of 6H-SiC and corresponding few layers graphene (FLG) on silicon terminated surface and multilayers graphene (MLG) on carbon terminated surface, blue and red shows carbon and silicon atoms respectively [38].
1.4 Graphene Oxide (GO)
1.4.1 History and fabrication methods (Brodie, Staudenmaier and Hummer’s method)
The well-known example of oxidizing graphite is the work of the British chemist, B.C. Brodie published in 1859. The oxidation method was based on adding potassium chlorate (KClO3) to graphite in fuming nitric acid (HNO3). It was reported an increasing of the weight
of the final product as a result of the addition of hydrogen and oxygen groups to the carbon structure of the graphite [39].
After 40 years another scientist (L.Staudenmaier, 1898) [40] optimized this preparation method by adding of chlorate to the mixture during the reaction process and also using the concentrated sulfuric acid (H2SO4) to the mixture to increase the acidity. The advantage of this
method was obtaining highly-oxidized graphite like as Brodie’s reported but only in one pot reaction preparation [41]. After 60 years two chemists (W.Hummers and R.Offeman, 1958) [42] used a simple and fast procedure for oxidizing graphite. They prepared a mixture of graphite with concentrated H2SO4, potassium permanganate (KMnO4) and sodium nitrate
(NaNO3) maintained for few hours to obtain graphitic oxide. In their method, KClO3 was
13 oxidation process and fuming HNO3 was replaced by sodium nitrate (NaNO3) to avoid fog
acid production [43]. The graphite oxide obtained by Hummers’ method always contain nonoxidized graphite, in order to overcome this inequality, modified Hummer’s method was proposed for the first time by N.I.Kovtyukhova and her group in 1998 [44]. In this method, a pre-oxidation step was used prior to the Hummers’ method. Briefly, the graphite powder was mixed with concentrated H2SO4, potassium persulfate (K2S2O8) and phosphorus pentoxide
(P2O5). The mixture was thermally isolated and cooled down to the room temperature over 6
hours. After dilution with distilled water it was washed and filtered and dried in the air. Modified Hummers’ method, like the others methods, has the disadvantage of producing toxic gases like NO2 and N2O4. Improved Hummers’ method was another process reported by the
group of professor M. Tour (by D.C. Marcano, 2010) [45]. In this procedure, instead of NaNO3 that was responsible for toxic gas production they used phosphoric acid (H3PO4) and
also using higher amount of KMnO4 compared to Hummers’ method. In their study, three
samples HGO, HGO+ and IGO were prepared respectively by Hummers method, modified Hummers’ method and improved Hummers’ method. It was shown that the oxidation degree of the samples is different in the following order, IGO > HGO+ > HGO. Nevertheless, after reduction of IGO and HGO by hydrazine hydrate both samples showed the same electrical conductivity properties. Figure 1.11 shows the experimental conditions for preparation of GO from graphite flakes in Hummers, modified Hummers and improved Hummers method used by Tour group.
Figure 1.11 Representation of three different methods for oxidizing of graphite flakes (GF). Three bottles showing the hydrophobic carbon materials after purification of HGO, IGO and HGO +. The IGO has a lower under-oxidized material
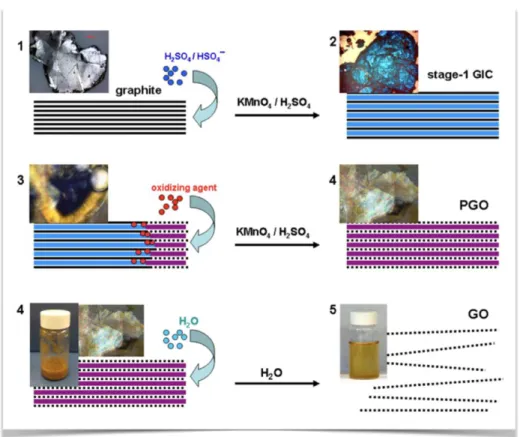
14 Currently the modified Hummers’ method is the most widely used procedure for GO fabrication. Recently A.M. Dimiev [46] proposed a three steps mechanism to explain the formation of GO by modified Hummers’ method (Figure 1.12).
Figure 1.12 Representation of the three steps mechanism of GO formation from graphite flakes with the respective optical images. The black line, blue line, purple line and black dotted line, represents respectively graphene layers, H2SO4/HSO4
-intercalant, a mixture of H2SO4/HSO4
with reduced oxidizing agent and a GO monolayer [46].
The first step is described as a formation of H2SO4– graphite intercalation compound
(GIC) and has the characteristic of deep blue color. This product is obtaining during the first 3-5 min of reaction process. The second step which takes quite longer, like several hours or even days, is the formation of pristine graphite oxide (PGO) from GIC. In this step, the progress of oxidation was studied by gradually adding of 1, 2, 3 and 4 wt% KMnO4 to the
mixture and studies the sample after each part. Obtained optical images of this step showed the chemical reaction is progressed from edge to the center of the flakes as the blue color was disappearing while appearing the yellow color. It was shown that the percentage of the blue
15 region which related to the unoxidized area is bigger in big flakes than the smaller ones. This suggests that the oxidizing progress is different for different flake sizes. Small flakes get oxidized faster than the big ones due to the rapid diffusion of oxidizing agent in to the intercalant molecules packed between graphene layers in GIC in small area. The edge to center oxidation process was also confirmed by Raman investigation of different regions of graphite flake.
The last step includes the reaction of PGO with water and conversion into GO. In this step, the water hydrolyses the covalent sulfate which act as protective groups and further oxidation modification leads to the formation of the final GO.
1.4.2 Chemical structure
A simple definition to describe a GO sheet is a graphene layer with both sides bonded to oxygen groups like carboxyl, hydroxyl and epoxy groups [47]. The GO can be synthesized by oxidation of graphite to graphite oxide and then by exfoliation to GO. The interlayer distance between carbon layers in graphite is 0.335 nm which increases to around 0.7 nm after oxidation. The graphite oxide can be easily exfoliated to GO by stirring or mild sonication. Since the graphite oxide is composed of an accumulation of GO sheets, both material exhibit similar structure. Graphene, or more exactly rGO can be obtained by the further reduction of GO by elimination of the oxygen groups. Despite the old history of GO fabrication, this material got heightened interest as a source of graphene production only after the discovery of graphene in 2004 [48]. Unfortunately, due to the nonstoichiometric atomic composition of GO and the lack of characterization techniques until today, the structure of GO is not fully understood and still is on debate. Some of the early proposed schematic structural models for GO are summarized in Figure 1.13. These models are based on those information obtained by exchange reactions, X-ray diffraction (XRD), electron diffraction and infrared spectroscopy [49].
Hofmann and Holst [50] suggested a model in which carbon plane contains epoxy groups on both sides with the C2O ideal formula. Later on, Ruess [51] proposed another model which contain both
16 Boehm [52] considered a flat carbon layer containing regularly C=C bonds and the carbonyl and hydroxyl groups are as the only oxygen functional groups. Nakajima and co-workers used Fourier transform infrared spectroscopy (FTIR) and carbon-13 nuclear magnetic resonance (13C NMR) characterization to study the structure of GO. They also indicated that after fluorination of GO the resultant showed the same C2F structure by XRD analysis. In this case, they suggested each two
carbon layers are linked together by carbon – carbon sp3 bonds. According to their model the existence of the hydroxyl and carbonyl groups are depends on hydration [53].Lerf and Klinowski proposed their model in 1998 based on their 13C NMR and 1H NMR studies [54].
Figure 1.13 Different earliest models for GO structure (Images are adapted from references [50, 51, 52, 53 and 54]).
This model is the most accepted structure for GO. In this model, the oxidized and unoxidized aromatic rings are spread randomly and oxygen functional groups are on the both sides of GO sheets with the GO layers terminated with C-OH and –COOH groups. Those carbon atoms that attach to OH group have slightly disordered arrangement that cause some wrinkles on the GO. It was also suggested the existence of epoxide (1,2-ether) instead of 1,3- ether which was proposed earlier by Mermoux [49]. It was also explained that the negatively configuration of oxygen groups covering both sides of GO is responsible for preventing the carbon from nucleophilic attack. Depending on the oxidation level, GO has different stoichiometry of its elements. Nonetheless the same set of oxygen functional groups are reported for synthesized GO from different methods [55].
17 Besides of the reported analysis methods that were used for understanding the structure of GO, aberration corrected transmission electron microscopy (AC-TEM) is one powerful technique to study the graphene structure, however in the case of GO it is a challenging technique due to the presence of defects and contaminants that mask the GO surfaces. Another difficulty is the reaction of these contaminants with high energy electron beam resulting changes of GO structure. Kris Erickson [56] studied the local structure of GO using AC-TEM technique. To prepare the proper sample for the macroscopic observation, the GO deposited on a grid was reduced with hydrazine and heated at 550°C in N2 atmosphere to clean the
contaminants. It was shown that the GO consist of three different regions including holes, graphitic regions and disordered areas, see Figure 1.14. The graphitic domains are incomplete oxidation of graphite and disordered areas are continuous containing high contrast resemble the GO region.
Figure 1.14 Aberration corrected TEM image of a single layer of GO. The blue, yellow and red color indicating the holes, graphitic domain and disordered regions with oxygen groups respectively, scale bar denoting 2 nm, adapted from ref [56].
One of the most recent study of GO with AC-TEM was reported by S. H. Dave in 2016 using in situ heating of sample holder up to 700 ºC [57]. It was mentioned that above 500 ºC the contaminants detached and the crystalline and polycrystalline areas were appeared. The existence of long range sp2 lattice structure and isolated defects areas in GO was reported.
18 Figure 1.15 shows closed edges and open edges revealing the disorders in GO which separate the crystalline areas.
Figure 1.15 a) Atomic structure of GO obtained by (AC-TEM) during the heating process at 700 ºC, b)The structure of only one area in (a) that is shown in white the resolved structure [57].
1.4.3 Preparation of rGO
Different processes are used for elimination of the oxygen functional groups from GO structure and restoration of sp2 hybridized domain. However, the fully recovering of graphitic domain from GO is not possible due to the formation of stable carbonyl and ether groups, Stone-Wales defects including heptagons and pentagons pairs and the holes that are by-products of carbon releasing from the structure in the form of CO and CO2 [26]. As a
consequence, rGO shows different properties depending on the oxygen reduction level and structural defects. Determination of C/O ratio in rGO is an important factor that can clarify the level of the reduction. X-ray photoelectron spectroscopy (XPS) is the best-known technique for this purpose. The C/O atomic ratio of fully oxidized GO is reported to be about 2:1 , heating it more than 80 °C changes the composition and increases the C/O ratio [58].
On the other hand, the existence of these minor functional groups can be tuned in order to functionalize the GO providing GO with an extraordinary capability for different applications [59-61]. Regardless of the type of methods used for the reduction of GO to rGO, this material goes under several changes. The most visible one is the change of the color from brownish to black in bulk quantity. The hydrophilic characteristic of GO changing to the hydrophobic property. Moreover rGO become more conductive than GO [26]. The efficiency of GO
19 reduction can be examined by different techniques such as XRD, thermogravimetry and Raman spectroscopy [62].
1.4.3.1 Thermal annealing reduction
Rapid thermal annealing is one strategy to produce bulk quantity of thermally reduced graphene oxide (TRG) from thermal expansion of graphite oxide. Rapid heating (>2000 °C/min) up to 1050 ºC [63] leading to the decomposition of oxygen functional groups in the form of CO and CO2 yielding high pressure between the stacked layers of the graphite oxide.
For exfoliation of graphite oxide, the van der Waals force that keeps the GO layers stacked together should be overcome by this pressure. In other words, the temperature required for this process must exceeds over 550 ºC in order to exfoliation occurrence [64]. The decomposition of oxygen groups produces defects by removing the carbon atoms from basal plane. About 30% weight loss occurring during the thermal annealing of graphite oxide by decomposing of oxygen groups and water evaporation. The need of high temperatures in this method demanding high energy consumption and expensive facilities turns this method not truly practicable. In addition, this procedure is not suitable for some applications, like the preparation of rGO on glass substrate for electronic devices.
Several thermal reduction methods of GO at low temperature has been reported recently. Bin Shen [65] prepared a few layered graphene sheets using HCl at low temperature (130 ºC) and under ambient atmosphere. Obtained graphene sheets were defective with some residual functional sites showing the bulk conductivity of 1200 S m-1 for 0.3 g cm-3 and the BET surface area of about 500 m2g-1, which is lower than pristine graphene sheet. A. Kaniyoor [66] synthesized graphene sheets by reduction-exfoliation method at 200 ºC under hydrogen atmosphere. The BET surface area of obtained graphene reported to be 442.9 m2g1.
Xianjue Chen [67] reported the possibility of GO thin films reduction in the air by rapid thermal annealing. It was suggested that by increasing the environmental pressure through sandwiching the GO film between two quartz slides, it is possible to decompose the oxygen
20 groups at temperatures ranging from 100 ºC to 400 ºC in the air while preserving structural integrity.
1.4.3.2 Chemical reduction
rGO can be chemically produced using reducing agents [68] such as hydrazine monohydrate [69,70], sodium borohydride [71,72] and hydroquinone [73]. The basal plane of GO contains different oxygen groups that make it hydrophilic so it can be exfoliated easily in aqueous solution. One effective method for exfoliation and reduction of graphite oxide is to place it in pure hydrazine solution. Although, the complete elimination of oxygen groups is not possible through this method and besides the number of defects created, a significant restoration of sp2 sites can be achieved [74].
The effect of hydrazine hydrate dosage and reaction time on the reduction of oxygen functional groups were studied by P. Zh [75] using FTIR. Graphite oxide was prepared by Hummer’s method and was exfoliated using ultra-sonication. Furtherly, the single layers of GO were isolated by centrifugation. Different doses of hydrazine hydrate 1, 5, 7 and 10 mg were tested for the reduction of GO. It was shown that efficient reduction was achieved for the higher dosage of hydrazine hydrate. These authors also studied the influence of time on the reduction of oxygen groups. FTIR spectra of samples were collected and investigated after five different reaction times (20, 40, 60, 80 and 100 min). After 20min the peaks of oxygen groups were mostly decreased and it was mentioned that the effective complete reduction was achieved after 80min reaction time. It was shown that the reduction degree increases slowly with the time evolution.
The reduction of GO by hydrazine hydrate under different conditions such as different temperatures and reaction time was investigated by P. Gang Ren [76]. The GO was prepared from modified Hummers’ method suspended in distilled water and mix with hydrazine hydrate with the weight ratio of (HH/GO=1). The reaction was carried out varying temperature (15, 60, 80, 95 ºC) and time (100h, 24h, 3h). The resultant materials were investigated by different
21 characterization techniques. It was concluded that the temperature had a higher impact on the reducing process than the reaction time, see Table 1.1.
Table 1.1 The C/O ratio of rGO obtained under different reduction condition, adapted from reference [76].
On the other hand, a possible reaction mechanism for the reduction of oxygen groups with hydrazine hydrate was suggested by P. Ren [76], see Figure 1.16.
Figure 1.16 Schematic illustration of GO preparation and its reduction with hydrazine hydrate [76].
The majority of oxygen groups are eliminated after chemical reaction but the sp2 graphene domain is not fully recovered. Some parts of rGO still contain functional groups like C-OH and C-H. Also, the existence of C=N bond with N origin from hydrazine was proved by FTIR and XPS data.
The hydrazine reduction of both graphite oxide and exfoliated GO was reported by the group of R. Ruoff [77]. The graphite oxide was synthesized by modified Hummers’ method. For the preparation of the first sample, the graphite oxide was suspended in pure water under ultrasound bath for fully exfoliation of GO. The other sample was graphite oxide that was not further exfoliated like the previous sample. Hydrazine hydrate was added to both suspensions
C/O GO 15 ℃/100h 60 ℃/100h 80 ℃/24h 95 ℃/3h
22 and the products were characterized. It was shown that the degree of reduction for exfoliated GO (C/O=10.2) was higher than for non-exfoliated graphite oxide (C/O=5). The schematic representation of reduction degrees is shown in Figure 1.17.
Figure 1.17 The effect of exfoliation of GO on the reduction degrees [77].
1.4.3.3 Hydrothermal and solvothermal reduction
Hydrothermal/solvothermal process is a powerful, facile and environmental friendly method to synthesize nanomaterials. It is a single pot process that is carried out in a closed system at a temperature close to the boiling point or above it in order to provide high pressure for production crystalline nanostructures. These methods are also applied for the reduction of GO. In hydrothermal method, water is used as a solvent and acts as a source of H+ for protonation of hydroxyl groups [78]. The pH of solution is very important for this method. Highly reduced GO (HRG) is stable in basic solution while in acidic medium the HRG turned to be aggregated.
23 E.C. Vermisoglou [79] studied the effect of reaction time and alkaline media on the electrochemical properties of rGO obtained from hydrothermal reaction. Modified Staudenmaier's method was used for graphite oxide preparation. Hydrothermal synthesis was performed at 180 ºC for different reaction times of 4, 19, 22 and 24 hours, for pH adjustment K2CO3 was used. The higher degree of GO reduction was achieved through the higher reaction
times. Moreover, the sample produced under alkaline media showed less defects and higher BET surface area. Highest capacitance performance was obtained for the sample produced under alkaline media for 19 h heating treatment. It was concluded that by manipulation of different factors in hydrothermal synthesis it is possible to tune the electrochemical performance of rGO.
Only water is used in hydrothermal while in solvothermal method different solvents can be used. So the later one is more favorable for the production of nonoxidized products, nonetheless both methods have shown to be successful in nanomaterials production [80].
Reduction of GO through solvothermal route was studied by H. Wang [81]. Graphite oxide was prepared by modified Hummer’s method. N,N-dimethylformamide (DMF) was used as a solvent (~0.1mg/mL) and hydrazine monohydrate as a reducing agent and the suspension heated at 180 ºC. The effective reduction achieved by this method is the result of more removal of oxygen groups by hydrazine hydrate at high temperature however, the conductivity was poor due to the presence of structural defects.
1.5 Graphene based nanocomposites
The combination of graphene or graphene related materials with appropriate materials like polymers [82-84], organic molecules [85-87] or NPs [88] can give origin to new materials (nanocomposites) which exhibit different properties that arises from each individual components. For example, it was reported that addition of rGO in a Cu matrix improved the strength and enhanced the mechanical performance[89]. Also, the chemical doping of graphene films by AuCl3 can improve the conductivity of graphene films [90]. Because of this,
24 nanocomposite properties. The advantages of graphene-based nanocomposites in several applications such as the Li-ion batteries, supercapacitors, fuel cells, photovoltaic devices and photocatalysis are of the huge importance and some examples will be discussed in the following sections.
1.5.1 Graphene nanoparticles nanocomposites
Due to the oxygen functional groups, GO and rGO are good substrates for nucleation and growth of various metals such as Ag [91], Au [92], Pt [93], Pd [94], Ni [95] or metal oxides such as Fe3O4 [96] or NiO [97] on their surfaces.
Based on the NPs structural morphology the graphene/NPs nanocomposites can be widely classified in two categories. First, graphene NPs nanocomposites in which NPs are grown on GO or rGO sheet with the size of few nm to hundred nm. The second is graphene-encapsulated NPs in which the big NPs are wrapped by graphene or rGO sheet [98]. There are two different routes for loading or binding metal or metal oxide NPs on GO or rGO known as ex situ hybridization and in situ growth, see Figure 1.18 [78]. In ex situ method, graphene or rGO nanosheets or/and NPs are functionalized and synthesized separately. The functionalization can be non-covalent stacking or can be the covalent C-C coupling reaction. This method is suffering from the low density of NPs and nonhomogeneous distribution of NPs [78]. In situ growth, that is most widely used, is based on using the salts containing metal ions as a source of metal NPs and GO as a substrate for their growth. The advantages of this method are the possibility of preparation the high-density NPs nanocomposite on which NPs are homogenously distributed in the composite matrix. There are different methods for in situ fabrication of rGO/NPs such as reduction procedure, hydrothermal or solvothermal methods [98].
25
Figure 1.18 Schematic representation of different preparation of graphene/NPs composites [78].
Reduction procedure is a well-known method for the preparation of graphene/noble metal NPs nanocomposites. Noble NPs such as Ag and Au have unique properties such as biocompatibility and optical properties [99]. These NPs are widely used in the field of nanomedicine [100] , imaging [101] and diagnostic [102] ,[98]. Graphene has a high potential to be used as a support for noble metal NPs [103]. The high interaction between functionalized graphene with noble metals leads to high dispersion of catalysts and enhance the catalytic performance [104]. Noble metal NPs also act as a nano spacer and conductor preventing the agglomeration of graphene sheets, making the two sides of the sheets accessible and improving the conductivity [105]. Combining noble metals with graphene also improve the compatibility. For example GO-Ag composites have lower cytotoxicity and better blood compatibility than Ag NPs alone [106].
26 During the reduction method, the metallic ions present in the salts such as AgNO3 or
K2PtCl4 are reduced by chemical agents like ethylene glycol, sodium citrate or sodium
borohydride. The decoration of rGO taking place in 3 steps: reduction, nucleation and crystal growth. First, the positive charged metal ions are electrostatically attracted by the negatively charged GO, and then by adding the reducing agent it simultaneously reduces the metallic ions and eliminates the oxygen groups. This reduction helps to preserve the 2D structure of rGO. Unlike the easiness and efficiency of the reduction route, this procedure is not promising to control the size and the morphology of NPs which normally present a wide size distribution.
To synthesize inorganic NPs with high crystallinity and narrow size distribution hydrothermal/solvothermal methods are more effective routes. These methodologies are mostly used for synthesizing metal oxide NPs/rGO composites such as Fe3O4 [107] ,TiO2
[108], ZnO [109] , NiO [110]. The high pressure and temperature used in these methods are responsible for the growth of nanocrystals simultaneously with the reduction of GO. The combination of metal oxide with rGO also prevent the restacking of the graphene layers suppressing the agglomeration of particles that enhance the properties of both materials [98].
For example, Fe3O4/rGO nanocomposite prepared by the hydrothermal method showed the
higher electrochemical performance when compared to bare Fe3O4, which could be applicable
in lithium batteries [111].The high conductivity of rGO, nano sized and well distributed Fe3O4
are the main reasons for these properties enhancement.
S. Bai [112] reported the preparation of rGO supported ferrite (MFe2O4, M=Mn, Zn, Co
and Ni) hybrids by one pot solvothermal synthesis route and tested their ability for the removal of organic dyes. It was indicated that when the high adsorption property of rGO is combined with the magnetic and photocatalytic properties of magnetic NPs, it brings the aforementioned criteria for environmental application. The size and size-distribution of NPs were adjusted by tuning the metal ion concentration. The high adsorption performance was achieved due to the high rGO surface area and high electrostatic interaction between dyes pollutants and rGO sheets. Considerable saturation magnetization also made possible that the hybrids could be harvested by a magnet after using.
27 The structure of the NPs obtained by hydrothermal/solvothermal method depends on different reaction parameters such as temperature, reaction time, solvent and reductant effect [113].
For example, the preparation of three different TiO2/graphene nanosheets structures was
reported by Z. He [114]. 12 nm spherical TiO2 graphene sheets (STG), ultra-small 2 nm TiO2
graphene nanosheets (USTG), and TiO2 nanorod–graphene nanosheets (NRTG) were simply
synthesized by adjusting the experimental conditions in one pot solvothermal method, see figure 1.19. This example shows the potential of the solvothermal method to control the NPs size by adjusting the reaction parameters.
Figure 1.19 Different experimental conditions to synthesize different TiO2/graphene nanosheets structure [114].
1.5.2 Graphene based nickel compound (nickel hydroxide, nickel oxide, nickel) nanocomposite
Nickel compounds have gained interest due to its multifunctional properties and can be used in different areas such as batteries [115], catalysts [116] and capacitors [117].
1.5.2.1 Reduced graphene oxide/ nickel hydroxide nanocomposite
Ni(OH)2 is a promising anode material for supercapacitors due to its layered structure with
large interlayer spacing and well defined electrochemical redox activity. It showed higher specific capacitance than traditional electrode material like RuO2 related to pseudocapacitive

![Figure 1.7 Schematic representation of a) pure graphene, individual GO layer with different functional groups and single layer of rGO; b) preparation of rGO via chemical exfoliation of graphite [26]](https://thumb-eu.123doks.com/thumbv2/123dok_br/15740611.1072511/33.918.179.798.151.498/schematic-representation-graphene-individual-different-functional-preparation-exfoliation.webp)
![Figure 1.10 Crystal structure of 6H-SiC and corresponding few layers graphene (FLG) on silicon terminated surface and multilayers graphene (MLG) on carbon terminated surface, blue and red shows carbon and silicon atoms respectively [38]](https://thumb-eu.123doks.com/thumbv2/123dok_br/15740611.1072511/36.918.252.717.126.392/crystal-structure-corresponding-graphene-terminated-multilayers-terminated-respectively.webp)
![Figure 1.17 The effect of exfoliation of GO on the reduction degrees [77].](https://thumb-eu.123doks.com/thumbv2/123dok_br/15740611.1072511/46.918.218.698.254.600/figure-effect-exfoliation-reduction-degrees.webp)
![Figure 1.18 Schematic representation of different preparation of graphene/NPs composites [78]](https://thumb-eu.123doks.com/thumbv2/123dok_br/15740611.1072511/49.918.167.767.146.595/figure-schematic-representation-different-preparation-graphene-nps-composites.webp)