UNIVERSIDADE DE LISBOA
FACULDADE DE CIÊNCIAS
DEPARTAMENTO DE FÍSICA
Multimodal MRI analysis of the whole brain connectome of
apathy in cerebral small vessel disease
João Pedro Fernandes Peixoto
Mestrado Integrado em Engenharia Biomédica e Biofísica
Perfil em Engenharia Clínica e Instrumentação Médica
Dissertação orientada por:
Ph.D. Michele Veldsman
Professor Alexandre Andrade
Acknowledgements
The end is the best place to begin. As I turn the last pages of this huge chapter of my life, some people whom I deserve gratitude cross my mind.
Firstly I must acknowledge Michele for all her patience and guidance throughout this year. With her I learnt a lot. Moreover, would like to show my appreciation to the cognitive neurology lab, especially to Professor Masud Husain and all friends I’ve made in there, for the confidence trusted upon me and for establishing such a brilliant work environment.
I must also acknowledge Professor Alexandre Andrade for his excellent support and tutelage across the years.
Thanks mom and dad, for ensuring my survival abroad, both financially and emotionally -you’re the best.
Thank you to all my friends, close or far, that always supported my endeavours and made my days so much better. All dinners, beers, cycles, climbs, talks and silences are the best memories. Finally, I would like to show my appreciation to the support of the Erasmus+ program of the European Union for my internship abroad.
Abstract
Although human studies have identified the neural mechanisms of motivated behaviour, which part of its circuitry is actually being disrupted in disease is not yet well understood. Primarily, the literature has associated apathy with reduced white matter integrity, however, the relation-ship between structural and functional brain changes hasn’t been studied extensively in apathy. To address this concern, we’ve developed a comprehensive whole-brain magnetic resonance neu-roimaging pipeline with which we’ve analysed two populations of cerebral small vessel disease (CADASIL, n = 19; sporadic SVD, n = 104). We’ve looked at the association between apathy and reduced white matter integrity, making use of tract-based spatial statistics; reduced grey matter volume with voxel-based morphometry; and reduced functional connectivity with a novel dynamic approach (Leading Eigenvector Dynamic Analysis). Furthermore, this project then aims at tying the neuroimaging findings with the parameter estimates of reward and effort sen-sitivity extracted through computational modelling of an effort-based decision-making task. Our results show that apathy is associated with reduced white matter integrity (reduced fractional anisotropy) of specific regions (particularly the corpus callosum and the anterior cingulum). Reduced grey matter volume of the occipital lobe seems to be associated with apathy, despite not being shown by any literature. Moreover, our results indicate that apathetic patients are associated with a weaker and more incoherent repertoire of functional connectivity than their non-apathetic counterparts. Functional connectivity associated with vmPFC regions and the occipital lobe is reduced in apathy. This shows a strong association between structural and functional changes in the brain. Apathetic patients seem to be characterised by a reduction in reward and effort sensitivity, which is associated with impaired functional connectivity. This study is a unique contributor to the understanding of the neural underpinnings of apathy in cerebral small vessel disease due to the uncommon combination of MRI modalities and relation between consequent structural and functional metrics. However, a lot more has to be done to fully understand the mechanisms of this syndrome and to extract clinically useful markers and therapies.
Keywords: Cerebral small vessel disease, CADASIL, apathy, whole-brain MRI, structural
Resumo
A revolução dos cuidados médicos do século XX e XXI possibilitou, nas últimas décadas, um crescimento sem precedente na esperança média de vida da população global. Porém, in-dependentemente destes avanços na área da saúde, problemas associados ao declínio da função cognitiva permanecem um problema sem solução à vista. Este declínio é comummente associado ao envelhecimento. No entanto, problemas de função cognitiva são consequência de uma miríade de condições que afetam a população ao longo de todas as faixas etárias, com sintomas distintos, com grande variabilidade entre sujeitos. Demência é um termo com uma definição ampla, sendo que é caracterizada pela combinação de sintomas associados ao declínio de função cognitiva, cuja severidade conduz a uma redução de qualidade de vida. Por este motivo, a patofisiologia que con-duz a demência é vasta, sendo que a sua progressão está associada a diversos fatores e condições. A segunda causa mais comum de demência é demência vascular, constituindo 15% dos casos diag-nosticados (ficando apenas atrás da doença de Alzheimer). Este tipo de demência é definido pela sua associação a uma redução de fluxo nos vasos sanguíneos do cérebro. O maior contribuidor ao desenvolvimento de demência vascular é doença dos pequenos vasos cerebrais. É uma condição caracterizada pela ocorrência de enfartes lacunares, lacunas, espaços periventriculares, microhe-morrogias e lesões da matéria branca. Esta condição pode estar associada ao envelhecimento e problemas de hipertensão (forma esporádica) ou pode resultar de uma mutação genética do gene NOTCH3 (forma genética, ou CADASIL). Ambas se demonstram de formas muito semelhantes, sendo que uma idade mais baixa nos pacientes hereditários esta associado a uma patologia mais limpa (com menos prevalência de outras condições) e por isso é encarado como um modelo puro desta doença. Um dos sintomas mais comuns e mais debilitantes da doença dos pequenos vasos cerebrais é apatia. Esta síndrome é definida como uma redução de motivação no comporta-mento do individuo (quando comparado com o seu passado) e está fortemente associada com a redução de qualidade de vida. Estudos em animais e em humanos saudáveis possibilitaram a compreensão aproximada de quais os mecanismos neurais associados com o comportamento motivado. Estes foram amplamente estudados e é aceite que possa ser caracterizado por três sistemas individuais: o primeiro sistema determina o valor subjetivo do ambiente em termos dos potenciais ganhos hedónicos e custos (sistema que envolve a parte ventral do corpo estriado e o córtex prefrontal médio); em segundo lugar, um sistema dopaminérgico (com origem na área tegmental ventral do cérebro) atua como mediador para um último sistema que age sobre o ambiente em busca de recompensas positivas (parte dorsal do corpo estriado e a parte média do giro do cíngulo). Embora este mecanismo seja conhecido, não é consensual quais as partes do sistema interrompidas ou danificadas que causam problemas neste comportamento motivado. Sendo uma condição mal estudada, a apatia em doença dos pequenos vasos abre a possibilidade a várias questões – quais as alterações estruturais associadas a apatia? Quais as alterações fun-cionais? Qual a relação entre as alterações? Poderá o comportamento apático servir como um bom marcador de progressão de demência vascular? Neste sentido, com o objetivo de estudar as alterações e relações entre a estrutura e função do cérebro na presença de apatia, foi criada uma pipeline de analise de ressonância magnética que visa adquirir métricas sobre a integridade da
dos mais, foi também estudada a relação entre as alterações cerebrais e parâmetros de sensibil-idade a recompensa e esforço obtidos através da modelação computacional de uma experiência comportamental. No âmbito deste estudo, foram recrutados 19 pacientes com CADASIL (forma hereditária de doença dos pequenos vasos cerebrais). Deste grupo, devido a incapacidade de completar a visita de ressonância, 2 participantes foram excluídos, sendo que 17 pacientes foram incluídos em todo o estudo. Foram também recrutados 104 pacientes com a forma esporádica de doença dos pequenos vasos cerebrais (associada ao envelhecimento e hipertensão). Deste segundo grupo, devido a ruído excessivo na aquisição de imagem ou complicações com o scan aquando a altura da visita, foram apenas incluídos 65 pacientes. A experiência comportamental foi completada por todos os pacientes e requeria que o doente realizasse decisões sequenciais sobre aceitar ou não uma certa recompensa (representada pelo número de maçãs numa árvore desenhada – sendo que cada maçã se traduzia num valor monetário de 1p) em troca de exercer uma certa quantidade de esforço – exercer certo nível de pressão num dinamómetro de mão, até a um máximo de 80% da capacidade máxima voluntária de cada sujeito. Os graus de recompensa e de esforço foram parametricamente controlados, igualmente distribuídos num espaço de 36 condições (6 níveis de recompensa x 6 níveis de esforço) e pseudo-aleatoriamente apresentados aos participantes. Todos os participantes realizaram um bloco de decisões, onde exploraram todo o espaço de condições para treino. Os dados de ressonância magnética foram adquiridos no mesmo scanner, recorrendo ao mesmo protocolo, para que não houvesse qualquer diferença entre os dados de cada participante. Primeiramente, os dados adquiridos foram pré-processados de forma a eliminar a maior quantidade de ruído possível. A primeira análise realizada consis-tia em comparar a integridade das fibras de matéria branca através dos parâmetros de difusão do fluido que neles se encontra. Mais especificamente, foi utilizada TBSS (tract-based spatial
statistics), uma ferramenta integrada no pacote de software FSL, para comparar os valores de
anisotropia de difusão das fibras. Seria esperado observar uma redução de anisotropia no grupo de pacientes com apatia face a sua contraparte não apática. Em segundo lugar, os volumes de matéria cinzenta foram comparados, não só com o objetivo de verificar uma redução entre o grupo apático e o grupo não apático, mas também de averiguar se as regiões afetadas por esta redução coincidiam com as regiões de redução de anisotropia das fibras de matéria branca. Esta análise estrutural realizou-se utilizando VBM (voxel-based morphometry). Em último lugar avaliou-se a conectividade funcional. Esta foi aferida de duas abordagens distintas: em primeiro lugar, utilizou-se uma metodologia que não considera a existência de flutuações de conectividade funcional ao longo da aquisição dos dados (dual regression) e uma que tinha por base a relevância da sua flutuação ao longo da aquisição para a compreensão da conectividade funcional (Leading
Eigenvector Dynamics Analysis). Todos os modelos estatísticos aplicados foram controlados com
covariáveis sem interesse (idade, género e dano causado na matéria branca) e corrigidas para erros de comparações múltiplas.
matéria branca em certas regiões (especificamente no corpo caloso e no cíngulo anterior). Por outro lado, mostram também que o comportamento apático está associado a uma redução de volume da matéria cinzenta em regiões do lobo occipital na população de CADASIL, sendo que o mesmo não foi observado na versão esporádica. É interessante constatar que os nossos resul-tados parecem indicar uma associação entre a integridade da matéria branca e a degeneração da matéria cinzenta. Além do mais, os resultados demonstram enfraquecimento da conectivi-dade funcional. Estas alterações funcionais parecem ser parcialmente derivadas das alterações estruturais, porém, não são totalmente moduladas por estas. Estes resultados não só fortalecem o argumento de que o conectoma funcional não é inteiramente definido pela anatomia cerebral, mas também que métricas de conectividade funcional podem ser marcadores úteis de diagnós-tico de doença e podem conduzir a novas aplicações para tratamento de apatia. Embora as suas limitações sejam evidentes (como por exemplo o número reduzido de sujeitos por grupo, resolução do protocolo de imagem) e bastantes ideias tenham ficado por explorar (por exemplo, o impacto da severidade da condição nos conectomas), este estudo é um primeiro exemplo da utilidade da informação obtida aquando do estudo dos conectomas estruturais e funcionais em simultâneo. É também pioneiro na apresentação do conceito de uma rede funcional ligada a um comportamento motivado.
Keywords: Doença dos pequenos vasos cerebrais, CADASIL, apatia, whole-brain MRI,
Contents
Acknowledgements iii
Abstract v
Resumo vii
List of Figures xiii
List of Tables xv
List of Abbreviations xvii
1 Introduction 1
1.1 Cognitive impairment, vascular dementia and cerebral small vessel disease . . . . 1
1.2 Pathology of cerebral small vessel disease . . . 3
1.3 Apathy and the neural mechanisms underlying motivated behaviour . . . 4
1.4 MRI and neuroimaging findings . . . 6
1.4.1 dMRI and structural connectome . . . 7
1.4.2 Resting state fMRI and functional connectivity . . . 8
1.4.3 Neuroimaging findings of apathy in cerebral SVD . . . 9
1.5 Overview of the Thesis . . . 9
2 Methods 11 2.1 Ethics . . . 11
2.2 Demographics . . . 11
2.3 Disease and cognitive measures . . . 12
2.4 Effort-based decision-making behavioural experimental design . . . 12
2.5 Neuroimaging data acquisition . . . 14
2.6 Neuroimaging data analysis . . . 14
2.6.1 MRI distortions correction . . . 18
2.6.2 White matter hyperintensity load extraction . . . 20
2.6.3 Tract Based Spatial Statistics . . . 20
2.6.4 Voxel-based morphometry . . . 21
2.6.5 fMRI denoising . . . 22
2.7 Statistical analysis of the data . . . 27
2.7.1 Cognitive assessment statistics . . . 27
2.7.2 Behavioural experimental statistics . . . 28
2.7.3 Imaging statistics . . . 28
2.7.4 Combined neuroimaging and behavioural statistics . . . 28
3 Results 29 3.1 Apathetic behaviour . . . 29
3.2 Tract-based spatial statistics . . . 36
3.3 Voxel-base morphometry . . . 37
3.4 Functional connectivity . . . 38
3.5 Computational modelling and relation to neuroimaging findings . . . 39
3.6 Summary of the results . . . 53
4 Discussion 55 4.1 Study limitations . . . 57
4.2 Future work . . . 58
5 Conclusions 59
Bibliography 61
A Appendix: LEiDA: full results 67
List of Figures
1.1 Dementia Prevalence. . . 2
1.2 Neuroimaging SVD markers. . . 3
1.3 Motivated behaviour network schematic. . . 5
1.4 Motivated behaviour network. . . 6
1.5 MRI modalities. . . 7
1.6 Human structural connectome. . . 8
2.1 Behaviour experiment trial example. . . 13
2.2 Behaviour experiment decision space. . . 13
2.3 Bias field example. . . 19
2.4 Susceptibility field example. . . 19
2.5 BIANCA application. . . 20
2.6 TBSS pipeline. . . 21
2.7 VBM pipeline. . . 22
2.8 pICA model. . . 23
2.9 fMRI signal denoising. . . 24
2.10 Dual regression pipeline. . . 25
2.11 Leading Eigenvector Dynamics Analysis pipeline. . . 27
3.1 ACE boxplot. . . 30
3.2 Cantril boxplot. . . 31
3.3 BDI boxplot. . . 32
3.4 AES and LARS correlation. . . 33
3.5 Proportion of offers accepted. . . 34
3.6 Difference in offers accepted. . . 35
3.7 TBSS: CADASIL. . . 37
3.8 TBSS: Sporadic SVD. . . 38
3.9 VBM: CADASIL. . . 39
3.10 Resting state networks. . . 40
3.11 LEiDA state1: CADASIL. . . 41
3.12 LEiDA state1: sporadic SVD. . . 42
3.13 LEiDA state4: CADASIL. . . 43
3.17 LEiDA state13: CADASIL. . . 47
3.18 LEiDA state14: CADASIL. . . 48
3.19 LEiDA state7: sporadic SVD. . . 49
3.20 Global incoherence reward sensitivity correlation. . . 50
3.21 Occipital coherence reward sensitivity correlation. . . 51
3.22 vmPFC coherence reward sensitivity correlation. . . 52
A.1 Full LEiDA: CADASIL. . . 67
A.2 Full LEiDA: Sporadic SVD. . . 68
List of Tables
1.1 Subtypes of vascular disease . . . 2
1.2 Prevalence of apathy as a symptom of different types of conditions . . . 4
2.1 CADASIL group demographics. . . 11
2.2 Sporadic SVD group demographics. . . 12
2.3 MRI parameters of the structural sequences . . . 15
2.4 MRI parameters of the dMRI sequences . . . 16
2.5 MRI parameters of the resting-state fMRI sequence. . . 17
3.1 Results of the cognitive assessment questionnaires of the CADASIL group . . . . 29
3.2 Results of the cognitive assessment questionnaires of the sporadic SVD group . . 30
3.3 Computational modelling parameter estimates of the CADASIL patient group. . 36 3.4 Computational modelling parameter estimates of the sporadic SVD patient group. 36
List of Abbreviations
BOLD Blood Oxygenation Level Dependent
CADASIL Cerebral Autosomal Dominant Arteriopathy w/ Subcortical Infarcts and Lleukoencephalopathy FA Fractional Anisotropy
LEiDA Leading Eigenvector Dynamics Analysis
MELODIC Multivariate Exploratory Linear Decomposition into Independent Components MRI Magnetic Resonance Imaging
TBSS Tract-Based Spatial Statistics SVD Small Vessel Disease
VBM Voxel-Based Morphometry WMH White Matter Hyperintensity
1 Introduction
1.1 Cognitive impairment, vascular dementia and cerebral small
vessel disease
Paradigm-shifting advances in the medical sciences seen in the last decades have allowed an unprecedented improvement in the general population’s quality of life. However, despite the increased quality of mainstream healthcare and lifestyle practices, decline of brain function is still an issue with an elusive solution. Although it’s usually associated with life’s later stages, cognitive impairment can be brought about through a myriad of neurological disorders, which affect populations across all age groups. As such, these neurological disorders have been of growing concern of the XXI century healthcare.
Dementia is a broad concept, which describes a set of symptoms associated with an ongoing decline in brain function (including, among others, memory loss, difficulties in thinking, mo-tivated behaviour, problem-solving or language) and which impair the patient’s quality of life. The pathophysiology of dementia is quite diverse [1], and a myriad of conditions contribute to its progression. Moreover, these conditions often happen simultaneously, with big inter-subject variability and with different patterns from one disorder to the other. As such, the origins of dementia have been widely studied in order to understand their mechanisms, with the hopes of generating treatment alternatives for such conditions. Vascular dementia is no exception and, as such, its roots aren’t yet totally understood; however, a major feature of this condition is the reduced blood flow to the brain driven by pathology of the vessels. Studies of vascular dementia show it is the second most common cause of dementia after Alzheimer’s disease (Figure 1.1) [2], making up around 15% of diagnosed dementia cases, estimating to affect 150.000 individuals just in the UK alone [3].
Vascular dementia shows a broad spectrum of cognitive changes which vary based on which neural circuitry is affected by the different vascular pathologies (Table 1.1). Due to damage being frequently present in the areas of the frontal striatum, deficits in attention, information processing and motivation are often seen [5], [6].
However, the major contributor to the occurrence of vascular dementia is cerebral small vessel disease (cerebral SVD). This refers to a group of pathological processes with various origins that affect the small arteries, arterioles, venules and capillaries of the brain. There are different types of cerebral SVD and a simplified classification can separate it into a sporadic (related to
Figure 1.1: Prevalence of different types of dementia in the general population [4].
Table 1.1: Subtypes of vascular disease contributing to vascular dementia. Adapted from OBrien2015
Imaging and pathological changes in vascular dementia
Cortical vascular disease Multiple cortical infarcts
Small vessel disease Lacunes, extensive white matter lesions, infarcts, demyelination Strategic infarct disease Infarct in strategic location
(e.g. thalamus)
Hypoperfusion disease Watershed infarcts, white matter lesions
Genetic small vessel disease (CADASIL)
Multiple lacunes, white matter
lesions, temporal lobe white matter affected Alzheimer’s disease with
cardiovascular disease
Combination of vascular changes
and atrophy, especially medial temporal lobe, mixture of vascular and degenerative pathology
1.2. Pathology of cerebral small vessel disease
Figure 1.2: Key imaging characteristics of features of cerebral small vessel dis-ease. A) lacunar infarct, B) lacune, C) white matter hyperintensities, D) microb-leeds. Taken from [16].
aging and hypertension) SVD and a genetic form of SVD (e.g. CADASIL - cerebral autosomal dominant arteriopathy with subcortical infarcts and leukoencephalopathy) [7].
1.2 Pathology of cerebral small vessel disease
The main imaging features of cerebral SVD include acute lacunar (or small subcortical) infarcts or haemorrhages, lacunes (fluid-filled cavities thought to show old infarcts, many clinically silent) [8], white matter hyperintensities [9], perivascular spaces [10], microbleeds [11] and brain atro-phy [12]. Additional damage is detectable with diffusion tensor imaging and shows altered white matter integrity, disrupted axonal connections, and altered myelination (Figure 1.2) [13]. Cerebral small vessel disease is responsible for around 25% of all ischemic strokes, as well as a considerable amount of encephalopathy. Cerebral SVD is often tied to several domains of cognitive impairment, however a common hallmark to both the sporadic and genetic version is apathy [14], [15].
Sporadic cerebral SVD is a phenomenon that’s common with aging and which risk is increased by hypertension and diabetes. White matter lesions often occur in the brain after the 65 years of age. The pathophysiology and imaging features of the genetic form of SVD – CADASIL – are very similar to those of sporadic SVD. However, on the other hand, CADASIL is prominent in a younger population. This means that CADASIL patients often lack other comorbidities due to aging seen in sporadic forms of SVD. As consequence, CADASIL can be seen as a model of pure vascular pathology. Moreover, CADASIL patients tendentially show a more variable pattern of white-matter lesions. CADASIL is a condition derived from the mutation of the NOTCH3 gene (Notch homolog 3). Mutation of this gene alter the number of cysteine residues of the NOTCH3, which accumulate in the small vessels of affected individuals.
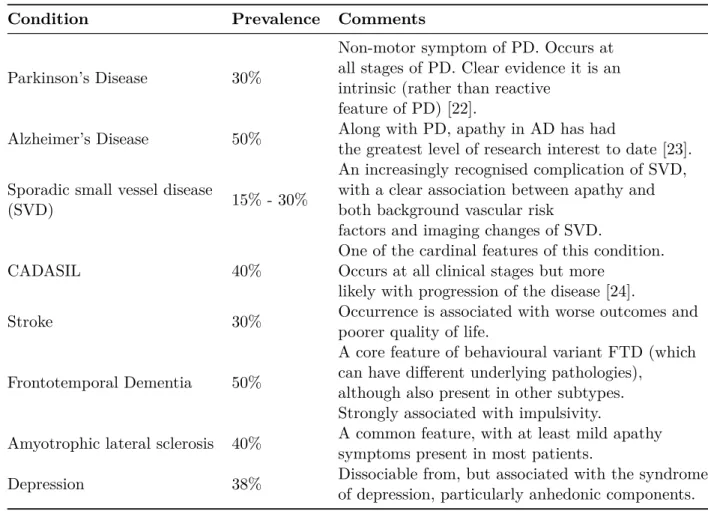
Table 1.2: Prevalence of apathy as a symptom of different types of conditions. Adapted from [25]
Condition Prevalence Comments
Parkinson’s Disease 30%
Non-motor symptom of PD. Occurs at all stages of PD. Clear evidence it is an intrinsic (rather than reactive
feature of PD) [22].
Alzheimer’s Disease 50% Along with PD, apathy in AD has had
the greatest level of research interest to date [23]. Sporadic small vessel disease
(SVD) 15% - 30%
An increasingly recognised complication of SVD, with a clear association between apathy and both background vascular risk
factors and imaging changes of SVD.
CADASIL 40%
One of the cardinal features of this condition. Occurs at all clinical stages but more
likely with progression of the disease [24].
Stroke 30% Occurrence is associated with worse outcomes and
poorer quality of life.
Frontotemporal Dementia 50%
A core feature of behavioural variant FTD (which can have different underlying pathologies),
although also present in other subtypes. Strongly associated with impulsivity.
Amyotrophic lateral sclerosis 40% A common feature, with at least mild apathy symptoms present in most patients.
Depression 38% Dissociable from, but associated with the syndrome of depression, particularly anhedonic components.
1.3 Apathy and the neural mechanisms underlying motivated
behaviour
Apathy is a common syndrome that occurs across a range of neurological and psychiatric dis-orders (Table 1.2). It has been conceptualized as a behavioural syndrome of loss of motivation when compared to a patient’s previous level of functioning [17]. It has been extensively associ-ated with reduced quality of life [18] and thus it has been widely studied in many conditions. It has been highly studied in the domains of Alzheimer’s and Parkinson’s disease, however, their mechanisms in small vessel are still illusive [19]. A richer understanding of the cognitive and neural mechanisms of apathy in cerebral SVD might potentially be of importance for the development of future therapies and its use as a biomarker of developing vascular dementia.
Motivated behaviour is characterised by an active effort to pursue and obtain rewards. The literature provides insights that indicate that this behaviour is comprised of three fundamental neural processes (Figure 1.3) [20]. Firstly, an internal system determines the subjective value of events in the environment in terms of their hedonic gain as well as their potential costs
1.3. Apathy and the neural mechanisms underlying motivated behaviour
Figure 1.3: Conceptual framework and brain basis of motivated behaviour. A valuation system computes the subjective value of the current and potential events. A mediating system integrates this information to activate the motor system to-wards particular goals. A motor system produces behaviour toto-wards motivation-ally relevant stimuli. These processes are instantiated within a complex network of reciprocally connected cortical and subcortical brain regions, under the influence of the mesolimbic dopaminergic system.
(e.g. physical or cognitive effort, temporal proximity). Secondly, a mediation system activates behaviour towards particular goals. Lastly, an action system must act on the environment in order to pursue positive outcomes.
Previous studies on motivated behaviour have identified that the value system includes areas such as the ventral striatum, VS, (including the nucleus accumbens, NAc, and the ventral-rostral putamen) and the ventromedial prefrontral cortex, vmPFC, (which includes the most rostral areas of the anterior cingulate cortex, ACC, and adjacent areas of the medial orbitofrontal cortex, OFC) [21]. There is evidence that the VS mediates a process of conditioning learning, in which current states of the environment predict future rewards [22]. On the other hand, the hallmark of vmPFC function is its flexibility: although activity within it is also sensitive to the subjective value of the events, there is evidence that this activity varies dynamically, as if values are being reassessed at each instant [21], [23]. This flexibility appears to support rapid shifts in preference. Once computed in the first system, the information of value must be translated into appropriate behavioural responses. The neural circuitry underlying this mediating system is complex and distributed. However, it is widely accepted, in behavioural neuroscience, that both the VS and ACC serve as crucial interfaces, under the influence of the mesolimbic dopamine system, which originates in the ventral tegmental area of the midbrain. Although dopamine is a key modulator, it is acknowledged that other neurotransmitter systems may also play a role
Figure 1.4: Diagram of the brain areas involved in the motivated behaviour pathways. Adapted from [25].
[24].
Finally, the production of behaviour is mediated by the posterior mid-cingulate cortex and dorsal striatum. Although conceptually useful for understanding the different components con-tributing to motivated behaviour, it is unlikely that the proposed systems exist as discrete entities within the brain.
1.4 MRI and neuroimaging findings
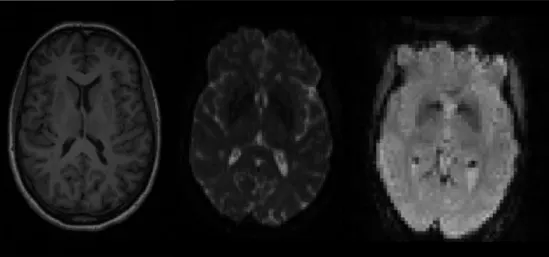
Understanding the neural basis of apathy may lead to novel approaches for prediction, diagnosis or treatment. For this, studying the anatomy and function of the brain and comparing it across patient populations is essential. As such, magnetic resonance imaging (MRI) can be employed. This imaging technique is a very powerful and versatile method with the ability to safely and non-invasively measure a wide range of properties of the living brain. The great flexibility of MRI arises from the myriad of ways in which it can be used to manipulate and measure signals from tissues. There is a wide variety in the modalities of images that can be acquired on an MRI scanner, which allow to capture different information about the brain. However, there are three modalities that are by far the most commonly used in neuroimaging research: structural, diffusion and functional imaging (Figure 1.5).
The first, structural imaging, provides information about gross anatomical structures in the brain (e.g. showing boundaries of the cerebral cortex). The second modality, diffusion imaging, diffusion weighted imaging or diffusion MRI (dMRI), provides information about the microstruc-ture and anatomical connectivity within the brain (by measuring the diffusivity of fluid inside white matter tracts). The third, functional imaging, or functional MRI (fMRI), provides infor-mation about the activity of neurons in the brain by measuring fluctuations in deoxyhemoglobin concentration linked to neural activity - the so-called blood oxygenation level dependent (BOLD)
1.4. MRI and neuroimaging findings
Figure 1.5: Examples of the three most commonly used MRI modalities. From left to right: structural T1-weighted imaging, diffusion weighted imaging and func-tional imaging.
effect - either in response to specific stimuli or tasks (task fMRI) or in relation to the spontaneous activity of the neurons (resting state fMRI).
1.4.1 dMRI and structural connectome
In a general perspective, the white matter is composed of several tracts that spread across the brain and that communicate with each in different networks, simultaneously serving different purposes and processes. To understand the functioning of a network, one must first get to know its elements and their relations. To that end, the development of advanced tractogra-phy algorithms applied to dMRI (which make use of the estimates of water and CSF diffusion coefficients) has allowed the detection, non-invasively, at the whole-brain level or of specific regions, of white matter fibre tracts connecting brain areas [26], [27]. This knowledge allowed for the construction of large-scale networks reflecting the anatomical connectivity of the brain. Furthermore, it provided mechanistic insights into how the brain function is affected by the disruption of its structure. The structural connectome is most often represented as a combi-nation of anatomically distinct brain regions and the neural pathways that link them. Despite the lack of a single universally accepted parcellation scheme, this is the most feasible organisa-tional level for the human connectome. Considering this macro-scale of brain parcellations, the structural connectome of healthy adults remains relatively stable when compared to the rapid changes occurring at the functional level. Structural alterations occurring at this macro-scale, either associated with the brain’s natural development of ageing or in disease, are typically slow [28]. Drastic changes in this connectome are usually associated with disease. Note, how-ever, that the entire map of neural connections ambitioned by the Human Connectome Project (www.humanconnectomeproject.org) may reveal higher individual variability and changes over shorter time-scales.
Figure 1.6: White matter fiber architecture of the brain. Measured from dif-fusion spectral imaging (DSI). The fibers are color-coded by direction: red = left-right, green = anterior-posterior, blue = through brain stem. Taken from humanconnectomeproject.org.
1.4.2 Resting state fMRI and functional connectivity
Resting state fMRI uses the same type of MRI acquisition as task fMRI, the only difference being that the participant is not asked to perform any specific task. Then, the signal in these resting state scans reflects spontaneous brain activity; and it is the coactivation between different locations that provides a measure of functional connectivity. In the last two decades, since the seminal discovery of synchronous brain activity despite the absence of a task or stimulus, resting-state fMRI has shed new light on the spatiotemporal organisation of spontaneous brain activity. Ever since, countless studies have been produced aiming at understanding the functional connectome – the map of correlations of neural activity across the brain. These, in spite of being based on the structural connectome, seem to transcend it, as it has been shown that different brain areas, not structurally connected, show functional coactivation [29]. In the beginning, it was considered that the functional connectome did not significantly change over time (as it was with the structural connectome) and thus, its analysis was done in a static perspective (taking an average of the signal over the acquisition time). However, recent neuroimaging studies have shown that meaningful large-scale functional networks fluctuate over time, from correlations with the BOLD signal, implying that measures assuming stationarity of over a full resting-state acquisition may be too simplistic to capture the full extent of brain activity [30]. Furthermore, interestingly, the expanding idea is that functional connectivity evolves as a multi-stable process, passing through multiple and reoccurring discrete functional states, rather than varying in a more continuous sense. These initial findings have raised several questions about the nature of brain dynamics and their implications on behaviour and disease and thus, a body of research has rapidly blossomed to investigate the now coined functional connectivity dynamics.
1.5. Overview of the Thesis
1.4.3 Neuroimaging findings of apathy in cerebral SVD
Two whole brain diffusion studies, one with 121 and the other with 331 sporadic SVD patients have shown apathy is associated with reduced integrity of white matter tracts of cingulate and thalamic regions. In contrast, no significant results were obtained when depression was used as a regressor of interest [32], [33]. Moreover, a recent study, combining behavioural and diffusion imaging paradigms has investigated apathy in the genetic form of SVD – CADASIL. This study, using a seed-based tract-based spatial statistics analysis provided evidence that linked impair-ment of motivated behavioural to a decrease in integrity of white tracks in regions of importance to the motivated-behaviour system (e.g. left anterior cingulum, bilateral orbitofrontal-anterior cingulate white matter tracts) [20]. Together, these studies seem to provide sufficient evidence of the link between reduced white matter integrity in specific regions and apathy in cerebral SVD (sporadic and genetic). In CADASIL, a study looked at cortex morphology and how it changed with apathy. Such study shows that the morphology of the mediofrontal and orbitofrontal cor-tices are altered in apathetic patients, (reduction of sulcal depth), however no modifications of the cortical thickness are shown. These results orientate toward underlying mechanisms distinct from the reduction of cortical thickness and suggest that other processes are involved in these cortical morphologic alterations, such as reduction of cortical surface due to disappearance of intracortical columns [34]. However, literature indicates that cortical surface, cortical thickness and grey matter volume change at different rates and with age and disease [35], [36]. It also seems to provide evidence that different cortical measures have different sensitivity to pathology [37], [38].
Functional connectivity has been demonstrated to be disturbed in CADASIL patients and related to cognitive impairment when compared to healthy controls [39]. Moreover, disrupted functional connectivity has been shown to be driven by apathy in certain pathologies [40], [41]. However, to the best of our knowledge, the mechanisms of functional connectivity and the implications grey and white matter changes have on it have not been studied in apathy related to cerebral SVD.
1.5 Overview of the Thesis
This dissertation reflects the work of a 9-month project comprised of an internship at the Cog-nitive Neurology Centre (CNC) of the University of Oxford, in the United Kingdom, led by Professor Masud Husain, under the supervision of PhD Michele Veldsman and in collaboration with the Hedonia: Translational Research Group, led by Professor Morten Kringelbach. //
Based on previous literature about the neural mechanisms of apathy, cerebral small vessel disease, and brain changes with pathology, this study aims at studying the changes identified in
the brain through different MR imaging modalities and the relation between functional connec-tivity and computational modelling parameters of an effort-based decision-making task in two cerebral SVD cohorts (19 CADASIL and 104 sporadic SVD patients).
Based on previous literature and our understanding of the pathology of these patients, we expect that:
• Grey matter volume is reduced in apathy in cerebral SVD; • Functional connectivity is weaker in apathy;
• Functional connectivity strength is positively associated with grey matter volume;
• The association between functional connectivity and grey matter volume is reduced when covaried for white matter integrity;
• Functional connectivity changes in apathy are associated with reduced reward and effort sensitivity.
With this project we aim at better understanding the neural subtracts of apathy in cerebral SVD. It’s the first step, without making use of longitudinal data, to probe the hypothesis of apathy possibly being a marker of vascular dementia in the cerebral SVD populations. Prelimi-nary results were presented at the 9th International Symposium on Biology of Decision Making and the 4th UK Dementia MRI Conference.
2 Methods
2.1 Ethics
This study was approved by the ethics committee of the University of Oxford and written informed consent was obtained from all participants, in accordance with the Declaration of Helsinki.
2.2 Demographics
Nineteen patients with CADASIL were enrolled from two regional neurological centres (Oxford and Cambridge, UK). In order to qualify for the study, all patients had a confirmed clinical diagnosis of CADASIL (cysteine changing NOTCH3 mutations). Their ages ranged from 33 to 70 (mean = 54.3±10.5), 13 of them females. Exclusion criteria included physical disability to the extent of one being unable to squeeze a handheld dynamometer, previously documented large vessel stroke and MRI incompatibility. Seventeen of the enrolled patients completed cognitive questionnaires, behavioural testing and MR imaging acquisition. However, two patients were excluded from the imaging acquisition (one due to extreme claustrophobia and the other due the occurrence of an acute clinical event between the behavioural and imaging visits). More detailed information about the demographics of this cohort can be found in Table 2.1.
One hundred and four patients with sporadic SVD were enrolled from a neurological centre in Oxford, UK. All patients had a confirmed clinical diagnosis of sporadic small vessel disease. The same exclusion criteria from above was applied. All patients complete cognitive and behavioural testing as well MR imaging acquisition. However, from the initial cohort, sixty-five were selected to enroll this study, either due to scanner malfunction in some cases, and excessive noise found in the scans for others. More detailed information about the demographics of this cohort can be found in Table 2.2.
Table 2.1: CADASIL group demographics.
Measure CADASIL (n=18) No apathy (n=8) Apathy (n=10)
Age 54.3± 10.5 55.7± 11.1 52.6± 10.4
Table 2.2: Sporadic SVD group demographics.
Measure Sporadic SVD (n=104) No apathy (n=59) Apathy (n=45)
Age 67.3± 11.8 67.2± 12.2 67.4± 11.4
Sex (f/m) 45/59 28/31 17/28
2.3 Disease and cognitive measures
Apathy was assessed making use of the Apathy Evaluation Scale (AES) [42] as well as the Lille Apathy Rating Scale (LARS) [43]. An individual was defined as apathetic if either the LARS score was above -22 or the AES score was above 37 (equivalent to at least mild-moderate apathy). Depression was measured using the Beck Depression Inventory (BDI) [44] and the Geriatric Depression Scale (GDS) [45]. Baseline cognitive levels were formally assessed using the Addenbrooke’s cognitive examination III (ACE-III) [46]. Quality of life was assessed using a Cantril Ladder, in which participants rated their overall current quality of life on a visual scale ranging from 1-10, and the Well-Being Index (WHO-5) [47].
2.4 Effort-based decision-making behavioural experimental
de-sign
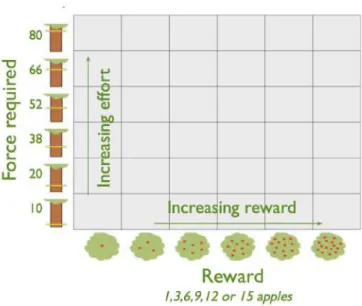
Participants were asked to complete an effort-based decision-making task on a computer run-ning Psychtoolbox (psychotoolbox.org) implemented within MATLAB (MathWorks). The task required the patient to make decisions of whether to accept an offer of a certain amount of reward in return for exerting a certain amount of effort via an individually calibrated handheld dynamometers (SS25LA, BIOPAC Systems). Each offer was presented on the screen as an apple tree with a certain number of apples. Reward for each trial was indicated by the number of apples on the cartoon tree (1, 3, 6, 9, 12 or 15) and numerically displayed underneath it. Each apple was worth 1p. Effort required to obtain the reward was indicated by the height of a yellow bar on the cartoon tree trunk, with the six possible levels (corresponding to 10, 24, 38, 52, 66 and 80% of a participant’s maximal voluntary contraction).
The six reward and six effort levels were combined, and the resultant 36 conditions (Figure 2.2)were sampled evenly in a pseudo-randomized order (meaning that all participants received the same offers, presented in the same order) across five blocks, for a total of 180 trials.
Participants were instructed to weigh up the effort costs against the reward on offer for each trial and decide if it’s worth squeezing that hard for that number of apples (in which a higher number of apples translated into a larger sum of monetary value – 1 apple = 1p). If they accepted an offer (by exerting a small squeeze on the left handgrip) they had to squeeze to the required force and hold above this level for at least 1s within a 5s response window, after which they
2.4. Effort-based decision-making behavioural experimental design
Figure 2.1: On a trial by trial basis participants were presented with offers (ap-ples on a tree, with each worth 1p) in return for exerting physical effort (ranging from 10% to 80% of a subject’s previously determined maximal voluntary con-traction (MVC). If they accepted the offer (by squeezing the left-hand grip) the tree moved to the left or right of the screen, indicating which hand they had to respond with. They had a 5-s window within which to achieve the required force level. If they rejected the offer (by squeezing the right-hand grip) they waited the same 5-s period.
Figure 2.2: The 6 x 6 decision space in which participants worked through 180 trials, pseudo-randomly, evenly sampled over five blocks.
were granted with the apples on offer. During the squeeze, live feedback of the force executed was shown as a red bar that indicated current force relative to the target line. Conversely, if participants rejected an offer (by exerting a small squeeze on the right handgrip) they waited an equivalent time (to control for temporal discounting effects) before moving onto the next offer. Therefore, on each trial participants decided whether the value of an offer was worth engaging with, compared to doing nothing for the equivalent time. Before starting the experiment, the handles were calibrated to account for the strength of each individuals. Participants were also given trials to practice each force level with each hand to familiarise themselves with the effort required. Lastly, they completed a practice block in which they made decisions on the full range of options in the experiment.
2.5 Neuroimaging data acquisition
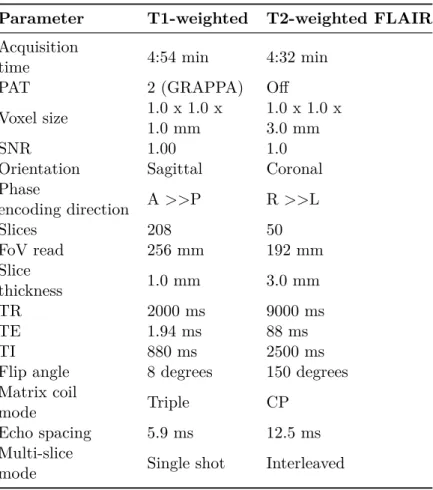
All patients enrolled in this study (either genetic or sporadic SVD) were scanned at the Acute Vascular Imaging Centre (AVIC) of the John Radcliffe Hospital, Oxford, with the same equip-ment and protocol. The site makes use of a 3T Siemens Magnetom Verio syngo with a 12-channel head coil. The full protocol used comprised 13 different sequences, lasting for around 50 min-utes. To make the envisioned imaging analysis possible, five sequences from three different modalities were used for this study. To obtain high resolution images of the anatomy of the brain and the white matter damage, two structural sequences - a T1-weighted and a T2-FLAIR (fluid-attenuated inversion recovery) sequence - were acquired.
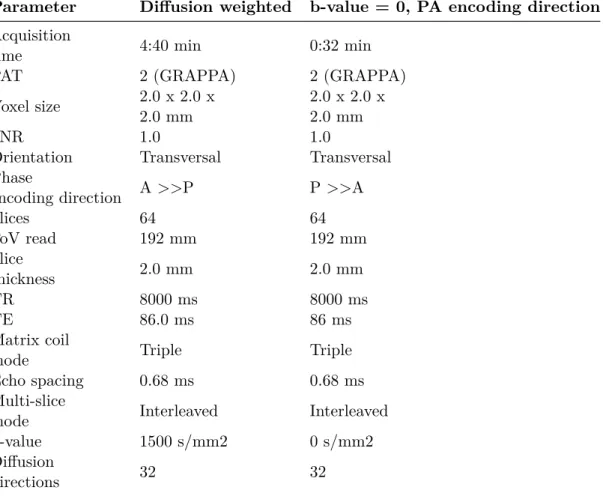
For white matter integrity analysis and the correction of susceptibility distortions, a dMRI sequence was acquired. For the above described sequences, the patients were just instructed to lay in the scanner as still as possible.
Finally, for the functional connectivity analysis, a resting state fMRI sequence was acquired. For this sequence, dummy volumes were automatically discarded by the scanner to account for T1 stabilization. Participants were instructed to lay as still as possible, with their eyes open, focused on a fixation cross on top of the scanner.
No reshimming took place between each sequence and the full protocol was run in the same order in just one go for all participants. This allowed for the construction of field maps.
2.6 Neuroimaging data analysis
All steps, from preprocessing to actual analysis, were implemented using bash (v3.2.57), FMRIB Software Library (FSL v5.0.11 fsl.fmrib.ox.ac.uk/fsl), Statistical Parametric Mapping (SPM12 spm/software/spm12/) and MATLAB_R2015b (MathWorks, USA). All scripts can be found in the following GITLAB repository: https://gitlab.com/jpeixoto18/dissertation_scripts.
2.6. Neuroimaging data analysis
Table 2.3: MRI parameters of the structural sequences Parameter T1-weighted T2-weighted FLAIR
Acquisition
time 4:54 min 4:32 min
PAT 2 (GRAPPA) Off
Voxel size 1.0 x 1.0 x 1.0 mm
1.0 x 1.0 x 3.0 mm
SNR 1.00 1.0
Orientation Sagittal Coronal
Phase encoding direction A >>P R >>L Slices 208 50 FoV read 256 mm 192 mm Slice thickness 1.0 mm 3.0 mm TR 2000 ms 9000 ms TE 1.94 ms 88 ms TI 880 ms 2500 ms
Flip angle 8 degrees 150 degrees Matrix coil
mode Triple CP
Echo spacing 5.9 ms 12.5 ms
Multi-slice
Table 2.4: MRI parameters of the dMRI sequences
Parameter Diffusion weighted b-value = 0, PA encoding direction
Acquisition
time 4:40 min 0:32 min
PAT 2 (GRAPPA) 2 (GRAPPA)
Voxel size 2.0 x 2.0 x 2.0 mm
2.0 x 2.0 x 2.0 mm
SNR 1.0 1.0
Orientation Transversal Transversal
Phase
encoding direction A >>P P >>A
Slices 64 64 FoV read 192 mm 192 mm Slice thickness 2.0 mm 2.0 mm TR 8000 ms 8000 ms TE 86.0 ms 86 ms Matrix coil
mode Triple Triple
Echo spacing 0.68 ms 0.68 ms
Multi-slice
mode Interleaved Interleaved
b-value 1500 s/mm2 0 s/mm2
Diffusion
2.6. Neuroimaging data analysis
Table 2.5: MRI parameters of the resting-state fMRI sequence. Parameter Resting-state Acquisition time 5:35 min PAT Off Voxel size 3.0 x 3.0 x 3.0 mm SNR 1.0 Orientation Transversal Phase encoding direction A >>P Slices 46 FoV read 192 mm Slice thickness 3.0 mm TR 1640 ms TE 30 ms Multi-band acceleration factor 2
Flip angle 90 degrees
Volumes 200
Matrix coil
mode Triple
Echo spacing 0.7 ms
Raw images and all derived images from following analysis steps were visually inspected at all stages to ensure quality control. Initially, the raw 2D DICOM (Digital Imaging and Communications in Medicine) files outputted from the scanner were converted into 3D/4D NIFTI (Neuroimaging Informatics Technology Initiative) images making use of the converter tool from Neuroimaging Tools & Resources Collaboratory (NITRC nitrc.org/projects/mricrogl). The imaging datasets were organised according to the Brain Imaging Data Structure (BIDS), a validated standard for organizing, describing and sharing MRI datasets [48]. Structural images (T1-weighted and T2-FLAIR) were brain extracted using FSL’s BET (brain extraction tool), manually cropping and adjusting parameters for the best fit [49].
2.6.1 MRI distortions correction
MRI, as a non-invasive imaging method, records the brain signal indirectly and thus scans are highly prone to carry multiple kinds of noise-induced distortions. Distortions might not have a great impact on clinical diagnosis, however, they can easily compromise the existence or validity of statistical results. As such, the first step of every analysis is to, as best as possible, account for these errors. In the aim of this study, we focused on four main sources of distortions:
• bias field;
• susceptibility distortions; • eddy currents;
• and motion.
Bias field is a low frequency smooth signal that is originated due to the lack of homogeneity of the main magnetic field of the scanner. It blurs k-space and thus reduces the images’ high frequency contents and changes the intensity values of voxels of the same tissue across the image. Moreover, it degrades the performance of imaging processing algorithms (e.g. those based on the assumption of spatial invariance of the image) [50]. For this, FMRIB’s Automated Segmentation Tool (FAST) was used. FAST, besides segmenting a 3D image of the brain into different tissue types (grey matter, white matter, CSF, etc.) and also corrects for spatial intensity variations [51].
When a patient lies in the bore of the scanner, the structure of the brain generates mag-netic field inhomogeneities (especially near boundaries between skull and the air sinuses located around the nose). These local changes in the magnetic field strength are problematic when ac-quiring EPI data. The field inhomogeneities interact with the expected signal and can therefore lead to signal loss in some areas (dropout) or signals ending up in the wrong location (aliasing). This distortion can be solved by realigning the data using field maps. The protocol used for this study did not contain field maps and thus a solution a replacement image was created using FSL’s TOPUP [52], [53]. It uses two dMRI acquisitions where the phase encoding directions are opposite, such that the same field inhomogeneity will lead to distortions going in opposing
2.6. Neuroimaging data analysis
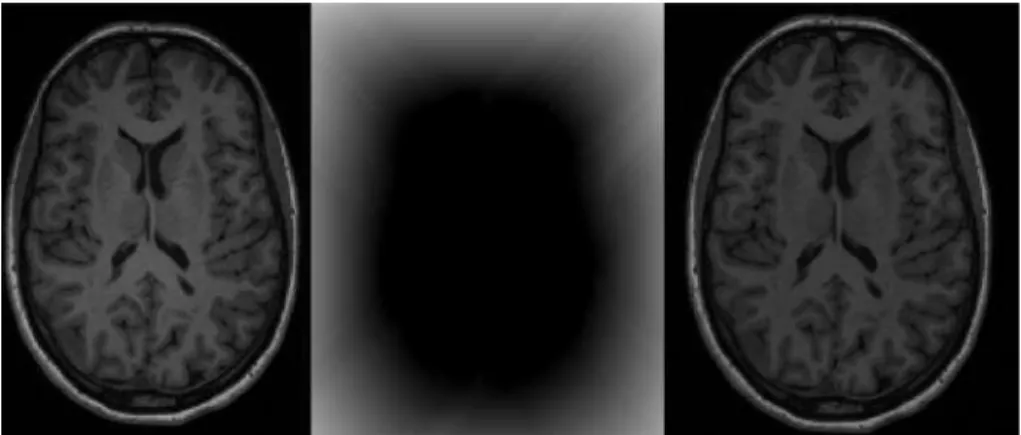
Figure 2.3: Example of bias field correction. On the left it is shown a T1-weighted image with presence of bias field (grey matter can be seen with different intensities in the left and right side of the image); the centre represents the bias field and, on the right, it is shown the same T1-weighted image corrected for the bias field.
directions. This tool will estimate an off-resonance field by finding the field that when applied to the two volumes will maximise the similarity of the unwarped volumes.
Electrical current is induced in nearby conductors by a changing magnetic field. Since MR uses rapidly changing magnetic fields to generate and spatially define the signal, eddy currents are produced. Thus, imaging sequences where gradients are pulsed on and off quickly (dMRI) produce the largest and most severe eddy current problems. Such artefacts are removed using FSL’s eddy tool [54]. Lastly, head motion was identified and corrected for fMRI images using FSL’s MCFLIRT - a fully automated robust and accurate tool for linear inter- and intra-modal brain image registration [55].
2.6.2 White matter hyperintensity load extraction
As described above, one big feature of cerebral SVD is the widespread white matter damage (white matter hyperintensities – WMHs). WMHs are areas of increased brightness when visu-alised by T2-weigthed imaging (hence hyperintensities). Although WMH have been associated with reduced cognitive function, it’s role in SVD is still unclear. Thus, for this study, we want to be able to control for WMH load in the structural and functional analysis. For this, extracting the total WMH load for all subjects was needed. FMRIB’s tool for automated segmentation of white matter hyperintensities (BIANCA) was used. BIANCA is an automated, supervised method to detect white matter hyperintensities (WMH). Its algorithm is based on the k-nearest neighbour (k-NN) clustering technique. BIANCA classifies the image’s voxels based on their intensity and spatial features, and the output image represents the probability per voxel of being WMH [56]. To fully run said pipeline, training points from a previous study on small vessel disease was used. This study used a very similar cohort, in the same scanner with a similar sequence. These factors make the features extracted from the study appropriate for this
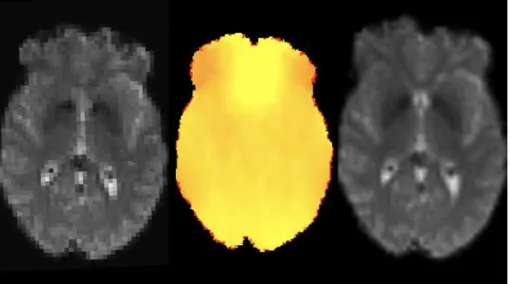
Figure 2.4: Example of susceptibility correction on functional MRI data by applying a field map. On the left it is shown an uncorrected fMRI volume. The centre represents that off-resonance field generated by TOPUP. On the right is shown the same fMRI volume corrected for susceptibility distortions.
study. BIANCA ouput individual lesion probability maps for each subject. Then, these maps are manually thresholded to best fit the lesion of each subject. To ensure the quality of the lesion masks, the thresholding was done by two raters (one with basic knowledge of WMH and by a fully trained medical doctor). Cases of ambiguity were to be discussed with a more senior medical professional.
2.6.3 Tract Based Spatial Statistics
Diffusion imaging offers methods for the investigation of white matter tract integrity. In specific, fractional anisotropy (FA) has been shown to, in previous studies, be a potential marker of
Figure 2.5: Example of the application and thresholding of the BIANCA lesion probability map. On the left it is shown a coronal slice of the T2-weighted FLAIR image and on the right, the same slice with application of the lesion mask (in yellow).
2.6. Neuroimaging data analysis
Figure 2.6: TBSS dMRI pipeline.
structural integrity and white matter damage [57], [58]. In this study, to compare structural integrity of white matter between apathetic and non-apathetic cerebral SVD patients, voxelwise statistical analysis of the FA values was carried out using TBSS (Tract-Based Spatial Statistics, part of FSL). First, FA images were created by fitting a tensor model to the raw diffusion data using FDT, and then brain-extracted using BET. All subjects’ FA data were then aligned into a common space using the nonlinear registration tool FNIRT, which uses a b-spline representation of the registration warp field. Next, the mean FA image was created and thinned to create a mean FA skeleton which represents the centres of all tracts common to the group [53], [59].
Each subject’s aligned FA data was then projected onto this FA skeleton and the resulting data fed into a GLM, in which t-tests to compare the changes in FA between groups. T-stats were corrected using TFCE (threshold-free cluster enhancement) [60]. In the GLM, regressors of no interest are introduced as covariates [61].
2.6.4 Voxel-based morphometry
Structural data was analysed with FSL-VBM (voxel-based morphometry) [62], an optimised VBM protocol [63] carried out with FSL tools. First, structural images were brain-extracted and grey matter-segmented before being registered to the MNI 152 standard space using non-linear registration. The resulting images were averaged and a study-specific grey matter template was generated. After, all original structural images were non-linearly registered to this study-specific template and corrected for local expansion (or contraction) due to the non-linear component of the spatial transformation with the output Jacobian matrix. The modulated grey matter images were then smoothed with an isotropic Gaussian kernel with a sigma of 3 mm. The resulting subject-wise grey matter images were fed into a voxelwise GLM, in which t-tests to
Figure 2.7: VBM structural pipeline.
compare the changes in grey matter volume between groups. T-stats were corrected using TFCE (threshold-free cluster enhancement) [60]. In the GLM, regressors of no interest are introduced as covariates [61].
2.6.5 fMRI denoising
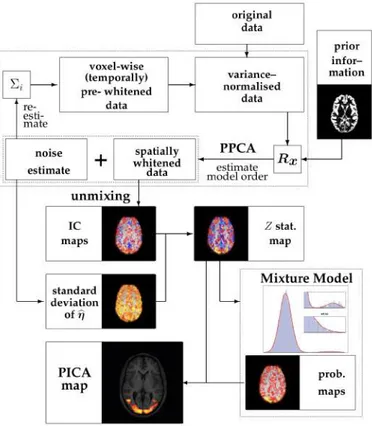
The fMRI data was pre-processed using FSL’s MELODIC (Multivariate Exploratory Linear Decomposition into Independent Components) [64]. MELODIC uses Independent Compo-nent Analysis (ICA) to decompose a 4D data into different spatial and temporal compoCompo-nents. MELODIC uses a probabilistic ICA (pICA)model formulated as a generative linear latent vari-able model. The model assumes that the observations are generated from a set of statistically independent non-Gaussian sources via a linear instantaneous mixing process corrupted by addi-tive Gaussian noise:
X = AS + µ + n (2.1)
Here, X denotes individual measurements at voxel location, S denotes the non-Gaussian source signals contained in the data, µ the mean of the observations X and lastly, n the Gaussian noise. The covariance of the noise is allowed to be voxel dependent in order to allow for the vastly different noise covariances in different tissue types. The pICA model is similar to the standard GLM with the difference that, unlike the design matrix in the GLM, the mixing matrix A is no longer pre-specified prior to model fitting. The source signals are the equivalent to the GLM parameter estimates, but with the additional constraint of being statistically independent. In MELODIC, the problem of defining the dimensionality of the ICA is solved by prior running PCA (principal component analysis). PCA is a similar method to ICA, but instead of looking for statistical independence in the components, PCA looks for orthogonal components to each other and that explain the maximum amount of variance in the data. In here, PCA is run and after, the number of components chosen for the ICA decomposition is defined by the number of the PCA component after which no more variance is explained.
The parameters of this imaging pre-processing pipeline used on all participants are as follow: motion correction using MCFLIRT, non-brain removal using BET, spatial smoothing using a Gaussian kernel of FWHM 5mm; grand-mean intensity normalization of the entire 4D dataset
2.6. Neuroimaging data analysis
Figure 2.8: Schematic illustration of the analysis steps involved in estimating the pICA model. Taken from [64].
Figure 2.9: ICA decomposition. Above it is shown the spatial distribution and power spectrum of a signal component (coactivation of DMN areas and a frequency distribution mostly below 0.1 Hz). Below, it’s shown the spatial distribution and also the power spectrum of a noise component (wide power spectrum and spatial features common of motion artefacts and CSF pulsation).
by a single multiplicative factor and linear detrending over 50 second intervals, B0 unwarping using the field maps developed, slice timing correction making use of the slice timing from the fMRI metadata, high pass temporal filtering (using a local fit of a straight line) to remove low frequency artefacts and registration between functional and structural space using FSL’s FLIRT. Manual classification of the output independent components between “signal” and “non-brain” was conducted following published guidelines [65]. Components identified as “non-brain” were regressed out of the fMRI data using fsl_regfilt.
2.6.6 Dual Regression Analysis
Firstly, functional connectivity was analysed under a static assumption (i.e. averaging the BOLD signal over the whole acquisition time). In order to statistically detect differences in resting state networks between groups of subjects, the individual ICA components could be used. However, in practice, it’s often the case that a network will be described by a single component in one subject but split in two (or more) separate components in another subject (i.e. there is a correspondence problem). Therefore, a more practical approach is to run a group analysis in order to ensure that the components are the same across all the subjects, and then map these group components back to individual subjects. To address this problem, the dual regression FSL pipeline was employed. The dual regression uses group-ICA maps (generated by running multi-session temporal concatenation MELODIC) and applies two subsequent regression analyses using the original pre-processed dataset from each subject in order to derive subject-specific maps. The first stage of a dual regression analysis is to perform a multiple regression analysis where the group-ICA maps are the spatial regressors, and the subject’s pre-processed BOLD dataset is the input data (dependent variables). The result of this first stage of dual regression is a set of timecourses (one for each group map) that describe the temporal structure of each component for each subject. These timecourses then become the model for the second
2.6. Neuroimaging data analysis
Figure 2.10: Dual regression fMRI pipeline.
stage of the dual regression. This second stage involves a second multiple regression, where the temporal regressors of the first stage are regressed against the subject’s pre-processed BOLD data. The output is then a set of maps (one for each original group-ICA component) that describe the network structure based on the data from each subject [66].
These group-ICA maps for each subject are then used for between-group analysis. A GLM is built to assess the differences in mean activation between groups. T-stats were corrected using TFCE (threshold-free cluster enhancement) [60]. In the GLM, regressors of no interest are introduced as covariates [61].
2.6.7 Leading Eigenvector Dynamics Analysis (LEiDA)
Secondly, functional connectivity analysis was conducted in order to capture the BOLD fluctu-ations at all timepoints. For this, the single-level denoised fMRI datasets were used. We used the Anatomical Automatic Labelling (AAL) atlas to parcellate the MNI brain into 90 cortical and sub-cortical brain areas. The BOLD signals were then averaged over AAL brain regions using FSLUTILS. To compute the phase coherence between the of AAL regions, first the BOLD phases, θ(n, t), were estimated using the Hilbert transform for the timecourse of each AAL re-gion. The Hilbert transform expresses a given signal x as x(t) = A(t)∗ cos(θ(t)), where A is the amplitude and θ is the phase (both varying with time). Literature has shown that cos(θ(t)) captures the oscillatory dynamics of the original BOLD signal with constant amplitude. To obtain the pattern of phase coherence at each single time point t, we compute a dynamic phase
coherence matrix dP C(n, p, t) which estimates the phase coherence between brain areas n and p at time t, using:
dP C(n, p, t) = cos(θ(n, t)− θ(p, t)) (2.2) Using the cosine function, two areas n and p with temporarily aligned BOLD signals (i.e. with no phase difference) at a given TR will have a phase coherence value of 1. On the other hand, time points where the BOLD signals have 180 degree phase difference (in the complex plane) will have a value of -1. The resulting dPC for each subject is thus, a three-dimensional matrix with size, NxNxT, where N=90 is the number of brain areas and T=200 is the total number of time points. To characterise the evolution of the dPC matrix over time, we employed a method termed Leading Eigenvector Dynamic Analysis (LEiDA) focusing on the evolution of the dominant pattern of the phase coherence over time. The leading eigenvector of the phase coherence matrix at time t, V1(t) represents the projection of the BOLD phase in each brain area into the leading eigenvector. When all elements of V1(t) have the same sign, it means all BOLD phases are following the same direction with respect to the orientation determined by V1(t), which is indicative of a global mode governing all BOLD signals. If instead, the first eigenvector V1(t) has elements of different signs (i.e. positive and negative), the BOLD signal follows different directions with respect to the leading eigenvector, which we use to divide the brain areas into two “communities” according to their BOLD phase relationship. Moreover, the magnitude of each element in V1(t) indicates the “strength” with which brain areas belong to the communities in which they are placed. To identify recurrent phase coherence (PC) patterns we used a clustering algorithm (k-means) to divide the sample of PC eigenvectors (3200 vectors corresponding to all 200 TRs of 18 CADASIL patients and 13000 vectors corresponding to all 200 TRs of 65 sporadic SVD patients) into a predefined number of clusters k (with higher k revealing rarer and more fine-grained patterns). Since the optimal number of functional networks to consider remains an open question, we ran the k-means clustering algorithm with k ranging from 5-15 to cover the range of functional networks commonly reported in the resting state fMRI literature. Importantly, in the current study we do not aim to determine the optimal number of PC states, but rather to investigate if there are PC state(s) that differ in their probability of occurrence over this range in apathetic and non-apathetic SVD patients. For each partition model (i.e. k = 5 to k = 15), the clustering returns k cluster centroids in the shape of Nx1 vectors, Vc, which represent the central vector of each cluster. We take these central vectors as representing recurrent states of BOLD phase coherence, or PC states. To facilitate visualisation and interpretation of PC states, the cluster centroid vectors Vc obtained were rendered onto a cortical surface using SPM12. The clustering assigns to each TR a single PC state by selecting the centroid Vc that is closer to the V1(t) at each TR. Using the state time course, we calculated the probability of occurrence of each state, which is simply the number of epochs assigned to a given PC state divided by the total number of epochs (TRs) in each scan. For each partition mode (i.e. with k = 5 to k = 15) the probabilities of each PC state were calculated for each
2.7. Statistical analysis of the data
Figure 2.11: Leading Eigenvector Dynamics Analysis (LEiDA) pipeline.
group (apathetic and non-apathetic SVD patients).
2.6.8 Statistical thresholding
A common statistical problem in neuroimaging studies (that occurs in relation to null hypothesis testing) is the multiple comparison problem. When we perform a large number of tests it is essential to apply some form of correction to control the number of false positives accepted. This study uses, for the VBM, TBSS and static functional connectivity analysis (dual regression), a family-wise error rate correction, which is the standard correction method. For the LEiDA anal-ysis (functional connectivity dynamics), where we’re testing only at the level of the parcellation scheme and not voxel per voxel, a more stringent correction is applied (Bonferroni correction).
2.7 Statistical analysis of the data
2.7.1 Cognitive assessment statistics
To check the effect of apathy on the cognitive function, depression and quality of life in the cerebral SVD populations, the scores of the cognitive questionnaires were tested through one-way ANOVAS (groups defined by apathy classification described above).
2.7.2 Behavioural experimental statistics
Data from the behavioural paradigm was analysed in a couple of separate ways. Firstly, we looked at raw proportion of offers accepted with a one-way ANOVA. Secondly, a repeated mea-sures ANOVA was used to test whether the proportion of accepted trials per condition varied as function of reward, effort, apathy or their interactions. Lastly, a computational model (glme – general linear mixed-effect model) was used to estimate, for each participant, the degree that reward and effort changed the value of an effort. The model was selected based on a comparison of candidate models from the literature [67], [68], using standard minimisation of the Bayesian information criterion. An exponential model closely approximated both individual and average raw choices:
value = α.Reward.exp(−β.effort + k) (2.3) Where α estimated the degree to which reward increased the value of an offer, β estimated the degree to which effort reduced the value of an offer and k the baseline tendency to accept an offer. Parameters were normally distributed and therefore compared using independent t-tests.
2.7.3 Imaging statistics
For all the imaging analysis (across all modalities), the CADASIL and sporadic SVD groups were always tested separately, with the objective of establishing relations between the groups. Regressors of no interest were always demeaned before being input to the GLM, as to still account for their variance within the data, but not their mean. GLM statistics were always corrected for multiple comparisons and with TFCE. Grey matter estimates outputted from VBM, TBSS FA estimates and dual regression’s components were analysed making use of two GLMs. Both of them tested only for one contrast: mean of the non-apathetic group > mean of the apathetic group. GLMs varied between one another only in the number of covariates added. The first controlled for age and sex. The second controlled for age, sex and white matter load. Differences in probabilities of occurrence between groups of phase coherence states from LEiDA were statistically assessed using a permutation-based paired t-test. This non-parametric test uses permutations of group labels to estimate the null distribution, which is computed independently for each group. For each of 1000 permutations a t-test is applied to compare populations and a p-value is returned.
2.7.4 Combined neuroimaging and behavioural statistics
Parameter estimates of reward and effort sensitivity were compared with grey matter volume estimates from VBM, FA values extracted from TBSS and the state probabilities from LEiDA, making use of the Pearson correlation and its statistic significance assessed with t-tests.
![Figure 1.1: Prevalence of different types of dementia in the general population [4].](https://thumb-eu.123doks.com/thumbv2/123dok_br/15156344.1013358/20.892.235.660.212.540/figure-prevalence-different-types-dementia-general-population.webp)
![Figure 1.4: Diagram of the brain areas involved in the motivated behaviour pathways. Adapted from [25].](https://thumb-eu.123doks.com/thumbv2/123dok_br/15156344.1013358/24.892.301.594.161.398/figure-diagram-brain-involved-motivated-behaviour-pathways-adapted.webp)