Interpretation of the vacuum ultraviolet photoabsorption spectrum of iodobenzene
by ab initio computations
Michael H. Palmer, Trevor Ridley, Søren Vrønning Hoffmann, Nykola C. Jones, Marcello Coreno, Monica de Simone, Cesare Grazioli, Malgorzata Biczysko, Alberto Baiardi, and Paulo Limão-Vieira
Citation: The Journal of Chemical Physics 142, 134302 (2015); doi: 10.1063/1.4916121 View online: http://dx.doi.org/10.1063/1.4916121
View Table of Contents: http://aip.scitation.org/toc/jcp/142/13
Published by the American Institute of Physics
Articles you may be interested in
The ionic states of iodobenzene studied by photoionization and ab initio configuration interaction and DFT computations
The Journal of Chemical Physics 142, 134301 (2015); 10.1063/1.4916120
Interpretation of the photoelectron, ultraviolet, and vacuum ultraviolet photoabsorption spectra of bromobenzene by ab initio configuration interaction and DFT computations
The Journal of Chemical Physics 143, 164303 (2015); 10.1063/1.4933419
A combined theoretical and experimental study of the ionic states of iodopentafluorobenzene
The Journal of Chemical Physics 146, 084302 (2017); 10.1063/1.4975672
A combined theoretical and experimental study of the valence and Rydberg states of iodopentafluorobenzene
The Journal of Chemical Physics 146, 174301 (2017); 10.1063/1.4981919
Combined theoretical and experimental study of the valence, Rydberg, and ionic states of chlorobenzene
The Journal of Chemical Physics 144, 124302 (2016); 10.1063/1.4944078
Combined theoretical and experimental study of the valence, Rydberg and ionic states of fluorobenzene
Interpretation of the vacuum ultraviolet photoabsorption spectrum
of iodobenzene by ab initio computations
Michael H. Palmer,1,a)Trevor Ridley,1,b)Søren Vrønning Hoffmann,2,b)Nykola C. Jones,2,b)
Marcello Coreno,3,b)Monica de Simone,4,b)Cesare Grazioli,4,5Malgorzata Biczysko,6,7,b)
Alberto Baiardi,7and Paulo Limão-Vieira8,b)
1School of Chemistry, University of Edinburgh, Joseph Black Building, David Brewster Road, Edinburgh EH9 3FJ, Scotland, United Kingdom
2Department of Physics and Astronomy, ISA, Aarhus University, Ny Munkegade 120, DK-8000 Aarhus C, Denmark
3CNR-ISM, Montelibretti, c/o Laboratorio Elettra, Trieste, Italy 4CNR-IOM Laboratorio TASC, Trieste, Italy
5Department of Chemical and Pharmaceutical Sciences, University of Trieste, Trieste, Italy 6National Research Council ICCOM-CNR, UOS di Pisa, Via G. Moruzzi 1, I-56124 Pisa, Italy 7Scuola Normale Superiore, Piazza Cavalieri 7, 56126 Pisa, Italy
8Laboratório de Colisões Atómicas e Moleculares, CEFITEC, Departamento de Física,
Faculdade de Ciências e Tecnologia, Universidade Nova de Lisboa, 2829-516 Caparica, Portugal
(Received 15 December 2014; accepted 12 March 2015; published online 1 April 2015)
Identification of many Rydberg states in iodobenzene, especially from the first and fourth ioniza-tion energies (IE1 and IE4, X2B1 and C2B1), has become possible using a new ultraviolet (UV)
and vacuum-ultraviolet (VUV) absorption spectrum, in the region 29 000-87 000 cm−1(3.60-10.79 eV), measured at room temperature with synchrotron radiation. A few Rydberg states based on IE2
(A2A2) were found, but those based on IE3(B2B2) are undetectable. The almost complete absence
of observable Rydberg states relating to IE2 and IE3(A2A2and B2B2, respectively) is attributed to
them being coupled to the near-continuum, high-energy region of Rydberg series converging on IE1.
Theoretical studies of the UV and VUV spectra used both time-dependent density functional (TDDFT) and multi-reference multi-root doubles and singles-configuration interaction methods. The theoretical adiabatic excitation energies, and their corresponding vibrational profiles, gave a satisfactory interpre-tation of the experimental results. The calculations indicate that the UV onset contains both 11B
1and
11B
2states with very low oscillator strength, while the 21B1state was found to lie under the lowest
ππ∗11A
1state. All three of these1B1and1B2states are excitations into low-lying σ∗orbitals. The
strongest VUV band near 7 eV contains two very strong ππ∗valence states, together with other weak
contributors. The lowest Rydberg 4b16s state (31B1) is very evident as a sharp multiplet near 6 eV; its
position and vibrational structure are well reproduced by the TDDFT results. C2015 AIP Publishing LLC.[http://dx.doi.org/10.1063/1.4916121]
I. INTRODUCTION
In this paper, we present new high-resolution, synchrotron-excited 1-photon, vacuum ultraviolet (VUV) absorption spectra, and in the accompanying paper (AP),1photoelectron
spectra (PES) of iodobenzene (PhI), both at room temperature. In several respects, the spectra of PhI are the most complex of the monohalobenzenes (C6H5I, C6H5Br, C6H5Cl, and C6H5F,
“the series,” PhX) and are difficult to interpret in isolation. We will be presenting similar studies of the lower members of the series later, where we will also present (2+ 1) and (3 + 1) resonance enhanced multiphoton ionization (REMPI) spectra of jet-cooled samples. The present analyses of the VUV spectrum (and PES) are supported by ab initio configuration interaction (CI) and time dependent density functional
a)Email: [email protected]. Telephone:+44 (0) 131 650 4765. b)Electronic addresses: [email protected]; [email protected];
[email protected]; [email protected]; [email protected]; [email protected]; and [email protected]
(TDDFT) calculations of vertical and adiabatic ionization (and excitation) energies and vibrationally resolved spectra.
The most intense bands in the absorption spectrum are valence in nature. The three main bands in the ultraviolet (UV) spectrum of PhI have maxima near 4.88, 5.49, and 5.99 eV. These well-known2–5bands are present in solution and hence
are valence rather than Rydberg states. They also closely resemble the principal singlet transitions in benzene (4.86, 6.20, and 6.97 eV). However, the situation is more complex, since alkyl iodides show absorption near 260 nm (4.77 eV) in the UV region,3−5attributed to σ∗← n valence transitions.
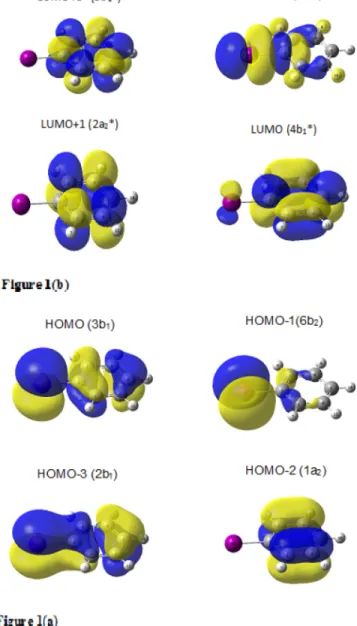
This additional interaction with the PhI ring and σ- and π-MOs (a1and b1, respectively) is exemplified by the electron
density contours shown in Fig.1(a)for the four highest MOs;
and Fig. 1(b) for the LUMOs involved in the low energy
excitations. In order to correlate transitions across the series of PhX, it is convenient to use valence shell numbering of MOs, and these are indicated in Fig.1. The orbital energies (eV) are as follows: occupied 2b1(−9.81), 6b2(−8.91), 1a2(−8.73), and
FIG. 1. (a), (b) Equal electron density contours and nodal properties. (a) The four highest occupied MOs; when ionized the sequence changes to 3b1< 1a2< 6b2< 2b1; (b) four lowest valence unoccupied (virtual) MOs of
PhI; in the lowest excited singlet states, the 9a1∗MO is occupied.
HOMO 3b1(−7.98); virtual orbitals: 7a1∗(−0.14), 8a1∗(0.28),
4b1∗(0.32), and 2a2∗(0.41).
The first VUV (4.59 to 11.27 eV) study of the absorption spectrum was unanalyzed,2but Kimura and Nagakura6fitted
the 4.3–7.55 eV region to six Gaussian bands; their theoretical analysis, using only π-MOs on C and I atoms, was limited to ππ∗ and charge-transfer (C-T) states, as discussed by
Robin.5
No Rydberg states of PhI have been observed previously in either VUV absorption2–6or earlier REMPI studies,7,8but
we observe numerous Rydberg states in the current spectrum
and we use the new analysis of the PES1 as an aid to
assigning these states. PES are important for identification of Rydberg states in the VUV absorption spectrum since the potentials experienced in the ionic (PES) and Rydberg state (VUV) formation, particularly for high-n states, are similar and this leads to similar vibrational profiles in the two types
of spectra.9–15 Therefore, in the analysis of the absorption
spectra, we use the vibronic structure observed in the PES1as a fingerprint to identify the ionic core of the observed Rydberg state or series.
The current VUV spectrum goes up to approximately 11 eV; therefore, the first four ionic state band systems for PhI are relevant. We propose in AP1that three of them are
coupled and consequently in the VUV spectra the Rydberg series converging on these ionization limits are also coupled making assignment of the spectra more difficult. Despite these factors, we have been able to identify, with reasonable certainty, the ionic core of most of the observed Rydberg states. In addition, characteristic quantum defects are used to further assign a considerable number and variety (s,p,d,f) of Rydberg states.
Our VUV study concentrates on static spectral behav-iour, rather than dynamic aspects, so that the known homolytic photochemical decomposition of PhI at several wavelengths,16,17 and references therein, is peripheral to the present study. It is sufficient to note that no evidence of the known photolysis products, which include molecular iodine and biphenyl (Ph-Ph) formation were observed in our spectral studies. The colour formation of I2 is a
particularly strong guide concerning potential photolysis. The very low experimental C–I bond dissociation energy of PhI (D0= 2.900 eV)16 is clearly responsible for many of these
reactions.
The theoretical aspect of this study includes determination of adiabatic and valence excited state excitation energies for several low-lying singlet states. The Franck-Condon (FC) spectral profiles18–21 were determined using MCSCF and TDDFT methods.22–24 The corresponding vertical study, which enables many more states to be studied over a much wider energy range, uses multi-reference multi-root CI methods (MRD-CI).25–27In some parts of the study, the basis sets included ab initio relativistic effective potentials which include spin–orbit operators.28–31 Variations in molecular
structure with electronic state are shown in the supplementary material.32
In the VUV and PES discussion below, our units are electron volts (eV) for wide energy range UV+ VUV spectra. However, since we are interested in the vibrational structure of the bands, this makes cm−1a more suitable energy unit for
the Rydberg state study.
II. EXPERIMENTAL AND COMPUTATIONAL PROCEDURES
A. Experimental VUV absorption
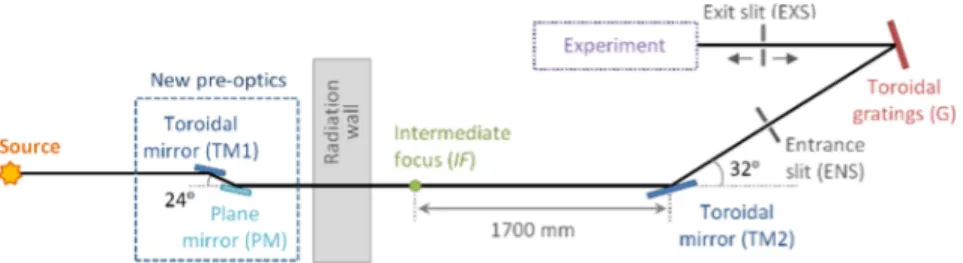
The VUV absorption spectrum was measured on the ASTRID2 storage ring at Aarhus University, Denmark, using the AU-UV beam line. The AU-UV beam line was originally commissioned on ASTRID in 2000; it was known then as the UV1 beam line and is described in detail in Eden et al.33In order to utilize the new 3rd generation light source,
ASTRID2, the beam line has undergone significant changes. The geometry of the old beam line, with a source to first mirror distance of 1700 mm, was such that it could not be directly
FIG. 2. Schematic overview of the AU-UV beam line optics on ASTRID2.
attached to the new storage ring, as a radiation wall had to be accommodated. Therefore, a pair of 1:1 focussing pre-optics mirrors was installed to image the source to an intermediate focus (IF), which acts as a source for the existing beam line without further alteration.
A toroidal mirror (TM2) focuses the beam from the IF onto the entrance slit (ENS) (Fig. 2), which is typically set to 100 µm for photoabsorption measurements. The light then passes to a toroidal grating. There are two gratings available, a high energy grating (HEG) with a line density of 2000 lines/mm covering 100-350 nm (12.40 to 3.54 eV) and a low energy grating (LEG) with a line density of 1000 lines/mm covering 160-700 nm (7.75 to 1.77 eV). The light exits the monochromator via a moveable slit (EXS), also set to 100 µm, and passes through a LiF window which separates the ultra-high vacuum of the beam line from the end station experiment. The resolution of the monochromator using the HEG, the primary grating used for high resolution photoabsorption measurements, has been measured and found to be 0.08 nm over the operational range of the grating (≡13 cm−1at 250 nm and 50 cm−1at 125 nm), close to the calculated value of 0.07 nm.33
The apparatus used for measurement of photoabsorption spectra has also undergone several alterations since that described in Eden et al.33 The new cell (see Fig. 3), which
allows moderate (up to 80 ◦C) heating of a sample during
measurement, has a path length of 15.5 cm and is fitted with a heated 1 Torr Baratron capacitance manometer (Setra model 774). The light exits the cell through a MgF2window,
which sets the lower limit of detectable light to 115 nm. A small gap between the photo-multiplier tube (PMT) detector and the absorption cell is evacuated using a scroll pump for
FIG. 3. Schematic overview of the photoabsorption apparatus. The main body of the cell and the sample can be heated, while keeping the detector and pumps at room temperature. The Baratron is separately heated to 123◦C to avoid molecular condensation.
measurements below 200 nm. Above 200 nm, air is allowed into this gap to let oxygen absorb higher orders of light (at half the chosen wavelength) which may be passing through the cell. In this way, photoabsorption measurements can be performed with spectrally pure radiation from 115 nm to 340 nm, ensuring artefact-free spectra.
Absolute photoabsorption cross-sections (σ) are obtained using the Beer-Lambert law
It = I0exp(−nσl),
where It and I0are the detector signal transmitted through
a gas and for an evacuated cell, respectively, l is the cell path length (15.5 cm) and n is the molecular number density (derived from the pressure measurement). ASTRID2 is operated in a so-called top-up mode, keeping the stored electron beam current (and thus the intensity for a given wavelength) quasi constant by adding small amounts of current to ASTRID2 to make up for the constant beam decay. The beam current thus varies about 3%-5% during a scan, and this is taken into account by recording and normalizing to an accurately determined beam current.
In order to accurately determine cross-sections, the VUV spectrum was recorded in small (5 nm or 10 nm) sections, with at least 1 nm overlap to the adjoining sections. For each section of the spectrum, a scan with no gas in the cell was first recorded (I0). Then, an appropriate pressure of sample
for each range was selected so that the incoming light was attenuated by 40%-50%, which is low enough to prevent line saturation effects and two scans of the sample in a static gas cell recorded (It). The cell was then evacuated and a second
scan of the empty cell recorded. The final cross-sections were then calculated using all four of these scans. A single scan typically took 4–5 min; consistency between the two Itscans
recorded and the good overlap of the sections of the spectrum indicated no degradation of the sample in the cell during the timescale of the measurements.
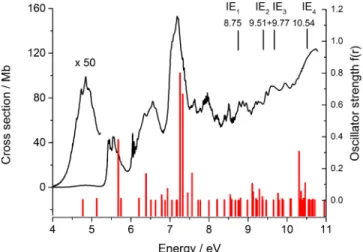
The photoabsorption spectrum for PhI was measured in the energy range from 3.594 eV (345 nm, 28 988 cm−1) to 10.781 eV (115 nm, 86 954 cm−1) using data points separated by 0.05 nm (4-40 cm−1) and is shown in Fig.4.
The samples of PhI (CAS Registry Number 591-50-4) were obtained from Sigma-Aldrich and used without further purification apart from repeated freeze-pump-thaw cycles in order to remove air.
B. Experimental PES
A new PES measured on the gas phase beam line of the Elettra synchrotron, described in AP1is used here. The
FIG. 4. The experimental UV plus VUV absorption spectrum of PhI, (black) with superimposed all-electron MRD-CI vertical energies and oscillator strengths for calculated valence states (red). Positions of1A
2states are
iden-tified by use of an arbitrary f(r) = 10−4. A logarithmic plot of the calculated
oscillator strengths, which emphasizes the variation in f(r) is shown in the supplementary material.32
high-resolution spectrum, recorded using 30 eV photons, covers the range 8.167–24.625 eV; the low energy region up to 11.5 eV shown in Fig. 5 was recorded in steps of 0.001 eV. The measured IEs (TableI) crucial to the current Rydberg state identification involving bands 1 to 3 (Fig. 5) show the ionization processes IE1, (IE2+ IE3), and IE4, respectively,
which are also indicated on the VUV absorption spectrum (Fig.4).
C. Computational methods
Adiabatic excitation energies (AEEs) of several singlet and ionic states were obtained using either the TDDFT method22–24or state-averaged (SA) MCSCF methods
imple-mented in GAUSSIAN-09.34,35 Vibrational FC profiles18–21
were generated from both TDDFT and unrestricted Hartree-Fock (UHF) (ionic) wave-functions within the Adiabatic
FIG. 5. The low-energy region of the PES of PhI, containing the four lowest IEs, which is relevant to the current VUV spectral analysis.
TABLE I. Experimental adiabatic IEs of PhI used in the Rydberg state assignments.
Expt. IE/eV (cm−1) Leading term vacancy State symmetry
8.758 (70 638) 3b1−1 X2B1
9.505 (76 663) 1a2−1 A2A2
9.776 (78 848) 6b2−1 B2B2
10.543 (85 035) 2b1−1 C2B1
Hessian approximation (FCAH) also taking into account temperature effects.
Only a few AEEs were determined, since root swapping in the energy sequence, where many states have rather similar structures, prevented the success of the computational focus on some states. Thus, vertical excitation energies (VEE) for valence and Rydberg states, determined by a MRD-CI,25–27 as implemented in GAMESS-UK,36 were also utilized; this method is fully described in our previous studies.13–15
In this paper, theoretical oscillator strengths (f(r)), derived from the CI wave-functions, are compared with absorption band intensities. Wide differences in f(r) occur between valence and Rydberg states, generally enabling differentiation between the types of excitation. Typical values are 10−1–10−2
and 10−2–10−6, respectively, but unexpectedly, in the present
study, some valence states (e.g., both 11B
1 and 11B2) have
very low f(r). The second moments of the charge distribution (SMCD, x2 , y2 , and z2 ) give additional information
both in relation to valence states, which have similar values for SMCD to the ground state, and also concerning the directionality of Rydberg p-, d-, and f-states, where selected directions of the SMCD are large; this procedure was described previously.13–15
In all the CI methods, the 29 core orbitals (15a1+ 5b1
+ 7b2+ 2a2) are frozen in occupancy and density; the full
valence shell occupied orbitals (8a1+ 3b1+ 6b2+ 1a2) were
included in the CI, together with up to 120 virtual MOs (VMOs) in the MRD-CI study. Valence shell numbering is used to enable comparisons with the lower PhX. These C2vmolecules
all lie in the yz-plane, where the z-axis lies along the C2axis.
D. Basis sets
The ab initio C- and H-atom bases were chosen to be compatible in style with the more limited I-atom basis sets.37,38
Overall, the Sadlej p-VTZ (I) basis sets39 in combination
with the TZVP (C,H) basis40 were widely used; these
gave I[11s8p6d2f], C[5s3p2d], H[3s2p] contracted functions. Unexpectedly, in several equilibrium structure searches for the ionic states, these bases at both the MCSCF and UHF theoretical levels led to saddle points rather than full minima. The effective core potential (ECP) quasi-relativistic basis sets
including CRENBL41 and SDD30,31 gave genuine minima
in both the UHF and TDDFT methods. Indeed, CRENBL generated VEE nearly identical to the all-electron basis set using MRD-CI and structures close to the MCSCF methods. For our Rydberg state studies, the CRENBL basis was
extended by sets of s-, p-, d-, and f-functions. By incorporating separate s-, p-, d-, and f-enhancements, the ECP enabled the energy determination of higher Rydberg states to be performed more economically.
III. RESULTS AND DISCUSSION
A. Overall aspects of the UV+ VUV absorption spectrum of PhI and its theoretical interpretation
Our experimental UV + VUV spectrum (Fig. 4) also
shows our calculated valence shell VEEs and their oscillator strengths, which includes excitations from both π- and σ-MOs; the full list of VEE state energies, oscillator strengths, and SMCD is presented in the supplementary material.32 The SMCD can be used to demonstrate the directionality of the Rydberg states and hence their symmetry.13–15
Expansions of short energy ranges of the UV+ VUV
spectrum are exhibited below; the dominant three regions of the spectrum are near 5.5, 6.5, and 7 eV; each of these ranges show high f(r) valence states. The most intense individual band lies between 7 and 7.5 eV and can be correlated with two calculated ππ∗electronic states, of1A1(1a22a2∗) and1B2
(2b12a2∗− 1a24b1∗) symmetries, together with other weaker
states. The AEEs of the valence states that could be calcu-lated, together with the corresponding VEEs, are shown in TableII.
B. Valence states
1. The 3.7-6.0 eV region
The absorption spectrum in the region 3.7-6.0 eV consists of two broad bands with some vibrational structure
superimposed on them, as shown in Figs. 6 and 7, and
these have been commonly labelled as bands A and B. The spectroscopy and dynamics of these bands have been the focus of many studies, of which that of Sage et al.16which includes
a thorough, critical review of previous studies42–46is the most
recent and comprehensive.
Experimentally, Sage et al.16 studied photodissociation following 1-photon absorption, using REMPI excitation of the atomic iodine that was generated. The kinetic energies of the atoms were measured using velocity mapped ion imaging
FIG. 6. Super-position of the calculated FC profiles of the 11B1and 11B2
states on the experimental band A absorption of PhI. The intensity of the 11B
1profile has been increased by a factor of 20 for illustration purposes.
A ladder generated from the vibrational modes and frequencies observed for band B is shown above the experimental spectrum with the origin aligned with the first identifiable band in the spectrum at 4.6 eV.
(VMI) detection. The experimental data were supported by ab initio calculations on the excited states that included spin-orbit coupling (SOC). The most important conclusion from the experimental results was that the photodissociation process over the whole region was almost entirely due to the initial 1-photon absorption via parallel transitions, i.e., into A1 states. On the basis of the ab initio calculations, band
A was assigned to the first excited SOC A1 state, 2A1, that
was predominantly made up from the spin-orbit free (SOF)
3B
1 πσ∗ state. Band B was assigned to the SOC 5A1 state
which was almost entirely made up from the SOF 11A 1ππ∗
state, in line with most previous studies.
We have calculated the geometry of the SOF 11A
1
state and simulated its absorption spectrum. The AEE (and vibrational complexity exhibited) for the 11A1 ππ∗ state is
very dependent on the basis set within the TDDFT procedure; using the ECP containing the CRENBL basis, the 11A1state
has the AEE 5.658 eV (f(r) = 0.2089), and hence is very close to the observed band origin of 5.42 eV. However, the FC profile is much simpler than that obtained with the much larger all-electron study using the Sadlej+ aug-cc-pVTZ basis sets, and a stick spectrum of the intensities obtained from this latter calculation is shown in Fig.7. The AEE is significantly
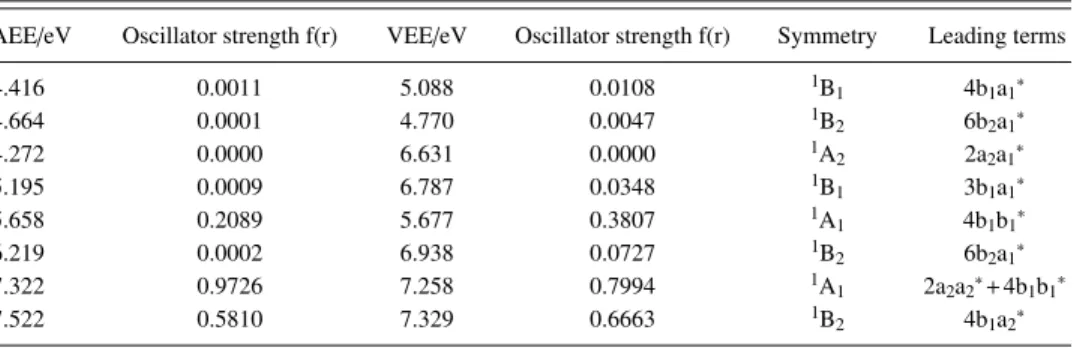
TABLE II. Calculated adiabatic (TDDFT) and vertical (MRDCI) excitation energies, oscillator strengths, and spectral assignments of some valence states of PhI.
AEE/eV Oscillator strength f(r) VEE/eV Oscillator strength f(r) Symmetry Leading terms
4.416 0.0011 5.088 0.0108 1B 1 4b1a1∗ 4.664 0.0001 4.770 0.0047 1B2 6b2a1∗ 4.272 0.0000 6.631 0.0000 1A 2 2a2a1∗ 5.195 0.0009 6.787 0.0348 1B1 3b1a1∗ 5.658 0.2089 5.677 0.3807 1A 1 4b1b1∗ 6.219 0.0002 6.938 0.0727 1B2 6b2a1∗ 7.322 0.9726 7.258 0.7994 1A 1 2a2a2∗+4b1b1∗ 7.522 0.5810 7.329 0.6663 1B2 4b1a2∗
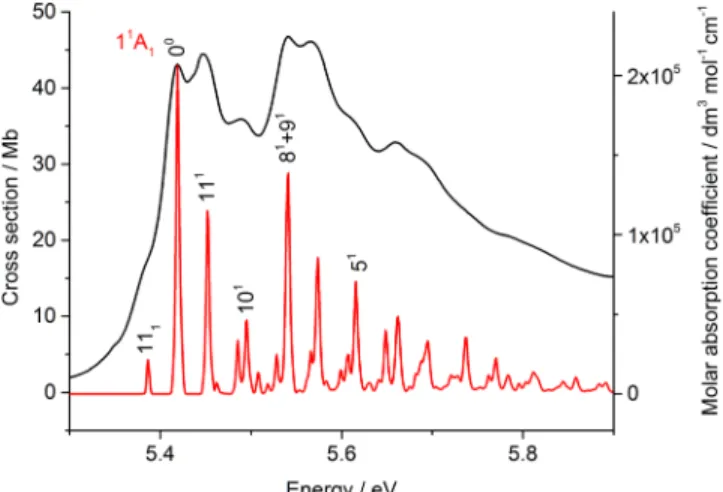
FIG. 7. Super-position of the calculated FC profile of the 11A
1state on the
experimental band B absorption of PhI. The origin of the calculated FC profile has been increased by 0.408 eV to superimpose the experimental band. The fundamental vibrational bands are labelled.
low by this process, and the calculated band has been shifted by +0.408 eV to give a close overlay with the experimental band structure. The calculated vibrational frequencies are in excellent agreement with those observed and the intensities are also acceptable. All of the vibrational structure is assigned to a1modes, notably ν5, ν8, ν9, ν10, and ν11, with frequencies
of 1581, 984, 970, 612, and 266 cm−1, respectively. The fundamental bands are labelled in Fig.7, with the remainder of the bands being due to overtones and combinations of those modes as shown in TableIII.
A ladder generated from the vibrational modes and frequencies observed for band B is shown above the
experimental band A absorption shown in Fig. 6, where
the origin is aligned with the first identifiable band in the spectrum at 4.6 eV. The accuracy with which the legs of the ladder point to the partially resolved structure strongly suggest that the same modes are active in bands A and B.
As described above, this band is assigned to the SOC 2A1state. Since we do not include SOC in our calculations,
we cannot produce a simulation for this band. However, it is clear that neither of our calculated FC Factor (FCF) for the two SOF singlet states in this region, 11B1 and 11B2,
shown in Fig.6, have the required vibrational profiles to give rise to the majority of the observed spectrum. The calculated oscillator strength of the latter is much greater than the former and hence it may make a minor contribution to the total absorption. Indeed, Sage et al.16observed very weak signals
due to the initial 1-photon absorption via a perpendicular transition, i.e., into a B1or B2 state in the long wavelength
region of band A.
The nature of the potential energy surfaces of the SOC 2A1and 5A1 states and how these account for the observed
photodissociation dynamics has been discussed in detail by Sage et al.16In brief, the 2A1state that gives rise to band A
is dissociative in the C–I coordinate at the equilibrium ring geometry and the slow rise in the continuum absorption start-ing at 3.78 eV reflects the increasstart-ing FC overlap along this coordinate. Our calculations confirm that the SOF3B1state,
that is the chief component of the 2A1 state after SOC, is
dissociative. Beginning at ∼4.6 eV, there are absorptions into coordinates that are not dissociative, e.g., the ring breathing modes,ν8and ν9, as shown in Fig.6. The molecule then
sur-vives for several vibration periods before emerging along the dissociative coordinate. In contrast, the 5A1 state that gives
rise to band B does not have a dissociative C–I coordinate at the equilibrium ring geometry and the largest FC overlaps are with bound levels. As above, the molecule survives for several vibration periods before dissociation which in this case involves transfer to dissociative surfaces of lower-lying A1
states.
We have carried out detailed calculations on the SOF 11B
1, 11B2, and 21B1 states in addition to the 11A1 state.
Using the TDDFT method, the calculated energies of the 0-0 transitions of the 11B
1 and 11B2 states are 4.416 and
4.664 eV, respectively, with the maximum of the former at 4.938 eV. The FC calculated vibrational intervals (TableIII) show that 11B1 is dominated by a single progression of ν11
(152 cm−1); 11B2shows a series of fundamentals, in which the
frequencies of the strongest vibrations are 265, 641, 978, and 1459 cm−1. The very weak 11B1state, shown in Fig.6 with
scaled intensity, exhibits a slow rise in strength at the onset and high quanta (v ∼ 20) at the maximum; it is dominated by the 4b1a1∗ configuration. The 11B2 state contains both
the 6b2a1∗ and 2a2b1∗configurations. The vibrational energy
distributions for these two states are totally different, but in both these states, a low-lying σ∗ MO (11a
1∗ in the valence
shell numbering) is present. The 21B
1 state lies in the region of band B but has a
very low intensity relative to that of the overlapping 11A 1
state. It has very similar vibrational structure to the 11B1state,
also being dominated by a single progression in ν11 with a
frequency of 138 cm−1, slightly lower than in the 11B1state
(152 cm−1), and reaching a maximum at v ∼ 50. The similarity between the 11B1and 21B1states is enhanced by the leading
configurations being excitation from 3b1and 2b1into the same
a1∗MO, although the 21B1state has a significant contribution
from the 8b22a2∗configuration (c.f. Fig.1).
Instead of evenly balanced combinations of b1b1∗
± a2a2∗(1A1) and b1a2∗± a2b1∗(1B2), the PhI electronic
struc-ture leads to the dominance of each of these configurations over four ππ∗states. Thus, the lowest1A
1state is dominated by
3b14b1∗with lower densities of 3b15b1∗and 1a22a2∗. Several of
our higher1A
1states have a similar FC profile to that in Fig.7,
including those at 7.367, 8.087, 8.818, and 8.870 eV.
2. The 6.0 to 6.9 eV region
The lowest Rydberg state (3b13s or 3b16s, using either
the valence shell or all-electron numbering) is immediately observable (Fig.8). We have determined the equilibrium struc-ture of this state by utilizing a combination of valence + CRENBL and Rydberg state functions. In general, it is difficult or impossible to obtain an equilibrium structure for a diffuse state such as this, especially in polyatomic molecules; this difficulty arises from the proximity of various valence states in the same energy region and state “swapping” during the optimization process. At equilibrium, the Rydberg state
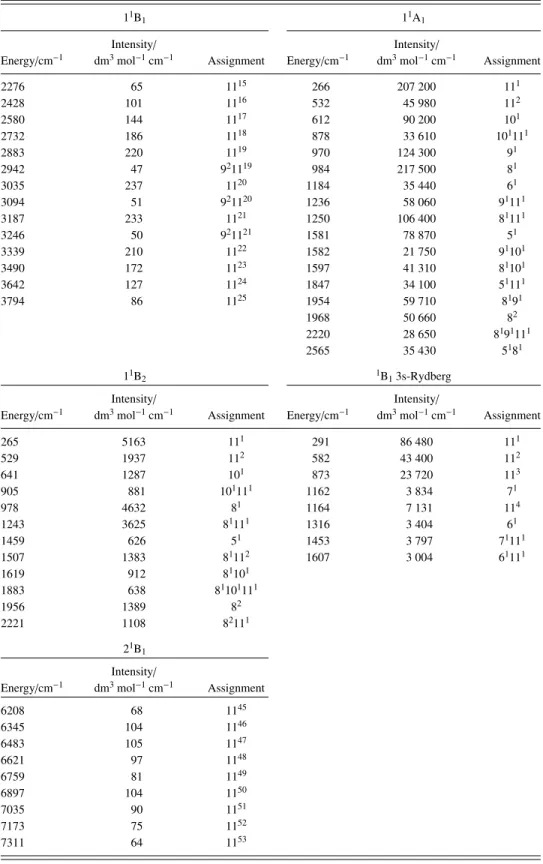
TABLE III. The AEE, their vibrational energies, vibrational assignments, and intensities determined for several low-lying excitations, using the TDDFT method.
11B
1 11A1
Energy/cm−1
Intensity/
dm3mol−1cm−1 Assignment Energy/cm−1
Intensity/ dm3mol−1cm−1 Assignment 2276 65 1115 266 207 200 111 2428 101 1116 532 45 980 112 2580 144 1117 612 90 200 101 2732 186 1118 878 33 610 101111 2883 220 1119 970 124 300 91 2942 47 921119 984 217 500 81 3035 237 1120 1184 35 440 61 3094 51 921120 1236 58 060 91111 3187 233 1121 1250 106 400 81111 3246 50 921121 1581 78 870 51 3339 210 1122 1582 21 750 91101 3490 172 1123 1597 41 310 81101 3642 127 1124 1847 34 100 51111 3794 86 1125 1954 59 710 8191 1968 50 660 82 2220 28 650 8191111 2565 35 430 5181 11B2 1B13s-Rydberg Intensity/ Intensity/
Energy/cm−1 dm3mol−1cm−1 Assignment Energy/cm−1 dm3mol−1cm−1 Assignment
265 5163 111 291 86 480 111 529 1937 112 582 43 400 112 641 1287 101 873 23 720 113 905 881 101111 1162 3 834 71 978 4632 81 1164 7 131 114 1243 3625 81111 1316 3 404 61 1459 626 51 1453 3 797 71111 1507 1383 81112 1607 3 004 61111 1619 912 81101 1883 638 81101111 1956 1389 82 2221 1108 82111 21B 1 Intensity/
Energy/cm−1 dm3mol−1cm−1 Assignment
6208 68 1145 6345 104 1146 6483 105 1147 6621 97 1148 6759 81 1149 6897 104 1150 7035 90 1151 7173 75 1152 7311 64 1153
shows the C–I bond (2.060 Å) is slightly shortened from the X1A
1ground state (2.127 Å). The complexity of the Rydberg
band is apparent from the tail of the progressions; the vibra-tional envelope is dominated by several quanta of the low-frequency mode ν11but other fundamentals including ν7and
ν6with various combination bands also occur. The remainder
of the band between 6.2 and 6.9 eV (see Fig. 4) contains a
group of both singlet and triplet valence states; discussion of this region is deferred to the supplementary material.32
The results showed that in this region, the energy differences between planar ring structures and distortion to CS
symmetry are small, and distortion may also occur for several bands. This leads to additional complexity, since forbidden
1A
FIG. 8. The lowest Rydberg state; there is a close correlation between the observed (black trace) and calculated (red trace) envelopes, but the long tail shows minor differences from the PES band.
3. Bands above 7.0 eV
The strongly absorbing region from 7.0 to 7.5 eV of the VUV spectrum is relatively featureless. Vertical excitation studies suggest that several electronic states lie under this band, where the1A1states have high oscillator strength. The
most intense excited state (AEE 7.322 eV with an f(r) of 0.973) is a symmetric combination of (3b1b1∗+ 1a2a2∗) states.
Although it is a relatively high excitation, the equilibrium structure is close to the C2v ground state, with a C–I bond
length of 2.094 Å. The1B2state at 7.622 eV with an f(r) of
0.581 is largely 2b1a2∗, with a C–I bond length of 2.100 Å, and
all CC and CH bonds lengthened and shortened, respectively, with respect to the equilibrium structure. Above this energy, the equilibrium structures and frequencies for only a few excited states were obtained. A ππ∗state (f(r) 0.196) at 8.054
eV is dominated by complex mixtures of b1b1∗± b2b2∗± a2a2∗
configurations, but still has a structure close to equilibrium with a C–I bond of 2.086 Å and CC bonds of 1.395 ± 0.010 Å. In contrast, the 8.818 eV 1B
2 state (f(r) 0.118) shows
significant structural changes with a C–I bond of 2.188 Å and shortening of the C2–C3/C5–C6bonds.
C. Rydberg states observed in the VUV absorption spectrum
1. Overall aspects
We have used a procedure similar to our previous studies13–15 to enable distinction between the valence and
Rydberg types of spectra. In order to help identify features in the VUV spectrum as Rydberg states, an underlying broad structure made up of several Gaussian bands was “subtracted” from the original spectrum.13–15 The result is
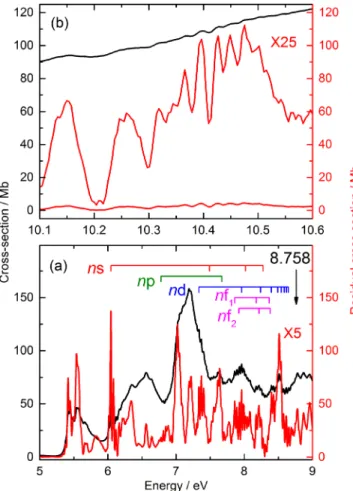
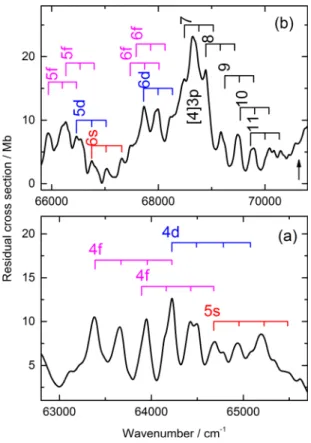
shown in Fig.9(a), where assignments of s-, p-, d-, and f-series converging on the first IE are also shown; such an analysis would be much more problematic without the “subtraction” procedure. This can be seen most clearly in part of the high-energy region of the spectrum shown in Fig. 9(b). The top (black) trace shows the raw spectrum while the lower red trace shows the spectrum which is obtained by subtracting a single
FIG. 9. Low-energy region of the raw (black trace) and “background sub-tracted” (red trace) VUV photoabsorption spectrum of PhI, (a). The latter is generated by subtraction of a set of local Gaussian peaks to generate a flat baseline enabling the Rydberg state structure to be seen more clearly and has been multiplied by a factor of 5. The ladders mark the observed Rydberg series converging on IE1which is indicated by an arrow. High-energy region
of the raw (black trace) and “background subtracted” (lower red trace) spec-trum, (b); the “background subtracted” spectrum multiplied by a factor of 25 is shown in the upper red trace.
Gaussian peak of which the region shown forms part of the rising edge. An amplification of the “background subtracted” spectrum which reveals sharp Rydberg peaks is shown in the upper red trace. The justification of this process is immediately apparent when comparing the narrow (i.e., sharp) vibrational structure of the PES bands responsible for the Rydberg states, with the much broader valence band structure.
The Rydberg states were identified by comparison of the local vibrational structure with individual PES band envelopes and the transition energies of the electronic origins of the states are shown in Table IV. Since the vibrational levels in the Rydberg states are their principal characteristic, it is convenient to use cm−1 as the energy unit. Also shown in
TableIVare the effective quantum numbers, n∗values, of the origins, calculated using the conventional Rydberg formula and the appropriate IE (see TableI), which are used to assign the nl values of the states. We emphasize that the assignments of the Rydberg series are based on comparisons of the n∗ values with those of other polyatomic molecules, e.g., methyl iodide and furan,13–15,47,48 and not on the current ab initio calculations.
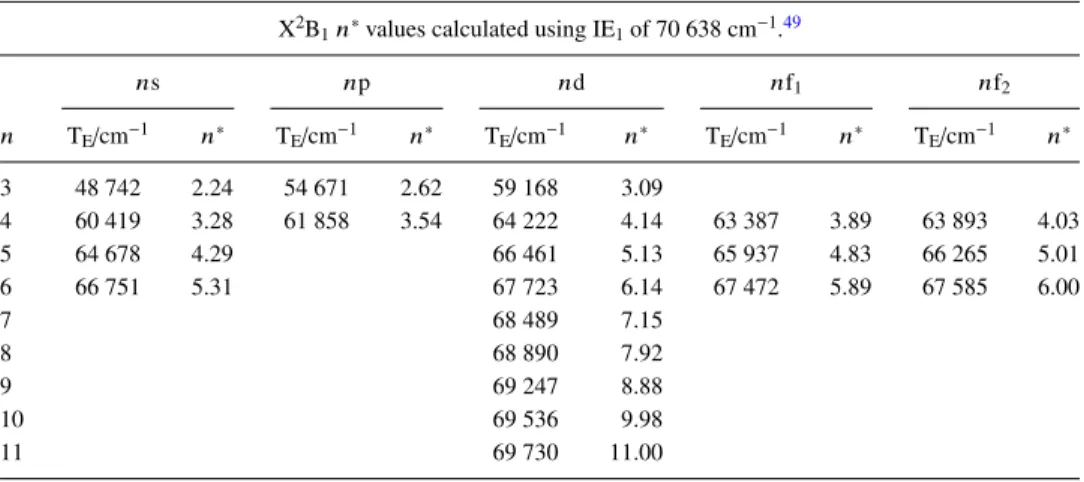
TABLE IV. Transition energies, TE (cm−1) and n∗values of the origin bands of the Rydberg states of PhI
converging on various states of the ion observed in the VUV absorption spectrum.
X2B
1n∗values calculated using IE1of 70 638 cm−1.49
ns np nd nf1 nf2 n TE/cm−1 n∗ TE/cm−1 n∗ TE/cm−1 n∗ TE/cm−1 n∗ TE/cm−1 n∗ 3 48 742 2.24 54 671 2.62 59 168 3.09 4 60 419 3.28 61 858 3.54 64 222 4.14 63 387 3.89 63 893 4.03 5 64 678 4.29 66 461 5.13 65 937 4.83 66 265 5.01 6 66 751 5.31 67 723 6.14 67 472 5.89 67 585 6.00 7 68 489 7.15 8 68 890 7.92 9 69 247 8.88 10 69 536 9.98 11 69 730 11.00 A2A
2n∗values calculated using IE2of 76 663 cm−1.
np n TE/cm−1 n∗ 5 71 551 4.64 6 72 961 5.45 7 74 044 6.48 8 74 734 7.57 9 75 155 8.55
C2B1n∗values calculated using IE4of 85 035 cm−1.
ns np nd1 nd2 nd3 n TE/cm−1 n∗ TE/cm−1 n∗ TE/cm−1 n∗ TE/cm−1 n∗ TE/cm−1 n∗ 3 61 402 2.15 68 708 2.59 70 790 2.78 72 276 2.93 73 633 3.10 4 74 234 3.19 76 389 3.56 77 364 3.78 77 694 3.87 78 058 3.97 5 78 835 4.21 80 284 4.87 6 81 828 5.85 7 82 742 6.92 8 83 222 7.78 9 83 606 8.76 10 83 852 9.63 11 84 099 10.83 12 84 276 12.02
Most of these Rydberg identifications are based on the first ionization energy (IE1, X2B1). Of these, only a single Rydberg
series was identified from the complete sets of two (p-type) and four (d-type) Rydberg series that are 1-photon allowed, but two of the five allowed f-type series were observed. In addition, several Rydberg states based on IE4 (C2B1) were
identified but very few based on IE2 and IE3. In AP1, we
propose that the A2A2and B2B2states of the ion are coupled
to the high-energy region of the X2B1 state and we will
discuss below the consequences of this on the absorption spectrum.
The SOC that affects the low-lying valence states must also impinge on the Rydberg states to some extent. However, we assume that the states that are observable in the VUV absorption spectrum are all predominantly singlet in character and we will omit the “singlet” label in the following Rydberg state discussions.
2. Series converging on IE1
We have identified the origins of ∼20 Rydberg states converging on IE1. The assignments are illustrated in Figs.10
and11in which the ladders indicate v= 0, 1, 2, and 3 of ν11
the lowest frequency totally symmetric vibration, built on the electronic origin indicated. Above n= 6, the nd-, nf-, and
(n+ 1)s-series merge and are arbitrarily labelled nd
in TableIV.
The assignment of the sharp bands with an origin at 48 742 cm−1 (n∗= 2.24) as the 3s state is unambiguous (see above). However, the ν11progression is slightly different
from that of the PES of the ground state of the ion, and of most Rydberg states converging on it, in two respects: (i) the vibrational spacing of 310 cm−1is significantly greater than
the commonly observed value of ∼285 cm−1 (the calculated
FIG. 10. Expansions of parts of the “background subtracted” VUV absorp-tion spectrum of PhI. All Rydberg states have X2B
1ionic cores unless stated
otherwise. The ladders indicate ν11progressions starting at v= 0.
intensities of the bands in the ν11progression are also different.
Both observations indicate an interaction with a second B1
electronic state and our calculations show that a B1 valence
makes a major contribution to the absorption in this region (see Fig. S3 of supplementary material32).
Only one very weak 3p state and one medium intensity 3d state is assigned. The three most intense bands in the region of the 4p states with an onset at 61 460 cm−1 are
separated by ∼220 cm−1, i.e., not consistent with a Rydberg
state based on the ground state of the ion. Therefore, these are assigned as the 3s Rydberg state based on IE4, the C2B1
state of the ion, at 85 035 cm−1, yielding n∗= 2.15. The 4p
state is assigned to three weak bands separated by ∼280 cm−1
and starting at 61 858 cm−1. There are more bands observed
around 64 000 cm−1than can be explained by an extrapolation of what is seen in the 3d/4s region. Consequently, we assign two 4f, as well as one 4d and one 5s state as shown in Fig.11(a). The remainder of the bands up to IE1is assigned
to higher members of these series which merge as n increases as shown in Fig.11(b).
3. Series converging on IE4
The Rydberg series converging on IE4 are indicated in
Fig.12and the transition energies of the electronic origins are presented in Table IV. Transitions to only five IE4states are
1-photon allowed in the 3d/4s region, whereas at least eight peaks can be observed in the spectrum and therefore some of these must be due to Rydberg states with IE2/IE3ionic cores.
FIG. 11. Expansions of parts of the “background subtracted” VUV absorp-tion spectrum of PhI. All Rydberg states have X2B
1 ionic cores unless
stated otherwise. The ladders indicate ν11progressions starting at v= 0. For
n > 6, (n+1)s-, nd-, and nf-Rydberg states are unresolved. The arrow in (b) indicates IE1at 70 638 cm−1.
If the interpretation of the PES is correct, the fingerprint of IE3 is defined by two bands of similar intensity separated
by ∼800 cm−1but no pairs of bands are observed with this separation in this region. Therefore, in this energy region, we assign five bands to the origins of n= 5-9 members of the np-series converging on IE2. In addition, we assign three [4]3d
and one [4]4s states in this region, where [4] denotes a state
FIG. 12. Expansion of part of the “background subtracted” VUV absorption spectrum of PhI. All Rydberg states have C2B
1 ionic cores unless stated
otherwise. For n > 4, (n+1)s- and nd-states are unresolved. The arrows indicate IE1-4.
with an IE4ionic core. The remainder of the bands up to IE4
is assigned to higher members of these series which merge as nincreases as shown in Fig.12.
The PES of the C2B1state of the ion shows a progression
of partially resolved bands separated by ∼210 cm−1. It appears that these bands in the Rydberg states converging on IE4only
become sharp enough to be resolved for n ≥ 8 as shown in Fig. 12. The widths of the bands in the [4]3d region are ∼400 cm−1compared with ∼150 cm−1for those in the n= 10
region. The threshold for the change in the widths is around IE3as shown in Fig.12.
4. Series converging on IE2and IE3
Only one Rydberg series converging on either IE2or IE3
has been identified which we believe is due to their large bandwidths. In AP1, we show that in order to simulate the
observed PES, increasingly large bandwidths are required for the X2B
1, A2A2, and B2B2 state bands. Narrow vibrational
structure re-emerges in the C2B
1state band.
Kwon et al.49also observed a very broad origin band of the
B2B
2state of PhI in their mass analyzed threshold ionization
(MATI) spectrum and equated it to a lifetime of <100 fs, where the lifetime refers to the time that the ion remains in its initially populated level before internal conversion (IC) to a dense manifold of levels of a lower state. Bâldea et al.50,51 also cited fs IC, in this case to the X2B1state, to explain the
broad A2A2 bands observed in the PES of PhF. In PhI, we
believe that the B2B2 state undergoes IC to the A2A2 state
which in turn undergoes IC to the X2B
1 state. We note that
the broadening cannot be attributed to predissociation, since the dissociation energy of the PhI cation (C6H5++ I) is much
higher (11.2(1) eV; 90 334 cm−1).52
The bandwidths observed in the PES have an impact on the Rydberg state peaks observed in the VUV absorption spec-trum since the potentials experienced in the ionic and Rydberg state are similar.9–15 First, the total intensity of any band is
proportional to its area and hence for two bands with equal intensity, the peak height of a broadened band will be much smaller than one which is not broadened and consequently will be difficult to identify in regions where peaks with both widths occur. Second, overlap of these broadened bands will lead a near-continuum absorption leading to additional difficulty in observing them in the spectrum. Both factors can explain why only one Rydberg series converging on IE2 and none
converging on IE3are identified.
The Rydberg series converging on IE4 must be
superimposed on and therefore may couple with these pseudo-continua of Rydberg series converging on IE2 and IE3. The
widths of the [4]nl bands in the [4]3d region in the absorption spectrum are around 400 cm−1, the same as those of the
[2]np-series in the same region and hence are consistent with all of the states being coupled. At energies above IE3, any coupling
will decrease and the Rydberg states converging on IE4will
become relatively sharp as shown in Fig.12. While no states with an IE3 ionic core are identified in the VUV spectrum
of PhI, we will show in subsequent papers that Rydberg series converging on IE3 are prominent in the equivalent
spectra of PhBr and PhCl thus presenting a major contrast.
Furthermore, we have recently obtained an enhanced PES for the perfluoro-compound C6F5I which has made practical a
re-analysis of its VUV spectral data. In the PES, the IE3and
IE4bands are equally prominent and several Rydberg series
converging on both IEs can be identified in the absorption spectrum.
IV. CONCLUSIONS
The interpretation of the experimental UV+ VUV
spectrum of PhI in the 4-11 eV range is by far the most detailed yet reported. The vibrational structure in the spectra has been analyzed using a combination of adiabatic TDDFT and vertical (MRDCI) sets of calculations; the band origins between theory and experiment require only small adjustments of the energy scale (generally less than 0.4 eV) to superimpose the FC vibrational structure from the calculations onto the main experimental bands. Much of the structure of the UV and low energy VUV bands is explicable in terms of the FC analyses presented.
Our simulation of the vibrational profile of the ππ∗ 1A 1
state including hot bands accurately reproduces that of the observed absorption near 5.4 eV, band B, confirming that this state is the main contributor to the band, as expected from its large oscillator strength. In contrast, our simulations of the profiles of the two valence states, 11B
1 and 11B2, both
involving excitation from MO 3b1 and 8b2 into the lowest
σ∗ (a1 symmetry) MO do not reproduce the contour of the
absorption near 4.8 eV, band A. These two states, although both are formally allowed, have particularly low oscillator strengths. Both findings are consistent with the proposal that SOC has to be taken into account to explain the absorption spectrum and photodissociation dynamics in this region.16
The strong band which stands out in the VUV spectrum between 5.9 and 6.9 eV is preceded by the lowest Rydberg state. Several states were identified by TDDFT energy minimization and FC analysis in this energy range, including a pair of ππ∗states with underlying weak vibrational structure.
The strongest individual band in the spectrum shown in Fig.4, lying between 7 and 7.5 eV, is again dominated by ππ∗
states.
The present UV+ VUV spectral profile shows a number of similarities to that of C6F5I,53 with the characteristics of
slow onset (above 4 eV), main ππ∗band near 5 eV, and major maxima above 7 eV; however, in the latter case, the presence of the F-atoms leads to significant shift of the 1A1 and1B2
components of the 7 eV band of the PhI molecule, by the “perfluoro effect.”54
We have made extensive use of FC vibrational profiles observed in the PES to identify the main vibrational progressions occurring in the VUV absorption spectra. A considerable number of Rydberg states were identified at higher energy in the spectrum and, using the raw data from AP1
on ionic states for PhI, the Rydberg states were categorized. The use of the vibrational profiles from the PES is critical to these identifications, owing to the density of states apparent in the VUV spectrum, and in that respect, the TDDFT method proved valuable.
A considerable number of Rydberg series converging on the X2B1 and C2B1states have been identified but only one
converging on the A2A2 state and none on the B2B2 state,
the four lowest ionic states for PhI. We believe that this is due to the B2B2 ionic state undergoing IC to the A2A2
state which in turn undergoes IC to the near-continuum, high-energy region of the X2B1state. Consequently, the [2]nl
and [3]nl series converging on the A2A
2 and B2B2 limits
will be similarly broadened and hence not resolvable in the absorption spectrum. A similarity with the VUV spectrum of C6F5I was noted,53but our recent redetermination of the PES
for C6F5I has led us to conclude that further study of the VUV
spectrum would be essential to complete a correlation.
ACKNOWLEDGMENTS
The authors wish to acknowledge: (a) beam time allocated at the ASTRID2 synchrotron at ISA Aarhus University, Denmark; (b) C. Puglia (Uppsala University, Sweden) and the Carl Tygger Foundation for making available the VG-Scienta SES-200 photoelectron analyser at the Gas Phase beamline, Elettra, Italy; (c) support of the NSCCS (National super-computing service in the UK to M.H.P.); (d) the financial support provided by the European Commission through the Access to Research Infrastructure action of the Improving Human Potential Programme, FP6-Transnational Access Programme IA-SFS:R113-CT-2004-50600; (e) M.B. acknowledges support by the Italian MIUR
(under the Project No. PON01-01078/8) and PRIN 2011
DEMOCRITOS; (f) P.L.V. acknowledges partial funding
from the research Grant Nos. PEst-OE/FIS/UI0068/2014
and PTDC/FIS-ATO/1832/2012 through the Portuguese
Foundation for Science and Technology, FCT-MEC as well as support from the British Council for Portuguese-English joint collaboration. The research leading to these results has received funding from the European Community’s Seventh
Framework Programme (No. FP7/2007-2013) CALIPSO
under Grant Agreement No. 312284. We all thank Professor Vincenzo Barone and Dr. Julien Bloino for helpful discussions and Professor N. J. Mason for access to an earlier recording of the VUV spectrum of PhI.
1M. H. Palmer, T. Ridley, S. Vrønning Hoffmann, N. C. Jones, M. Coreno, M.
de Simone, C. Grazioli, M. Biczysko, and A. Baiardi,J. Chem. Phys.142, 134301 (2015).
2W. C. Price and A. D. Walsh,Proc. R. Soc. London, Ser. A191, 22 (1947). 3K. Kimura and S. Nagakura,Spectrochim. Acta17, 166 (1961).
4H. H. Jaffe and M. Orchin, Theory and Applications of Ultraviolet
Spectros-copy(Wiley, Chichester, 1962).
5M. B. Robin, Higher Excited States of Polyatomic Molecules (Academic
Press, New York, 1974), Vol. 2.
6K. Kimura and S. Nagakura,Mol. Phys.9, 117 (1965).
7T. D. Scarborough, J. Strohaber, D. B. Foote, C. J. McAcy, and C. J. G. J.
Uiterwaal,Phys. Chem. Chem. Phys.13, 13783 (2011).
8X.-P. Zhang, Z.-R. Wei, Y. Tang, T.-J. Chao, B. Zhang, and K.-C. Lin, ChemPhysChem.9, 1130 (2008).
9M. S. Child, Theory of Molecular Rydberg States (Cambridge University
Press, Cambridge, 2011).
10T. F. Gallagher, Rydberg Atoms (Cambridge University Press, Cambridge,
1994).
11R. S. Mulliken,J. Am. Chem. Soc.86, 3183 (1964).
12R. S. Mulliken,J. Am. Chem. Soc.88, 1849 (1966).
13M. H. Palmer, P. J. Camp, S. V. Hoffmann, N. C. Jones, A. R. Head, and D.
L. Lichtenberger,J. Chem. Phys.136, 094310 (2012).
14M. H. Palmer, S. V. Hoffmann, N. C. Jones, A. R. Head, and D. L.
Lichten-berger,J. Chem. Phys.134, 084309 (2011).
15M. H. Palmer, S. V. Hoffmann, N. C. Jones, E. R. Smith, and D. L.
Lichten-berger,J. Chem. Phys.138, 214317 (2013).
16A. G. Sage, T. A. A. Oliver, D. Murdock, M. B. Crow, G. A. D. Ritchie,
J. N. Harvey, and M. N. R. Ashfold,Phys. Chem. Chem. Phys.13, 8075 (2011).
17D. Murdock, M. B. Crow, G. A. D. Ritchie, and M. N. R. Ashfold,J. Chem. Phys.136, 124313 (2012).
18
V. Barone, J. Bloino, and M. Biczysko, 09, Revision A.02, Gaussian, Inc., 2009.
19J. Bloino, M. Biczysko, O. Crescenzi, and V. Barone,J. Chem. Phys.128,
244105 (2008).
20V. Barone, J. Bloino, M. Biczysko, and F. Santoro,J. Chem. Theory Comput.
5, 540 (2009).
21V. Barone,J. Chem. Phys.122, 014108 (2005).
22R. E. Stratmann, G. E. Scuseria, and M. J. Frisch,Chem. Phys. Lett.257,
213 (1996).
23M. E. Casida, C. Jamorski, K. C. Casida, and D. R. Salahub,J. Chem. Phys.
108, 4439 (1998).
24R. Bauernschmitt and R. Ahlrichs, Chem. Phys. Lett. 256, 454
(1996).
25R. J. Buenker, in Current Aspects of Quantum Chemistry, edited by R.
Carbo (Elsevier, New York, 1982), p. 17.
26R. J. Buenker and R. A. Phillips,Theochem24, 291 (1985).
27R. J. Buenker and S. Krebs, in Recent Advances in Multireference Methods,
edited by K. Hirao (World Scientific, Singapore, 1999), p. 1.
28P. J. Hay and W. R. Wadt,J. Chem. Phys.82, 299 (1985).
29W. J. Stevens, M. Krauss, H. Basch, and P. G. Jasien,Can. J. Chem.70, 612
(1992).
30G. Igel-Mann, H. Stoll, and H. Preuss,Mol. Phys.65, 1321 (1988). 31D. Andrae, U. Haussermann, M. Dolg, H. Stoll, and H. Preuss,Theor. Chim.
Acta77, 123 (1990).
32See supplementary material athttp://dx.doi.org/10.1063/1.4916121for the
following: singlet state equilibrium structures; further details of the MRD-CI vertical excitation to singlet states; logarithmic plot of the calculated oscillator strengths for valence states; and the interpretation of the 6 to 6.9 eV region of the VUV spectrum.
33S. Eden, P. Limao-Vieira, S. V. Hoffmann, and N. J. Mason,Chem. Phys.
323, 313 (2006).
34M. J. Frisch, G. W. Trucks, H. B. Schlegel, G. E. Scuseria, M. A. Robb, J.
R. Cheeseman, G. Scalmani, V. Barone, B. Mennucci, G. A. Petersson, H. Nakatsuji, M. Caricato, X. Li, H. P. Hratchian, A. F. Izmaylov, J. Bloino, G. Zheng, J. L. Sonnenberg, M. Hada, M. Ehara, K. Toyota, R. Fukuda, J. Hasegawa, M. Ishida, T. Nakajima, Y. Honda, O. Kitao, H. Nakai, T. Vreven, J. A. Montgomery, Jr., J. E. Peralta, F. Ogliaro, M. Bearpark, J. J. Heyd, E. Brothers, K. N. Kudin, V. N. Staroverov, R. Kobayashi, J. Normand, K. Raghavachari, A. Rendell, J. C. Burant, S. S. Iyengar, J. Tomasi, M. Cossi, N. Rega, J. M. Millam, M. Klene, J. E. Knox, J. B. Cross, V. Bakken, C. Adamo, J. Jaramillo, R. Gomperts, R. E. Stratmann, O. Yazyev, A. J. Austin, R. Cammi, C. Pomelli, J. W. Ochterski, R. L. Martin, K. Morokuma, V. G. Zakrzewski, G. A. Voth, P. Salvador, J. J. Dannenberg, S. Dapprich, A. D. Daniels, Ö. Farkas, J. B. Foresman, J. V. Ortiz, J. Cioslowski, and D. J. Fox, 09, Revision D.01, Gaussian Inc., Wallingford CT, 2009.
35H.-J. Werner, P. J. Knowles, F. R. Manby, M. Schütz, P. Celani, T. Korona,
R. Lindh, A. Mitrushenkov, G. Rauhut, K. R. Shamasundar, T. B. Adler, R. D. Amos, A. Bernhardsson, A. Berning, D. L. Cooper, M. J. O. Deegan, A. J. Dobbyn, F. Eckert, E. Goll, C. Hampel, A. Hesselmann, G. Hetzer, T. Hrenar, G. Jansen, C. Köppl, Y. Liu, A. W. Lloyd, R. A. Mata, A. J. May, S. J. McNicholas, W. Meyer, M. E. Mura, A. Nicklaß, D. P. O’Neill, P. Palmieri, K. Pflüger, R. Pitzer, M. Reiher, T. Shiozaki, H. Stoll, A. J. Stone, R. Tarroni, T. Thorsteinsson, M. Wang, and A. Wolf, , version 2012.1, a package of ab initio programs, 2012, seehttp://www.molpro.net.
36M. F. Guest, I. J. Bush, H. J. J. Van Dam, P. Sherwood, J. M. H. Thomas,
J. H. Van Lenthe, R. W. A. Havenith, and J. Kendrick,Mol. Phys.103, 719 (2005).
37K. L. Schuchardt, B. T. Didier, T. Elsethagen, L. Sun, V. Gurumoorthi, J.
Chase, J. Li, and T. L. Windus,J. Chem. Inf. Model.47, 1045 (2007).
38D. Feller,J. Comput. Chem.17, 1571 (1996). 39A. J. Sadlej,Theor. Chim. Acta81, 339 (1992).
41L. A. Lajohn, P. A. Christiansen, R. B. Ross, T. Atashroo, and W. C. Ermler, J. Chem. Phys.87, 2812 (1987).
42K. Kavita and P. K. Das,J. Chem. Phys.117, 2038 (2002).
43H. J. Hwang, J. Griffiths, and M. A. El-Sayed,Int. J. Mass Spectrom. Ion Processes131, 265 (1994).
44P. Y. Cheng, D. Zhong, and A. H. Zewail,Chem. Phys. Lett.237, 399
(1995).
45H. J. Hwang and M. A. El-Sayed,J. Photochem. Photobiol., A102, 12
(1996).
46M. Kadi, J. Davidsson, A. N. Tarnovsky, M. Rasmusson, and E. Akesson, Chem. Phys. Lett.350, 93 (2001).
47R. J. Donovan, J. T. Hennessy, K. P. Lawley, and T. Ridley,J. Chem. Phys.
138, 134308 (2013).
48T. Ridley, K. P. Lawley, and R. J. Donovan,Phys. Chem. Chem. Phys.6,
5304 (2004).
49C. H. Kwon, H. L. Kim, and M. S. Kim,J. Chem. Phys. 116, 10361
(2002).
50I. Bâldea, J. Franz, P. G. Szalay, and H. Köppel, Chem. Phys.329, 65
(2006).
51E. Gindensperger, I. Bâldea, P. G. Szalay, and H. Köppel,Chem. Phys.338,
207 (2007).
52Y. Malinovich and C. Lifshitz,J. Phys. Chem.90, 2200 (1986).
53S. Eden, M. J. Hubin-Franskin, J. Delwiche, S. V. Hoffmann, N. J. Mason,
and N. C. Jones,Chem. Phys.359, 111 (2009).
54C. R. Brundle, N. A. Keubler, and M. B. Robin,J. Am. Chem. Soc.94, 1466