Fish Consumption in the Age of the Information Society - The Evolution of the Fish Sector in
Portugal
Ana Oliveira Madsen
Católica Porto Business School, Portugal
Valentina Chkoniya
University of Aveiro, Portugal
Abstract
Portuguese consumers are an example to the world when it comes to eating fish. It is a fact that Portugal is EU’s top nation consuming fish, and that the country ranks 3rd in the world in that category. It is something to be proud of. Especially when so many countries are investing millions on/and implementing fish campaigns, in the attempt to increase the consumption of fish. Therefore, this article attempt to highlight some major aspects of fish consumption in Portugal, explaining how, where, and when fish is consumed. To be able to characterize the Portuguese fish consumer, this article had exclusive access to data from Docapesca Portos e Lotas S.A’s data (a government owned company, under the Ministry of Finance and the Ministry of the Sea). Two surveys were conducted (each with 1000 respondents - representative of general of the Portuguese population), one in 2017 and the other one in 2018, using plenty of variables that turned out to be extremely valuable data to market analyses and allowed a very strong comparative analysis. Results include the big impact of Information in the different channels of fish consumption, perceived value of fish, consumers' evaluation of the advantages of fish, expectation when consuming fish, and also the importance of consumer education (as a means to promote change in behavior, if wanted). By providing evidence from Portuguese fish consumption in two different years, this study offers valuable insights for both practitioners and researchers.
Keywords: fish consumption, evolution of consumption, fish sector, consumer behavior, information
Introduction
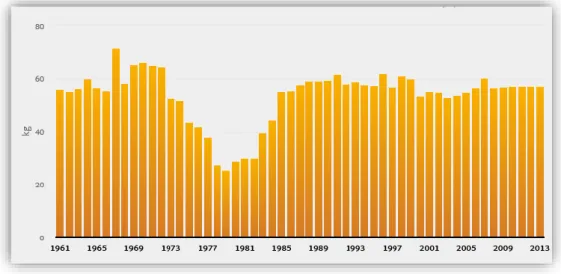
The levels of fish consumption in Portugal have, for decades, been the highest in the world, with 59 kg per capita year (2016). Some justifications to these numbers include culture, tradition, governmental fish campaigns, big efforts from distributors, a very strong presence in the stores and even religion. For sure it is not dependent on the actual fish catches since Portugal does not catch more than 194,000.00 tons/year, a figure that puts Portugal in an insignificant place in EU (3%) and completely irrelevant worldwide (0,1%). In fact, most of the fish consumed in Portugal is imported, with cod fish representing (today) more than 44% of that figure. Main consumed products are salted and dried cod, canned tuna and sardines, salmon, hake, gilt-head seabream and horse mackerel (source: Eurobarometer 2018). Historically, fish consumption per capita in Portugal reached an all-time high of 71.4 kg in 1967 and an all-time low of 25.4 kg in 1979 (Graphic 1). When compared to Portugal's main peers, fish consumption per capita in France amounted to 32, Italy 25 kg, Ireland 21 kg and 39 kg in Spain (2013). The official figures presented on graphic 2 show that Portuguese consumers are on the top of the ranking consuming 59 kg of fish per year, distantly followed by the Spanish that consume 39 kilos per year. Following these two Latin countries we have Finland with 39 kilos and France with an average of fish consumption of 32 kilos; Sweden comes next with 28 kilos. Greeks eat 26 kilos of fish per year, while in Italy and Denmark (8th place) the average is of 25 kilos just above the United Kingdom with 24 kilos. Belgium and Luxemburg (aggregated) have a fish consumption average of 22 kilos per capita/year, and Ireland of 21 kilos. Eating less than 20 kilos per capita/year we have
The Netherlands, Germany and Austria, with 15 kilos, 15 kilos and 11 kilos respectively. Worldwide, Portugal is the 3rd highest fish consuming country - topped only by Iceland and Japan (FAO Fisheries circular No. 821, 2002; FAO 2004; FAO Fisheries Circular No. 972/4, Part 1 2007, 20017). Regarding fisheries production, Portugal ranks 11th in the EU and has an even lower ranking for aquaculture production.
Graphic 1 – Evolution of the levels of fish consumption in Portugal
Source: FAO Fisheries circular No. 821, 2002; FAO 2004; FAO Fisheries Circular No. 972/4, Part 1, 2007; FAO 2015) Graphic 2 - Levels of Fish Consumption in the EU-28– Kg/Per Capita
Source: FAO Fisheries Circular No. 972/4, Part 1 – “Future Prospects for fish and fishery products. Fish consumption in
the European Union in 2015 and 2030; European overviews”. The EU- highlights, The EU in the world; EU market supply; Consumption trade EU landings; Aquaculture production. Maritime affairs and Fisheries – Fish market 2017 Edition
59 45.2 33.9 32 31.528.426.626.324.323.723.322.922.722.222.118.417.317.214.913.613.413.410.78.2 7.8 6.2 6.2 4.8 PO R TUG A L SPAIN FR A N CE LUXE MBURG MA LT A IT A LY SWE D EN LA TV IA UK BE LG IUM FIN LA N D DE N MA R K CY PR US N ET H ER LA N DS IR EL A N D CR O A TIA G R EE CE ES TO N IA LIT H UA N IA PO LA N D G ER MA N Y A US TR IA SL O V EN IA SL O V A KIA CZE CH R EP. R O MA N IA BUL G A R IA H UN G A R Y
Going back in time to understand Portuguese fish consumption habits The Portuguese Discoveries
In the 15th century Portugal surprised the world by transforming its small poor country into a platform for a global empire (Landes, 1999, pg 79). Portugal’s far-flung network of domination stretched nearly three quarters around the world: from Brazil in the west to Japan in the Far East. New waters were navigated, and new economic opportunities were discovered. Even though the economic relevance of reaching Newfoundland (today northern Canada) or Greenland (today part of the Danish kingdom) cannot be compared to all the gold, diamonds, nor the spices, it became a source of fish - especially codfish. Diogo the Teive reached Newfoundland, and was amazed by the amount of codfish in its waters; In 1495 Portuguese navigators reach Greenland and again were surprised by the abundance of fish. 500 years later, almost 50% of the total fish consumed in Portugal is imported dry-salted-cod fish (Menezes et al., 2002). The discoveries were conducted in a period were faith dictated that meat and fats were forbidden during a total of 170 days per year: 40 days of Lent, the sacred Fridays, Saturdays and Wednesdays, the saints’ days and Christmas (Aguilera, 1997, pp. 74; Montanari, 1994, pg 78; Deffontaines, 1948; Kurlansky, 1999 pp 24; Toussaint-Samat, 1992, pp. 315; Fieldhouse, 1986 pp 113). This renunciation indirectly confirmed the centrality of meat (Rozin 1998, pg 45) to the diet of the period and specifically illustrated that in the Christian rank order of food, fish was definitely below meat (Dichter, E 1964, pg 41-42). Christianity considered fish as melancholic, tranquilizing and humble food, all of which were perceived as good food. Clergy and its priests defended the numerous advantages of fish in the purification of the body and soul. Reaching Newfoundland and Greenland in the 16th century was seen as a fantastic opportunity to supply Christianity’s demand for fish, as the fish available in continental Europe were insufficient in quantity and difficult to preserve, and therefore impossible to supply in the villages away from the coast1. Codfish from the northern Atlantic was soon seen as a market opportunity - Ships from Venice would come to Lisbon and Algarve in search for salted fish (Quental, 1871, pg 57). Discovered by the Vikings in their domestic waters, the abundant codfish was dried until it lost one fifth of its weight, and attained a form that would not allow the fish to rot. Soon enough, the Portuguese started to catch codfish themselves and submit it to a double process of preservation: on board salting and inland drying. Both processes were known and utilized since ancient times. The inland drying process allowed long term storage and pillage, and when salted the codfish could keep its nutritive properties for about 6 months. Therefore it could supply the Portuguese religious demand, reaching the small inland villages, without losing its quality, and staying a nutritious and appealing food to eat. Soon it became known as the prince of the oceans2.
The years of the dictatorship
From 1910 until 1926, the republic faced a severe internal instability that produced 7 parliaments, 8 presidents and 50 governments in just 16 years (Barreto, A, 2002, pg 5). In 1926, a military regime took power and suspended political and individual freedom. In this regime Antonio Oliveira Salazar was made in control of the country’s finances. He was so successful that, in 1932, he became president of the ministers’ council. In the first year of his dictatorship, Salazar and the Church allied to transform an event from 1917 into a mass phenomenon. Soon, Catholicism began to be materially imposed on the conscience of the Portuguese. During the regime, illiteracy infected 80% of the population (Rosas, 1994, pg 59), By this time canned fish became a very important trade product3. Canned fish, namely sardines, already had a long exporting tradition to Germany and to the UK back as far as 1898. After 1925 Germany became a major buyer, joining France and the UK. In 1934 the regime created the Portuguese Consortium of Canned Fish to regulate and control the production of
1 Cod fishermen left for the fishing grounds off Iceland and Newfoundland in September, and returned before Lent (middle February). The need for fish on Fridays, had a striking effect on the weekly rhythm of economic activity, and forced European fishermen to work particularly hard on Wednesdays and Thursdays to catch fish for Friday consumption (Simoons, 1994, p. 275).
2 In 1510, Portugal and England made a pack against French codfish fisheries and in 1532 English and Germans were in a war against each other over codfish. The codfish was later, again, the reason for a conflict between Spanish and English in 1585. All of these facts justify the codfish’s nick name of “prince of the oceans”.
canned fish. In the same year, Lagos (south of Portugal) exported 33, 5% and Olhão (South of Portugal) 30% of its productions to Germany. During WWII, canned fish, with the exception of cork (in volume), became the most exported product (347.821 tons of the exported canned fish, worth of 3.563.839 contos (approximately 17.800 thousand Euros). In 1944 exported canned fish represented 31, 54% of the total Portuguese exports. The UK was the largest importer of canned fish, only majored by Germany in 1942 and 1943. Both countries signed contracts with the Portuguese Institute of Canned Fish. During WWII, Germany and the UK absorbed 60 to 95% of the Portuguese Canned Fish. On March 3rd, 1943, a telegram sent by a German officer, sent from Lisbon to Berlin read: “Contact with director of Fish institute gave good results (…) the institute will offer us (Berlin) again 200 thousand boxes. The institute considers possible the conclusion of another agreement”. Important was also the Swiss market in 1941, as it was recognized as a food channel to Germany. This trade had a big impact on the fishing activity (Algarve had 70 factories of canned fish – in 2009 it has only 2 (TSF, 2009)), the number of people working in the sector; and the recognition of canned fish as a Portuguese icon product. Due to its importance to the economy, politics and religion, this pioneer subsector of the fisheyes, embraced by the regime, was going to be seen as one of the most well-known Portuguese products abroad in the XXI century. As we can see in the CocaCola Add from 2008 (figure 1), sardines are a symbol of Portugal.
Figure 1: Coca Cola’s advertisement matching Sardines with Coca Cola
Source: See the whole advertising on Coca Cola’s web-site: http://www.cocacola.pt/CokeFood/Video.aspx After the Revolution: Democracy
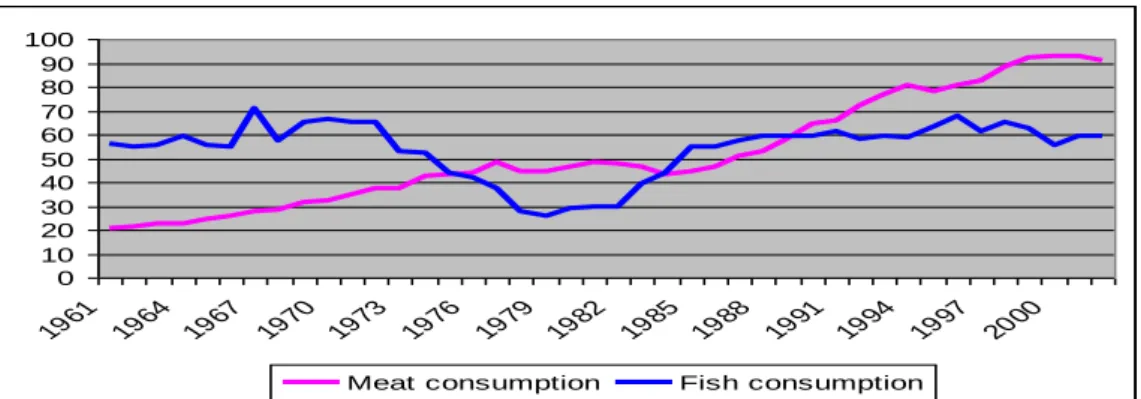
In 1974, a military revolution put an end to Salazar’s legacy and implemented a democratic regime. With a positive post-revolution mentality and the availability of more products in the marketplace, all seemed possible. As a consequence, consumers’ euphoria occurred. For the first time in recorded history meat consumption surpassed fish consumption and from 1974 until 1980, fish consumption decreased dramatically and meat consumption began a growing path (Graphic 3). The interplay of five market occurrences might have led to this shift in consumption: Catholicism losing its power, the migration of the Portuguese living in the former colonies, the decrease of fishery catches1, the increase meat imports, and the increase of salaries.
1 The third reason could be the abrupt decrease of fish catches that occurred between 1973 and 1983. As can be seen in graphic 4,
although fish consumption increased after the minimum 25, 6 kilos per capita of 1979, production did not follow the same path. The production context reflected a social mobilization from the primary sector, fisheries, to the second and third sectors (industry and services) leaving less fishery workers and obsolete boats. The fishing industry could no longer compete with the attractive new sectors from the big cities, where a new lifestyle was being fashioned. This market occurrence, which was extremely relevant for regions along the 1,793 km Portuguese coast which considered fishing as an irreplaceable activity for maintaining the regional identity and providing incomes for many families, stated the beginning of the fishing industry’s fall.
Graphic 3: Evolution of Fish and Meat consumption levels- kilos capita (1961-2004)
Source: Food Agriculture Organization Fisheries Circular No 821 Revision 6 1961- 2002; FAO Fisheries and Aquaculture
Information and Statistics Service - Food and Aquaculture Organization of the United Nations, FAOSTAT on-line – Earth trends World Resources Institute - Annual food supply per capita from fish and fishery products (2003).
Graphic 4: Evolution of Fish production and Fish consumption levels- kilos capita (1961-2004)
Source: Food Agriculture Organization Fisheries Circular No 821 Revision 6 1961- 2002; FAO Fisheries and Aquaculture
Information and Statistics Service - Food and Aquaculture Organization of the United Nations, FAOSTAT on-line – Earth trends World Resources Institute - Annual food supply per capita from fish and fishery products (2003).
Since the revolution the meat sector has more than doubled its production, and dominated consumers’ preferences from 1977 till 1985. The dominance of meat was only temporary, and in 1985 the consumption of fish started to grow again. By the beginning of the 1990’s, fish consumption achieved high figures similar to the ones registered in the 1960’s, but now under a completely different political, religious and social context. What was once a rural country governed by a dictatorship, influenced by strict catholic directives, rand with no freedom of speech was now a democratic society, with a separation between church and state and a fast-developing urban culture. The economic approach would argue that it cannot be a coincidence that from 1980 until 1984 when the salaries fell the consumption of fish went up. The positive correlation between developed countries and meat consumption (Nogueira, 2005; Mee, 2007) actually applies to Portugal where we
0 10 20 30 40 50 60 70 80 90 100 1961 1964 1967 1970 1973 1976 1979 1982 1985 1988 1991 1994 1997 2000
Meat consumption Fish consumption
0 10 20 30 40 50 60 70 80 1950 1952 1954 1956 1958 1960 1962 1964 1966 1968 1970 1972 1974 1976 1978 1980 1982 1984 1986 1988 1990 1992 1994 1996 1998 2000 2002 2004 production consumption
find a positive correlation between salaries and fish consumption from middle 1970’s till 1984. When the democracy began, fish consumption decreased and salaries increased; then salaries decreased from 1980 until 1984 and (as a possible consequence) fish consumption increased. Somehow the explanation seemed to be salary correlated - lower salaries and higher fish consumption. But as revealed in a comparison between income levels and fish consumption in 27 European countries, no immediate correlation is found. The complexity of food consumption seems to warrant more than just a theoretical economic explanation.
After 1979 salaries decreased and fish consumption started to increase again, indicating that the attempt to break with the traditional identity no longer prevailed. A possible reason was the fact that the market, namely the meat sector, did not develop according to this new demand. There was no special attention given to by the Government, nor did the meat sector itself invest in modernizing its infrastructures, and no special attention was given by the media or by the distributors. This, together with the fact that food habits are extremely difficult to alter, led to the return of fish to consumers’ tables. Farb, defended that people tend to eat what they learned to eat when they were young (Farb et al., 1980, pg 88) and habits are acquired early in life and once established are likely to be long lasting and resistant to change (Fieldhouse, 1986, pg 4). Fish consumption increased again in the 80’s because it was part of the Portuguese identity. More important than politics or economic development, food – fish - habits are fundamentally cultural habits that are acquired during the process of socialization. Using Mary Douglas statement that children are trained all their lives to eat certain things can be a useful tool in demonstrating the role of the Portuguese family in supplying food habits. The generation of Portuguese in the middle 1970’s was using food as a language to state a disagreement with the dictatorship’s identity and then felt the need to go back to its food roots. When children, they were introduced (taught), by the family, to eating fish - the training mentioned by Douglas. Portuguese culture and ethnic preferences did not change; a sign of disagreement was sent but once the result was achieved, habits and traditions talked louder.
From EU till present days (1986-2019)
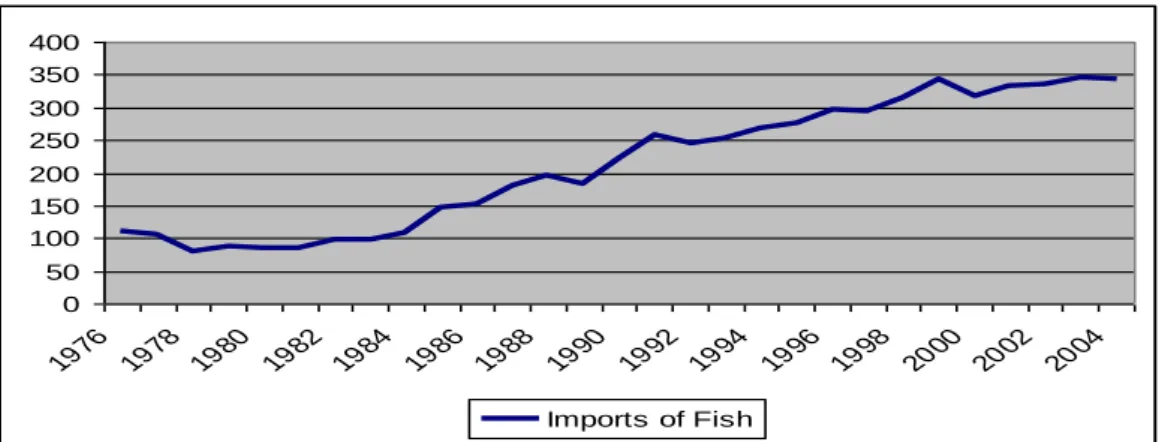
In 1986, when Portugal joined the European Community and its bilateral agreements were replaced by Community agreements1, the fish sector got into a crisis and fish consumption decreased almost immediately. As a consequence of the change and reduction of quotas, the fish sector had an abrupt decrease in its catches in the North Atlantic and cod fish, by far the most important fish species for Portuguese consumers, was no longer available in Portuguese waters. The high pattern of fish consumption in Portugal resulted (and still results) not only from the consumption of the most abundant species in national waters (small pelagic such as the sardine and the mackerel) but mostly from the consumption of dried salted codfish (Gadus Morhua). This fish created profound roots in the food habits of the Portuguese population being perhaps the most marking component of the Portuguese cuisine, achieving the level of national dish and a food category of its own. And so, even though Portuguese fishing activity was concluded in the Northern Atlantic, a significant change in the national consumption of cod did not occur. To feed the demand for this North Atlantic fish, distributors searched for foreign suppliers and the annual consumption of this species remained at high levels (Menezes et al., 2002). As national catches decreased, the national imports of cod increased (graphic 5). Portugal holds the first place in terms of worldwide import trade of wet salted cod (42%), the second place on frozen cod (13%), and the second place along with Brazil on
1 In the mid-1970s an increasing number of coastal states decided to extend their exclusive economic zones (EEZs) from 12 to 200 nautical miles. Almost 90 % of exploitable fish resources came under the control of coastal States. The fleets of the EU Member States, which had traditionally fished in the waters of other countries, suddenly found themselves barred from them. These annual regulations controlled the amount of authorized captures per specie and that amount was the divided by all members of the EU. To ensure continuity of access for these fleets, fisheries agreements were concluded between the EU and the third countries concerned. Agreements were reached with northern countries (including Norway and the Faeroe Islands in 1981, Canada in 1982 and Iceland in 1994), and with southern countries (including Senegal in 1979, Guinea Bissau in 1980, the Republic of Guinea in 1983, and the Seychelles in 1984). The regulations were fundamentally based on an expert biological point of view and on forecasts about the species evolution. Portugal and it’s approximately 1.700.000 km2, due to the Acores islands, has the largest Exclusive Economic Zone of the EU-15, (Menezes, et al., 2002).
dried salted cod (27%); its major import sources are Norway, Denmark and Iceland, respectively with 49% and 27% and 19% over the period. Over the period from January 1988 to December 1999 Portugal imported a total of 457,000 tons of frozen cod (13% of the total), 2,179,000 tons of wet salted cod (60% of the total), and 989,000 tons of dried salted cod (27% of the total)1. For the national imports of wet salted cod, Norway holds the first place as supplying country (40% over the period), but its weight has been decreasing since 1994 in favor of Iceland (24% over the period). In 1999 the national imports of wet salted cod from both countries were rather close (60,000 and 55,000 tons respectively). Finally, the national imports of dried salted cod come fundamentally from Norway and Denmark, respectively with 49% and 27% over the period.
Graphic 5: Evolution of fish imports 1976-2004
Source: Food and Agriculture Organization of the United Nations (FAO) Fishery Information, Data and Statistics Unit. 2006.
Commodities production and trade 1976-2004. FISHSTAT plus - Universal software for fishery statistical time series. Rome: FAO.
It was also in the middle of the 1980’s that a new kind of market player was developed, the big supermarket groups – the biggest being Sonae and Jerónimo Martins - and with them, came a more efficient distribution systems (like the creation of their own fish warehouse centrals which was the turning point in logistics and sales) and alliances. This distribution systems pushed consumption forward, and fish consumption increased again. Distributors made heavy promotions of their brand name and trustworthy image to be linked with their unbranded products. Consumers started to be constantly confronted with small offers, contests, TV commercials, in-the-door- brochures, radio advertisements and attractive prices. In the 1980’s fish consumption grew almost 34 kilos, (from 25, 6 till 59, 1 kilo per capita) higher than meat consumption (that in that period was around 50 kilos per capita), very similar to the days of the dictatorship. This supremacy of fish over meat was the result of the hard work by the distributors and producers (like the frozen fish brands Pescanova and Iglo). But this time, and to complicate the economic approach, salaries increased too. Joining the EU injected money into the economy.
The 1990’s were a growing decade, where the country developed considerably. Consumers lived an economical euphoria, and consumption patterns of fish and meat reached similar figures as in the 1974 revolution except that now the population
1 Between 1988 and 1999 cod imports increased about 10% in quantity. This increase was basically due to the explosive growth of frozen cod imports (multiplied by 100 in 10 years), and 22% increase of dried salted cod imports. The imports of wet salted cod, in turn, decreased 23% over the period. The effect of these variations on the structure of imports was important, with emphasis to the increase in the share of frozen cod (insignificant in 1988 and 21% in 1999), the reduction of the share of wet salted cod (76% in 1988 and 53% in 1999), and the relatively steady state of the share of dried salted cod (23% in 1988 and 26% in 1999).
0 50 100 150 200 250 300 350 400 1976 1978 1980 1982 1984 1986 1988 1990 1992 1994 1996 1998 2000 2002 2004 Imports of Fish
was eating more proteins. Even though it was exceeded by consumption of meat, fish consumption kept growing, like the Portuguese economy. Consumers are now exposed to a series of governmental and EU fish campaigns, which intended to maintain fish consumption, now confirmed on national television by doctors and backed by scientific studies as a healthy product1. As a result, fish consumption reached 67.8 kilos in 1996. In 2000 the government embraced a campaign called ProPescas2 which aired for 3 years. Results were very positive (Source:Pescanova, Continente, Jerónimo Martins). By the end of 2013 Fileira do Pescado/Row-of-fish - a nonprofit group that brings together the most representative organizations in the fisheries sector, aquaculture, processing and marketing of fish - introduced the Portuguese-Fish brand in the Portuguese market (figure 2). This new logo was a development from an already existing logo, which pretended to identify the fish that was/is caught in Portuguese waters, by Portuguese fishermen and sold in daily national fish auctions. This new version combines the Portuguese colors with the already known logo from the fish auctions. Fileira do Pescado’s intention with this “adding of the Portuguese colors” was to bring the good perception and positive recognition of the Portuguese fish directly to its products.
Figure 2: New/improved auction fish logo. Source: Docapesca, 2013
By this time fish distributors/supermarkets invested in fish campaigns (TV, radio and brochures) so to give relevance to fish and maintain it part of consumers’ chosen products. Jerónimo Martins and Sonae went even further and built platforms/fish-warehouses in the center of Portugal so to better accommodate and distribute the fish. Salted dry cod - being easy to preserve - became the most consumed fish species in Portugal and salted dry Codfish represented (in 2008) 50% of Sonae´s fish sales3. On the other end, all the public feeding institutions were/are forced to follow government directives on amounts of vegetables, proteins, and carbohydrates; fish is logically present in alternation with meat. All of these private and national interventions had positive results.
It is a fact that Portugal has a strong cultural identification with fish but the figures presented before are also due to the work and strong investment of food distributors. Food distributors, supermarkets, hypermarkets, and frozen fish brands invest largely in door mailings, TV commercials and advertising in magazines. It is impossible to find a supermarket or a
1 When to buy fresh fish consumers should be aware of some cues that will make it easier to have a successful dish namely: a) the smell of the fish shouldn’t be strong. Consumers should be able to “smell the Sea” and not ammoniac, or “strong fishy”, b) the skin of the fish has to be shining, with distinguishable pigmentation. The color should be strong- not paled. When the fish is not fresh the skin gets a tarnished color and the scales start detaching from the fish, c) the eyes have to be prominent, transparent cornea and a black shining pupil d) the gill will be shining, reddish and with no mucus - with time gill gets yellow and with mucus e) the fish meat should be firm and elastic. When fish is no longer fresh the meat loses elasticity, softens and gets reddish around the main bone f) the fish spine can also cue freshness. When it breaks- making a “click”- the fish is fresh. If it detaches from the fish meat it means that it’s been out of the water for a long time g) fish also has a membrane, in the abdominal, part that should adhere completely h) Fresh fish should be eaten within 1 to 2 days of purchase (In DECO Portuguese Consumer Defense Organization).
2 It had its equivalent in other EU countries, from 1996 till 2002. 3 Interview with Sonae in 2008.
hypermarket without a significant fish section; large assortments of fish are always carefully decorated and regularly advertised in the media.
Promotions are considered essential and crucial when it comes to fresh fish; every week the biggest distributors have advertisements of fish on prime time TV. A lot of investment is also directed to fish labels/logos. It is believed that labels can improve consumers’ quality transparency of a product and also give consumers another means of inferring characteristics of that product (Johnson, et al., 2001). In Portugal fresh fish must be labeled with the commercial denomination of the specie, the production method (deep waters or nursery) and the capture zone. To further influence consumers with labels, Portuguese hypermarkets have created, in the 2000’s the “Sea day” – and also the “meat day”. In a winning attempt to bring consumers to the stores on the day that distributors receive these perishable products in the largest assortment, distributors have created a logo associated with the day of the week they want consumers to buy their fish. Then with heavy advertisements focusing on quality, freshness and variety, they present the fish to the consumer in an easy to purchase context.
According to AcNielsen, brands like PescaNova, Iglo, Geldouro, Gelpeixe, Frip or even the new-comer, Danish brand Royal Greenland, sold up to 9.000.000 kg of frozen fish in Portugal throughout 2006. As was evident in this example, investments in advertising are a priority to broaden the market for a product. The maintenance of the high levels of fish consumption in Portugal and the recognition of fish values comes as a consequence of hard work and heavy investments in fish campaigns for children (the creation of a consumer’s club specially for children ex. PescaNova Clube do Grumete with its Jornal de Bordo). In 1974 Iglo created it’s very famous Capitão – something that, some years latter was copied by PescaNova, but it never reached the Capitão’s recognition. So it is clear that 21st century media gives lots of space to fish; fish appears in all TV cooking programs, cookbooks, recipes distributed by female magazines; newspapers and it is the topic of prime time TV national news. As Simmons writes, it would be difficult for the food press media to avoid fish as in Portugal fish is such an important dietary element that it is difficult to imagine how people could survive without it (Simoons, 1994; p. 253).
XXI’s century diet – what is the Portuguese fish reality nowadays?
The Portuguese diet is widely recognized of offering a diverse selection of meat and fish products (Kittler, 1989). This can be confirmed in all Portuguese public subsidized feeding institutions like school cantinas, retirement homes, prisons, and hospitals; and also on restaurants’ menus, which include as many fish meals as they include meat meals – thus, influencing individual and family food habits. Fish’s constant presence in menus reinforces its consumption habit and turns eating it into something completely usual. Teaching children that this is the proper way to eat (otherwise, why would the school offer it in the first place?), helps forming mentalities and reinforces the families’ teachings – or helps create them if not followed by the families. The fact that children cannot influence the food choices at home is also a fact that cannot be diminished when thinking about the influence that these cantinas. University cantinas help to maintain these habits as they offer alternatives for many students that lack the time and money to eat healthy food and resort to consuming pizzas, burgers, sausages and so on. Feeding institutions and social forces encourage people to continue to sample fish when eating at a cantinas etc, and to include prepare it at home. The pulley relation results from the aforementioned fish information, and therefore, forms habits and tastes.
Portuguese daily expressions are also a good example to understand the relevance (still) given to fish
There are lots of expressions in Portuguese language that reflect the importance – and the centrality – that fish has in society. “Fish size does not mean quality”; ”From the mouth dies the fish”; ”Sardines are like women, we want them small and tasty”; ”Truth is like a small fish, gets free between our fingers”; ”To a given fish, we are not picky”; ”The son of fish know how to swim”; ”Cod, the loyal friend”.
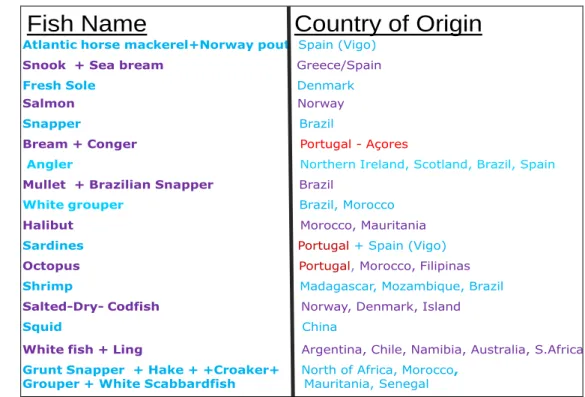
Table 1: Fish consumed in Portugal and its origins
Fish Name
Atlantic horse mackerel+Norway pout Spain (Vigo)
Country of Origin
Snook + Sea bream Greece/Spain
Fresh Sole Denmark
Salmon Norway
Snapper Brazil
Bream + Conger Portugal - Açores
Grunt Snapper + Hake + +Croaker+ North of Africa, Morocco, Grouper + White Scabbardfish Mauritania, Senegal
Angler Northern Ireland, Scotland, Brazil, Spain
Mullet + Brazilian Snapper Brazil
White grouper Brazil, Morocco
Halibut Morocco, Mauritania
Sardines Portugal+ Spain (Vigo)
Octopus Portugal, Morocco, Filipinas
Shrimp Madagascar, Mozambique, Brazil
Salted-Dry- Codfish Norway, Denmark, Island
Squid China
White fish + Ling Argentina, Chile, Namibia, Australia, S.Africa
Source: Data from Sonae, Jerónimo Martins, PescaNoca and Iglo (2008, 2010, 1013) Fish campaigns in EU
Whether carried out by public authority or by private operators or organizations, campaigns are a well- developed and widespread instrument to promote fishery and aquaculture products. Their objective is to increase the consumption of fishery and aquaculture products by raising consumer awareness of the products’ health/nutritional benefits in the human diet. A total of 685 promotional campaigns and projects to promote consumption of fishery and aquaculture products and to improve the image of these products were carried out between 2007 and 2015 in 26 EU Member States. No relevant campaigns were carried out in 2 EU Member States (Austria and Luxembourg). France, Portugal, and Italy’s many campaigns focused on strengthening the image of local fishery products, highlighting underutilized regional species as a potential driver of their regional and national economic development. Some of the conclusion regarding consumption in Portugal showed that in 2012 large scale retail became the most dominant sale channel (with 45,6% in value), mainly due to the 2010 legislation that allowed such stores to have more flexible opening hours (Source: EU consumer habits. Fishery and aquaculture products. Annex 3. Mapping of national campaigns. EUMOFA. 2017 European Commission)
What will the future bring? Fish consumption in the age of the Information Society
New times, new ways of interpret consumption. When we talk about people born between 1980 and 1995 (Generation Y), we need to accept and comprehend that they do not know the world without having constant access to technology – they have grown up surrounded by smart phones, laptops, tablets and other gadgets. They were the first wave of the digital generation born into the world of technology. They are highly qualified in digital knowledge therefore it is easy for them to quickly acquire the use of new tools and devices in Information and Communication Technologies (Bencsik et al., 2016). Generation Y prefer to communicate more quickly and effectively via email, social networks or text messaging as opposed
to traditional means of communication. Generation Y’s prefer communication via email whereas the baby boomer generation (two generations back) prefer to pick up the phone. They easily accept changes, they live for today and they do not like to plan for long periods; they rather want to enjoy themselves in their own world. Their circle of friends is virtual, they mainly nurse their relations on social sites, they easily accept cultural differences and they really like living a quick life (Krishnan et al, 2013). Generation Y is characterized by “multitasking”, the multi-sided and shared attention (Schäffer, 2015). For them, the concept of success, career and money is of top priority - because they have learned that it is the only thing that can advance them in consumer society (Tari, 2010). Using modern technological devices, their communication mainly happens in the virtual space and their online presence is never-ending. They use social networking sites, such as Facebook, Twitter, etc..., to create a different sense of belonging, make acquaintances, and to remain connected with friends (Woodman, Dan (2015). According to Neil Howe and William Strauss’s book “Millennials Rising: The Next Great Generation (2000)”, generation Y are more open-minded than their parents on controversial topics and civic-minded. But what do they eat and what are the preferences/habits regarding fish?
Methodology
To be able to answer the last question, we have studied/implemented the following: Procedure and sample
To analyze the evolution of the Fish sector in Portugal we used Docapesca Portos e Lotas S.A’s data (a government owned company, under the Ministry of Finance and the Ministry of Sea). Two surveys were conducted (each with 1000 respondents - representative of general of the Portuguese population), one in 2017 and the other one in 2018, using plenty of variables that turned out to be extremely valuable data to market analyses and allowed a very strong comparative analysis. Data was collected using quota sampling, representative of Portuguese population according National Statistics Institute (INE), as non-probability sampling technique, by using a socio-demographic variable such as sex (49,1% Male and 50,9% Female), age (16/24 years with 9,1%, 25/34 years with 16,8%, 35/44 years with 18,5%, 45/54 years with 18,1%, 55/64 years with 16,6%, 65 years or more with 20,9%), and region according to Nuts II (35,2% of North, 25,0% of Centre, 27,7% of Lisbon, 8% of Alentejo, 4,1% of Algarve). In terms of the descriptive statistics it represents a demographic profile with following Education level 2017 vs 2018: Primary (19,2% vs 13,8%), Secondary (48,8% vs 48,2%) and Higher (32,0% vs 38%).
The questionnaire was anonymous in order to guarantee a higher level of participation and honesty. Each question was debated by a multidisciplinary team composed of nutritionists, marketing and survey specialists, representatives of commercial companies, statisticians, and people experienced in the seafood sector. Furthermore, the attained preliminary questionnaire was sent to a group of twenty individuals outside the expert group with the purpose of assaying the clarity, simplicity, and appropriateness of the various questions. During this process, several alterations were introduced, but the overall architecture of five sections was kept in the final form of the questionnaire. The fish products were chosen on the basis of consumption importance in Portugal.
In order to reach a large universe and different ages and geographical regions of the country, a telephonic medium was the natural option. Survey for the general of the Portuguese population was contacted in order to understand an evolution of seafood consumption patterns in general.
Statistical analysis
Statistical analysis was carried out using the SphinxIQ software (Sphinx Company, Montréal, Canada), which enabled to analyze the overall distribution of respondents as well as the consumption preferences and frequencies affected by the independent variables. The difference of means between pairs was resolved by using confidence intervals in a Tukey HSD test. Level of significance was set for p < 0.01.
Results and Discussion
Place of purchase of the fresh fish in the Portuguese population
Concerning place of purchase of the fresh fish, the universe of respondents clearly continuous to prefer supermarkets to local markets, 54.1% vs 17,6% in 2017and 49,8% vs 24,2 % in 2018 (p < 0.01, Khi2=632.44, dgl=3(MS)). Although it is possible to notice a slight purchase transfer from supermarkets to local markets, which goes in line with fresh food purchase, in general.
Concern about the origin of the fish
Portuguese population is more and more careful with the origin of the fish they consume. Concern ranged 3,37 by 5-point Likert type scale with 48,6% for TOP 2 boxes (agree/totally agree) answers in 2017 vs 3,62 with 59,3% for TOP 2 boxes in 2018 (p = 0.00 Khi2=231.63, dgl=4(MS)).
Perception of the Portuguese fresh fish
Portuguese consumers perceive Portuguese fish as the best fish in the world, ranged 4,05 by 5-point Likert type scale with 67,8% for TOP 2 boxes (agree/totally agree) answers in 2017 vs 4,37 with 81,2% for TOP 2 boxes in 2018 (p = 0.00 Khi2=1158.19, dgl=4(MS)). This is a very strong reason why it is important to understand the sustainability issue for different species.
Availability for transfer of consumption for fish of lower stock
Portuguese population is very traditional regarding fish consumption (Coelho et all, 2018) and at the same time Portuguese waters are abundant in different devalued species. That is why, it was important to understand an availability of transfer of consumption for fish of lower stock, which is a key point that guaranties a sustainability (Docapesca, 2018).
The data reveals that Portuguese population does not show availability of transfer of consumption for fish of lower stock yet, ranged 2,91 by 5-point Likert type scale, with 32,9 % for TOP 2 boxes (agree/totally agree) answers, in 2018 (p < 0.01, Khi2=39.51, dgl=4(MS)).
On the other hand, and as it was described previously (Madsen & Chkoniya, 2018), Cod is considered, by far, as the national fish – even though it does not swim in Portuguese waters. According to the Cod Industry Association, and according to the Norwegian Seafood Export Council, 20% of all the Cod captured in the world is consumed in Portugal – a total of 70.000 tones, 70% of which comes from Norway.
As a curiosity, Portugal is the only country in Europe that consumes more Cod than salmon. Knowledge about the fresh fish market in the Portuguese population
In 2017 only with 38,9 % for TOP 2 boxes (agree/totally agree) answers, considered themselves fish connoisseurs, ranged 3,24 by 5-point Likert type scale (p = 0.00 Khi2=177.43, dgl=4(MS). Even less of Portuguese population considered themselves fish connoisseurs in 2018, ranged 3,14 by 5-point Likert type scale with 37 % for TOP 2 boxes.
It is for this reason that it is so important to pay attention to the education of the Portuguese population regarding seafood. The best source of information about seafood
Various market reports indicate that population in Portugal often look for healthy food solutions and perceive seafood as a fundamental part of it (Coelho et all, 2018). This is why it is so important to give them the best source of information. The data collected indicates that TV continuous to be the most important source of information regarding seafood with 60.1% in 2017 vs 61,7% in 2018. It is then followed by the social media (Facebook, Instagram e etc.) with 33.9% in 2017 vs 38,4% in 2018, while other sources of information attract the least attention (p = 0.00 Khi2=9852.88, dgl=20(MS).
Conclusion
The previous historical explanation serves as a background to understand how the market and its agents influenced actual food patterns. Food habits are established and maintained because there are effective, particular and meaningful behaviors in a particular culture (Fieldhouse, P, 1986). After centuries of imposition of fish -forbidding meat to be precise- , the Catholic religion has controlled food habits in the Portuguese society. It is true that the Catholic religion has no longer the power to influence the Portuguese diet, but once food habits are acquired, especially early in life, they are likely to be long lasting and resistant to change. In another words, fish became part of the Portuguese food basket, and became a domestic food product to the families. Families recognize value in fish, including it frequently in their meals; in turn, children learn to appreciate its taste. Many of the advertisements for fish are actually, and intelligently, targeted to the youngsters. It is a fact that the fish sector, it represents less than 1% of the GDP, 0.6% of total employment and fish catches below average in EU and in an insignificant place worldwide; nonetheless it survives; Survives due to the efforts made by the distributors, frozen fish companies and the media, which supply Portuguese consumers with an important element of their culture, taking all the advantages out of that. And more, the market itself maintains this identification with fish into consumers’ habits. Advertisements, either of a product or of a government national campaign, almost with no exception focuses on the sun, the beaches, the cork lands in the south, the mountains in the north and definitely the fish. Even Coca cola could not resist going also this way!
It is a part of Portuguese identity and a way that helps consumers understand themselves in the world. In the case of Portugal consumers are highly exposed to the very rooted fish products; history shows that religion and obedience have been a common denominator in this country for many centuries. Restricted by traditional religious ideologies (with its symbolisms and morals) the country’s meat consumption never reached high levels, and created an imposed space for generations after generations to develop their skills on how to prepare fish, which created deeply rooted habits in the population - indirectly nurturing fish and its consumption. The Portuguese give high importance to fish products because they have always been present in their society, through, by example memories of old glories from the sea, statues to the fishermen, politicians dancing with fisherwomen, by including fish in their daily expressions, and more recently through the power of food distributors. Portuguese imagery is full of fish (Herbert Blumer 1969, pp 95 in Mennell et al., 1992, pp4), as is apparent through the high levels of fish consumption. Fish is a highly domesticated product and that is reflected in the actual consumption levels. Portugal is the 3rd biggest consumer in the world.
Consumers’ combinations and mixtures of the market produced narratives, led to a tight consideration of them as part of their national identity. The Portuguese identity is full of fish - rituals, schools doctrines, and communicated acts. Political attention and economic investments that have built the market systems have been channeled to different products in both countries. The identity of the population, which was created consistently through time by the market system, has produced opposite fish consumption patterns.
In 2019 no one is afraid of not going to heaven by eating meat on Fridays, and no one will lent based on catholic religion like before 1974; fish is no longer consumed because of those reasons. Fish is available in all supermarkets, fresh, frozen, with bones and without. If historically it was religion diffusing the message, and people would design their diet with fear of being punished by God, nowadays it is the distributors of fish that make sure fish is always present in consumers’ minds. Distributors sell up to 600,000,000 kilos of fish per year (2008): half of which is salted dry codfish, 70,000,000 is frozen branded fish, and 200,000,000 are of fresh fish and 30,000,000 bulk frozen fish. But to keep up with the tradition the distributors have to go and buy it all over the world.
The facts described in this paper give a good perspective of how the fish market system has changed, evolved, invested and rejuvenate all over the years, so to keep its levels of consumption high. It could have stagnated; it could have fallen; instead it has grown! 500 years have passed since codfish was introduced to Portuguese cuisine, and we can still find remarkable traces of the reasons why it became so popular.
References
[1] AcNielsen (2004): “Total Portugal, peixe congelado, vendas em valor e em quantidade, preço médio, e estratificação de mercados em quantidade”.
[2] Aguilera, César (1997): “História da Alimentacao Mediterranica”- Terramar editors.
[3] Barreto, António (2002): “Mudança social em Portugal, 1960/2000”- Instituto de Ciências Sociais da Universidade de Lisboa
[4] Bencsik, A., Horváth-Csikós, G., Juhász, T. (2016): “ Y and Z Generations at Workplaces”. Journal of Competitiveness. Vol. 8, Issue 3, pp. 90 – 106
[5] Coelho, Teresa; Chkoniya, Valentina; Madsen, Ana Oliveira (2018): “The (R) evolution of the fishing sector in Portugal. Building a support for the coming generations" Georgiant Technical University and University of Foggia (2018) ISBN 978-9941-28-403-8
[6] Data from Sonae, Jerónimo Martins, PescaNoca and Iglo (2008, 2010, 2013) – part of the Ph.D dissertation of Ana Madsen “Market Systems and Cross Cultural Differences in Consumption Patterns: The case of fish in Portugal and Denmark”.
[7] Deffontaines, Pierre (1948): “Géographie et religions”. Second edition. Paris: Gallimard.
[8] Dichter, Ernest (1964): “Handbook of consumer motivations: the psychology of the world of objects”. McGraw-Hill
[9] Docapesca 2018. In Coelho, Teresa; Chkoniya, Valentina; Madsen, Ana Oliveira (2018): “The (R) evolution of the fishing sector in Portugal. Building a support for the coming generations" Georgiant Technical University and University of Foggia. ISBN 978-9941-28-403-8
[10] Docapesca, 2013. In Coelho, Teresa; Chkoniya, Valentina; Madsen, Ana Oliveira (2018): “The (R) evolution of the fishing sector in Portugal. Building a support for the coming generations" Georgiant Technical University and University of Foggia. ISBN 978-9941-28-403-8
[11] Douglas, Mary (1972): “Deciphering a Meal” – Daedalus. Journal of American Academy of Arts & Sciences: Winter, Myth, Symbol & Culture.
[12] EU consumer habits. Fishery and aquaculture products. Annex 3. Mapping of national campaigns. EUMOFA. 2017 European Commission
[13] EUROBAROMETER 2018 – European Market Observatory for Fisheries and aquaculture products. (April 2018). [14] FAO Fisheries circular No. 821, 2002; FAO 2004; FAO Fisheries Circular No. 972/4, Part 1 2007, 20017 [15] FAO Fisheries circular No. 821, 2002; FAO 2004; FAO Fisheries Circular No. 972/4, Part 1, 2007; FAO 2015 [16] FAO Fisheries Circular No. 972/4, Part 1 – “Future Prospects for fish and fishery products. Fish consumption in
the European Union in 2015 and 2030; European overviews”. The EU- highlights, The EU in the world; EU market supply; Consumption trade EU landings; Aquaculture production. Maritime affairs and Fisheries – Fish market 2017 Edition
[17] Farb, Peter; Armelagos, George (1980): “Consuming passions- the anthropology of eating” Houghton Mifflin Company. Boston.
[18] Fieldhouse, Paul (1986): “Food and nutrition: Customs and culture”- London, Helm
[19] Food Agriculture Organization Fisheries Circular No 821 Revision 6 1961- 2002; FAO Fisheries and Aquaculture Information and Statistics Service - Food and Aquaculture Organization of the United Nations, FAOSTAT on-line – Earth trends World Resources Institute - Annual food supply per capita from fish and fishery products (2003).
[20] Food and Agriculture Organization of the United Nations (FAO) Fishery Information, Data and Statistics Unit. 2006. Commodities production and trade 1976-2004. FISHSTAT plus - Universal software for fishery statistical time series. Rome: FAO.
[21] Herbert Blumer 1969, pp 95 in Mennell, Stephen; Murcott, Anne; Van Otterloo, Anneke H (1992): “The Sociology of food- eating, diet and culture”- Sage publications. International Sociology Association.
[22] Johnson, R. J., C. R. Wessells, H. Donath, and F. Asche (2001): “Measuring Consumer Preferences for Ecolabeled Seafood: An International Comparison.” Journal of Agricultural and Resource Economics 26(1):20– 39.
[23] Kittler, Pamela Goyan (1989): “Food and Culture in America: A Nutrition Handbook by Pamela Goyan Kittler”. Van Nostrand Reinhold.
[24] Krishnan, S. K., Bopaiah, S., Bajaj, D., & Prasad R. (2013): “Organization, Generation, and Communication – Infosys Experience”. NHRD Journal. 10, 85-93.
[25] Kurlansky, Mark (1999): “Cod: a bibliography of the fish that changed the world”. London. Vintage.
[26] Landes, David S. (1999): “The wealth and poverty of nations: why some are so rich and some so poor”. Abacus. [27] Madsen, Ana Oliveira, Chkoniya, Valentina (2018): “Tendencies Regarding Fish Consumption – The case of Portugal (Europe’s leader & 3rd in the world)”. EUSER EUROPEAN CENTER FOR SCIENCE EDUCATION AND RESEARCH (2018)
[28] Mee, Laurence (2007): “Oceans in Crises”, In: “Global Researcher – exploring International Perspectives”. School of Earth, Ocean & Environmental Sciences.
[29] Menezes, Rui; Dias, J. Ferreira; Guia, Fernanda; Filipe, J. Cruz ; Guerreiro, Vivelina (2002): “European markets integration : the case of the Norway-Portugal cod value chain”- paper presented at the XIV EAFE Conference 25-27 March 2002.
[30] Montanari, Massimo (1994): “The culture of food”, Blackwell Oxford UK & Cambridge USA.
[31] Howe, N., Strauss, W. (2009): “ Millennials Rising: The Next Great Generation”. Knopf Doubleday Publishing Group
[32] Nogueira, Sandra (2005): “A criação Tradicional de porcos em Portugal: análise antropológica de regras sociais, tabus e comportamentos”- In: Mneme – Revista de Humanidades, Cultura, Tradição e Património Imaterial”. Vol. 7. Nr.18
[33] Quental, Antero (1871): “Causas da decadência dos povos peninsulares”- 6th edition. Ulmeiro. [34] Rosas, Fernando (1994): “Salazarismo e o fomento económico” – Biblioteca histórica. [35] Rozin, Paul (1998): “Towards a Psychology of Food Choice”- Institute Danone. [36] Schäffer, B. (2015): “A legifjabb titánok”. Hungary: Book Kiadó
[37] Simoons, Frederick J. (1994): “Eat not this flesh- food avoidance from prehistory to the present”- the University of Wisconsin press.
[38] Tari, A. (2010): “Y generáció. Budapest” Jaffa Kiadó
[39] Toussaint-Samat, Maguelonne (1992): “A History of food”- Blackwell [40] Woodman, D (2015): “Youth and Generation”. Sage Publications Ltd. London. [41] www.cocacola.pt/CokeFood/Video.aspx
[42] http://tsf.sapo.pt/Programas/programa.aspx?content_id=917979&audio_id=1068883 - TSF- Rádio Noticias. “Peixinhos da Lata” Reportagem de Rute Fonseca com sonoplastia de Joaquim Dias. 06 JUL 09