1 Transportation Research Record: Journal of the Transportation Research Board, No. 2432, Transportation Research Board of the National Academies, Washington, D.C., 2014, pp. 1–9.
DOI: 10.3141/2432-01
The surrogate safety assessment model (SSAM) is a software applica-tion that reads trajectory files generated by microscopic simulaapplica-tion programs and calculates surrogate measures of safety. This approach eliminates the subjectivity associated with the conventional conflict analysis technique and allows assessment of the safety of a facility under a controlled environment before accidents occur. The specific goal of this research was to validate SSAM as a tool for accident predic-tion at urban intersecpredic-tions. Two methods were used for validapredic-tion. The first method compared the simulated number of conflicts from the use of SSAM and the predicted number of injury accidents from analytic models in three reference intersection layouts (four-leg priority inter-section, four-leg staggered interinter-section, and single-lane roundabout). The second method compared SSAM results with conflicts observed on site in four real intersections: two priority ones and two round-abouts. The results indicate that, despite some limitations related to the nature of current traffic microsimulation models, SSAM analysis is an extremely promising approach to assessing the safety of new facilities or innovative layouts.
In urban areas, traffic accidents are usually concentrated at inter-sections. Traditional approaches to estimating the potential risk of traffic accidents at intersections, which are based on historical crash data, include before-and-after analyses and accident predic-tion models. Both approaches have important limitapredic-tions related to the complexity of safety factors and the poor quality of data, thus (a) compared with other traffic events, accidents are quite exceptional in that they result from a series of unhappy improbable actions and situations; (b) accidents are rare events, so it is troublesome to base traffic safety analyses at individual sites on accidents alone; (c) not all accidents are reported, and the level of underreporting depends on the accident’s severity and types of road users involved; and (d) informa-tion on the circumstances preceding an accident is seldom available (1). In addition, the fact that accidents must occur before one can determine the risk of locations is, from an ethical point of view, a dis advantage (2). Therefore, specific evaluation techniques are
required to take into account changes in traffic regulations or in the geometrical design of infrastructure so as to estimate the true effects of safety improvements. Moreover, regression models may not be transferable because they implicitly reflect road users’ behavior, the vehicle fleet, and driving rules, which vary from country to country and even from site to site.
The traffic conflict technique is an approach that overcomes the lack of good, reliable accident records, relying instead on observa-tions of conflicts. A “conflict” is defined as a situation in which two or more road users approach each other in time and space such that they risk colliding if their movements remain unchanged (3). The necessary evasive action is usually braking but may also be swerv-ing or acceleration, or a combination of those maneuvers. In other words, conflicts are events that would result in an accident if one of the drivers was not able to make an evasive maneuver in due time because both vehicles were on course to occupy the same space simultaneously. Conflicts are far more frequent than accidents, and they are observable in real time at a site, allowing safety assessments without the occurrence of accidents. While interest in the conflict technique has been considerable, its practical use has been limited because of questions of subjectivity and the costs associated with the human registration process (4). Automatic tracing of trajecto-ries from video recordings is a recent and promising technology that addresses these questions (5, 6), but the problem of predicting the safety benefit of a new geometry or circulation scheme remains. Some functions linking simulated conflicts and crash predictions were obtained (7–9), but the connection between surrogates and crashes is still relatively unknown.
Microscopic simulation models are seen as promising tools to evaluate road safety levels of existing and new infrastructures. The core of this new approach is the software developed by the FHWA [surrogate safety assessment model (SSAM)] that automates con-flict analysis by processing the vehicle trajectories produced during the simulation (vehicle’s position, speed, and acceleration profiles). This approach has all the generic advantages of simulation (pos-sibility of assessing the safety of new facilities before the accidents occur, controlled environment, etc.) but also some limitations: com-mon microscopic simulation models are developed for traffic-flow analyses and lack some operational submodels that are essential for safety analyses. Some authors have proposed specific procedures to calibrate simulation models for safety assessment, but this idea is still a field of ongoing research (10, 11).
Practical experience with SSAM is limited, and the results are not consensual. Gettman et al. found a significant correlation between simulated conflicts and crashes reported at 83 four-leg signalized intersections (6). Kim and Sul tested the effect of changing the
Validation of the Surrogate Safety
Assessment Model for Assessment
of Intersection Safety
Luís Vasconcelos, Luís Neto, Álvaro Maia Seco, and Ana Bastos Silva
L. Vasconcelos, Department of Civil Engineering, Polytechnic Institute of Viseu, Campus Politécnico de Repeses, 3504-510 Viseu, Portugal. L. Neto, Á. M. Seco, and A. B. Silva, Department of Civil Engineering, University of Coimbra, Rua Luís Reis Santos, Pólo II, 3030-788 Coimbra, Portugal. Corresponding author: L. Vasconcelos, vasconcelos@estv.ipv.pt.
cluded that VISSIM microsimulation represents speeds and flows well but is insufficiently detailed in relation to safety analysis (12). Dijkstra et al. modeled a 300-km2 road network in Paramics and con-cluded that a significant relationship existed between the observed crashes and the simulated conflicts (13). Huang et al. compared observed and simulated conflicts at 10 signalized intersections in the Nanjing area of China (14). Their results show a reasonable goodness of fit between simulated and recorded rear-end conflicts, but they also found that the simulated conflicts are not good indica-tors of traffic conflicts generated by unexpected driving maneuvers, such as illegal lane changes.
The specific goal of the current research is to validate SSAM as a tool for accident prediction in urban intersections. Two methods are used: the first compares the simulated number of conflicts from using SSAM and the predicted number of accidents from using ana-lytic models in three fictitious intersections—one four-leg priority intersection, one four-leg staggered intersection, and one single-lane roundabout—with simple geometry and idealized traffic demand distributions; the second method compares the observed conflicts in four selected intersections and the simulated conflicts from using SSAM, emulating (as much as possible) the real conditions observed at those locations.
SSAM ApproAch
SSAM operates by (a) processing data that describe the trajectories of vehicles driving through a traffic facility and (b) then identifying conflicts. For each vehicle-to-vehicle interaction, SSAM calculates surrogate measures of safety and determines whether that interaction satisfies the criteria to be deemed a conflict. In the present analysis, the research team used time to collision (TTC) as a threshold to estab-lish whether a given vehicle interaction is a conflict and the relative speed (DeltaS) as a proxy for accident severity. Their definitions are as follows (6):
• “TTC” is the minimum time value observed during the inter-action of two vehicles on collision course. If at any time step the TTC drops below a given threshold [1.5 s in this work, as suggested for urban areas (15)], the interaction is tagged a conflict.
• “DeltaS” is the difference in vehicle speeds observed at the instant of the minimum TTC. More precisely, this value is mathemat-ically defined as the norm of the velocity vector of each vehicle and thus accounts for the differences in the vehicles’ absolute speeds and headings. For example, if the speeds of two vehicles at the instant of minimum TTC were 50 km/h and 30 km/h, then DeltaS would be 20 km/h if they were traveling in the same direction (rear-end accident), 80 km/h if they were driving in opposite directions, and 58.3 km/h if they were they were traveling perpendicular to each other (law of cosines).
Aimsun was the simulator used in this work (16). With the excep-tion of the parameters that control the drivers’ desired speeds on links, most parameters kept their default values and a single vehicle type (car) was considered. To increase the accuracy of the surro-gate measures (and specifically, for each vehicle conflict, the value of the minimum TTC and the vehicles’ speeds at that instant) the simulation step was set to 0.25 s and drivers’ reaction time was set to 0.75 s. Further details about alternative surrogate measures can be found elsewhere (1, 17).
evaluation Framework
SSAM would ideally be validated against accident records. However, as accidents are quite rare, obtaining sufficient data from a single site under controlled external variables, such as weather or traffic condi-tions, to define a reference scenario would be extremely difficult. As an alternative, conventional accident prediction models (APMs) were taken as references. These models are usually based on a large number of accident records and rely on advanced statistical techniques to iden-tify the significant variables and calibrate the respective coefficients. A simple evaluation framework was designed to assess the perfor-mance of SSAM; it consists of comparing the SSAM outputs against accident estimates from the APMs for a set of layouts under the same traffic demand (Figure 1). It starts with a four-leg yield-controlled inter section with a typical traffic demand: 70% traffic in the major east–west direction, 30% in the minor (north–south); at each entry, 30% turn right, 50% move through, and 20% turn left (Figure 1a). The authors were interested in seeing whether the safety models could replicate the safety improvements arising from a left–right staggering [reconfiguration of crossroads as two T-intersections (Figure 1c)] and with the conversion to a single-lane roundabout (Figure 1b).
The three layouts have standard geometric characteristics for urban conditions. The four-leg intersection has left-turn lanes in the major direction and short right-turn lanes from the minor direction. A con-ventional single-lane roundabout with four legs was also considered, designed according to the Portuguese roundabout design guidelines (18). It has the following main geometric characteristics: inscribed circle diameter (ICD), 40 m; carriageway width (between lane mark-ings), 6.5 m; approach lane width, 3.5 m; entry width, 4.5 m; and entry radius, 30 m. The roundabout is symmetrical in both the north– south and east–west directions. A 50-km/h speed limit was assumed for all layouts.
These layouts were chosen because, first, several APMs (pre-sented in the next section) are directly applicable, and, second, their effects on safety are well documented through a large number of studies. With respect to the staggering, Elvik et al. observed that inter sections with four approaches (32 conflict points) make greater demands on road user alertness and behavior than intersections with three approaches (nine conflict points) (19). The effects of stag-gered intersections depend on the proportion of minor road traffic at the crossroads before staggering and on the staggering side. For the conditions presented in Figure 1c (left–right staggering, heavy minor-road traffic), one can expect a 33% reduction in injury accidents and a 10% reduction in property damage accidents (19). Converting a crossroad to a single-lane roundabout is also a well-recognized way to improve safety. Several factors contribute to this improve-ment: (a) the number of conflict points is reduced from 32 to 20; (b) all drivers must give way to circulating traffic and are thus forced to watch traffic at the roundabout more carefully; (c) all traffic comes from one direction, which facilitates finding a suitable gap to enter the roundabout; and (d) roundabouts make users drive around a circular traffic island in the middle of the intersection. These factors reduce the entry and circulating speeds and the potential impact angle. A metaanalysis of several studies indicates that the number of severe accidents is significantly lower at roundabouts (46% reduction for injury accidents) but property damage accidents increase (+10%) (19). A recent before-and-after study in Denmark reports decreases of 47% for injury and 16% for property-damage-only accidents (20).
For simulation purposes, the daily traffic demand was split into 24 origin–destination matrices on the basis of a typical distribution throughout 1 day. Traffic demand assumed only cars.
description of ApMs
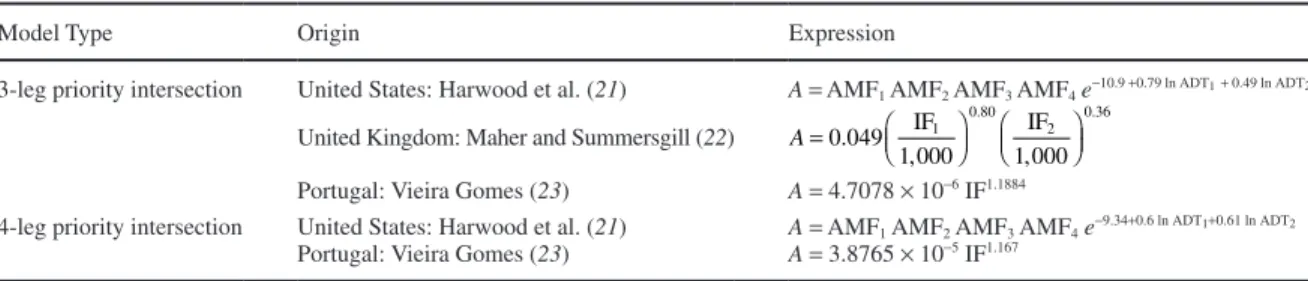
At least two models were used for each layout analyzed. The acci-dents in the priority intersections [three-leg and four-leg (Table 1)] were estimated by using models developed in the United States (21), United Kingdom (22), and Portugal (23). Each of these models gives the predicted number of intersection-related injury accidents per year, excluding those involving pedestrians. The data samples vary considerably between studies: the U.S. models are based on a sample of 324 four-leg stop-controlled intersections and 382
three-leg stop-controlled intersections in Minnesota and include 5 years (1985 to 1989) of accident data for each intersection. The UK model is based on data for 3,800 km of highway in the United Kingdom, including more than 5,000 minor intersections. The Portuguese data set includes 44 locations for the three-leg intersections and 50 locations for four-leg intersections located in Lisbon, Portugal.
The accidents in the roundabout were estimated by using models developed in the United Kingdom (24), Australia (25) and Portugal (23) (Table 2). The British model is based on accidents that occurred over a 6-year period at 84 roundabouts in the United Kingdom. Some FIGURE 1 Conceptual validation–geometric layouts: (a) four-leg priority intersection, (b) single-lane roundabout, and (c) four-leg staggered intersection (modeled as two three-leg intersections) (N 5 north; E 5 east; S 5 south; W 5 west).
4.5% 7.5% 3% 15% 28% 7% 35% 10.5% 31% 20.5% 4.5% 7.5% 3% 15% 28% 7% 35% 10.5% 31% 20.5% W N S E (c) 17.5% 35% 10.5% 4.5% 7.5% 3% 15% 4.5% 7.5% 3% 15% 17.5% 7% 35% 10.5% 7% W S E N (a) 17.5% 7% 35% 10.5% 4.5% 7.5% 3% 15% 4.5% 7.5% 3% 15% 17.5% 7% 35% 10.5% W E N S (b)
of the submodels obtained are excluded because they refer to causes that are beyond the scope of the SSAM methodology [namely Sub-model A3 (single-vehicle accidents) and Submodel A5 (accidents involving a pedestrian casualty)]. Arndt analyzed 100 Queensland, Australia, roundabouts, where 492 major accidents were recorded, generally over a 5-year analysis period (26). The main objective of that study was to determine the effect of roundabout geometry on accident rates. Models were developed for single-vehicle accidents, approaching rear-end accidents, and entering–circulating vehicle accidents. For the reasons stated earlier, the first type was excluded from the current analysis. Vieira Gomes, using data from 15 round-abouts in Lisbon, developed models to estimate the frequency of accidents with injuries on urban road networks (23).
results of conceptual Validation
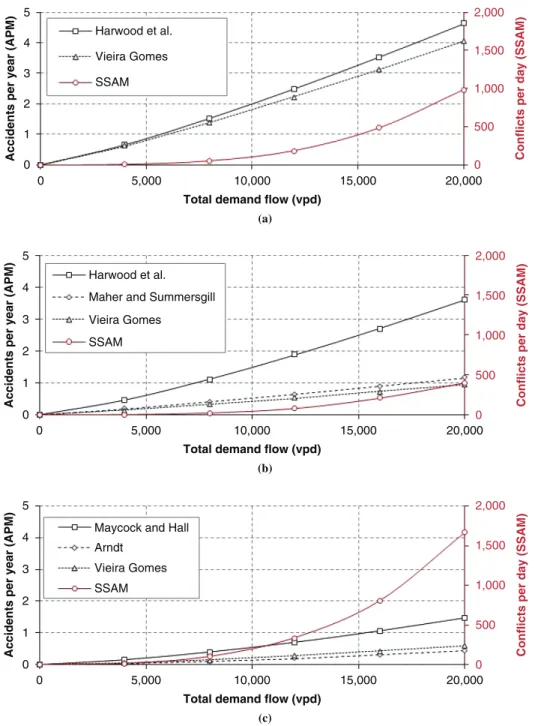
The purpose of this first test was to compare the SSAM and APM results for uniform traffic growth, when the total annual average daily traffic (AADT) (entering traffic) varied from 0 to 20,000 vehicles per day (vpd) in the three layouts.
Figure 2 shows the results for both the simulated conflicts and predicted accidents in all three types of intersections. One can infer that, although they relate to different countries and are based on dif-ferent assumptions, the regression models still provide consistent estimates. The SSAM conflict–flow points are almost perfectly fitted by a convex curve and are similar to the accident–flow curves from the regression models, although with a more pronounced curvature; this fit suggests a good correlation between simulation conflicts and actual accidents.
All APMs predict a reduction in the number of injury accidents with the staggering of the four-leg intersection and a further reduc-tion following the conversion to a roundabout, which agrees with expectations and with international experience. The SSAM method predicts a reduction in the number of conflicts in the staggered inter-section (sum of the two T-interinter-sections), as expected, but it also predicts an increase in the roundabout. To assess the severity level of the simulated conflicts, the average speed differential (DeltaS) was calculated for each intersection, and the following values were obtained: four-leg intersection, 6.46 m/s; staggered intersections, 6.19 m/s; and roundabout, 4.40 m/s. SSAM predicts a large number of low-severity conflicts at roundabouts. This prediction agrees with
Model Type Origin Expression
3-leg priority intersection United States: Harwood et al. (21) A= AMF1 AMF2 AMF3 AMF4 e−10.9 +0.79 ln ADT1+ 0.49 ln ADT2
United Kingdom: Maher and Summersgill (22) 0.049 IF 1,000
IF 1,000
1 0.80 2 0.36
A=
Portugal: Vieira Gomes (23) A = 4.7078 × 10⁻⁶ IF1.1884
4-leg priority intersection United States: Harwood et al. (21) A = AMF1 AMF2 AMF3 AMF4 e−9.34+0.6 ln ADT1+0.61 ln ADT2
Portugal: Vieira Gomes (23) A= 3.8765 × 10⁻⁵ IF1.167
Note: A = predicted number of total intersection-related accidents per year; AMF1 = accident modification factor for a left-turn lane on major road (0.78 for one major-road approach, 0.58 for both major-road approaches); AMF2 = accident modification factor for a right-turn lane (0.95 for a right-turn lane on one major-road approach, 0.90 for right-turn lanes on both major-road approaches); AMF3 = accident modification factor for sight restrictions; AMF4 = accident modification factor for the conversion from minor road to all-way stop control; ADT1 = annual average daily traffic on the major road; ADT2 = annual average daily traffic on the minor road; IF, IF1, and IF2 = total inflow in the intersection, major direction, and minor direction, respectively [vehicles per day (vpd), annual average].
TABLE 2 Accident Prediction Models for Roundabouts
Origin Conflict Type Expression
United Kingdom: Maycock and Hall (24) Entering–circulating A1= 0.052Q0.7eQc0.4 exp C e ev
R P e m 40 0.14 0.007 1 1 exp 4( 7) 0.2 0.01 − + − − + − + − θ
Approach A2= 0.0057Q1.7e exp (20Ce− 0.1e)
Other A4 = 0.0026Q0.8e Qc0.8 exp (0.2 Pm)
Australia: Arndt (25) Rear end Ar = 9.62 × 10⁻¹¹ Qa Qc0.5 S2
Entering–circulating Ac= 3.45 × 10⁻¹² Qa∑(Qci0.5 S2i)
Portugal: Vieira Gomes (23) All A = 2.3845 × 10⁻⁸ FT1.5084 e0.5248 LEG
Note: United Kingdom: Ai = personal injury accidents (including fatalities) per year per roundabout approach [A1 = entering-circulating accidents, A2 = approaching accidents (mostly rear-end accidents, but also changing lane accidents), A4 = other accidents (variety of nonpedestrian accidents)]; Qe and Qc = entering and circulating
flow, respectively (1000s of vehicles per day); Ce = entry curvature [Ce = 1/Re and Re = entry path radius for the shortest vehicle path (m)]; e = entry width (m);
v = approach width (m); R = radius of the inscribed circle diameter; Pm = proportion of motorcycles (%); θ = angle to next leg measured centerline to centerline
(degrees). Australia: Ar/Ac = rear-end and entering–circulating accidents per year, respectively (over $1,000 property damage or personal injury or both); Qa = average
annual daily traffic (AADT) on the approach [i.e., one-way traffic only (vpd)]; Qci = various AADT flows on the circulating carriageway adjacent to the approach
[i.e., one-way traffic only (vpd)]; Si = various relative 85th percentile speed between vehicles on the approach curve and vehicles on the circulating carriageway
from each direction (km/h). Portugal: A = estimated number of accidents with injuries per year in the roundabout; FT = total entering traffic flow [vpd (AADT)]; LEG = number of legs of the roundabout.
the above-mentioned typical significant reduction in injury accidents at roundabouts and the associated an increase in minor accidents.
The graphs in Figure 2 show that the relation between conflicts and accidents is not linear, as it varies with entry flow, intersection type, and the particular APM. Nevertheless, one may obtain some approximate yet useful figures to narrow the uncertainty in this research area. For example, for entry flow of 12,000 vpd, one can expect to find a conflict–accident ratio, which varies with the APM, of from 25,000:1 to 30,000:1 in a four-leg inter section, from 15,000:1 to 60,000:1 in a staggered four-leg intersection, and from 180,000:1 to 500,000:1 in a roundabout. These ratios increase with demand
flow, as expected, because of the increasing difficulty of maintaining high speeds, which leads to a lower probability of a conflict resulting in an injury accident.
Field Validation
The objective of this section was to understand the ways that conflicts predicted by the Aimsun–SSAM approach correlate with real con-flicts observed in urban intersections. Four intersections were selected within the city of Coimbra, Portugal: one three-leg stop-controlled
Conflicts per day (SSAM)
0 500 1,000 1,500 2,000 0 0 5,000 10,000
Total demand flow (vpd)
15,000 20,000
1 2
Accidents per year (APM)
3
4 Harwood et al.
Vieira Gomes SSAM 5
Conflicts per day (SSAM)
0 500 1,000 1,500 2,000 0 0 5,000 10,000
Total demand flow (vpd)
15,000 20,000
1 2
Accidents per year (APM)
3
4 Harwood et al.
Maher and Summersgill Vieira Gomes SSAM 5 (a) (b) (c)
Conflicts per day (SSAM)
0 500 1,000 1,500 2,000 0 0 5,000 10,000
Total demand flow (vpd)
15,000 20,000
1 2
Accidents per year (APM)
3
4 Maycock and Hall
Arndt Vieira Gomes SSAM 5
FIGURE 2 Accident–flow relationships from analytic regression models and conflict–flow relationship from SSAM technique for (a) four-leg intersection, (b) staggered intersection, and (c) roundabout.
single-lane roundabout, and one five-leg two-lane roundabout. The main geometric and traffic characteristics of these intersections are presented in the next section.
observation of conflicts
The conflict observation followed the guidelines presented in the FHWA’s traffic conflict observer’s manual (27), with minor adjust-ments aimed at comparability with the simulation outputs. Therefore, only vehicle–vehicle interactions were considered. Pedestrians were not regarded as road users but could be a cause of a conflict, particu-larly for rear-end conflicts between two vehicles forced to stop for a pedestrian in a crosswalk. The severity of conflicts was not assessed; that is, no limit was set on time to collision or postencroachment time for a conflict to be registered. Therefore, observers were expected to register a conflict every time road users with the right of way were forced to modify their behavior, either by braking or swerving.
Each observer was responsible for a certain direction of vehicles with the right of way (e.g., one observer would register conflicts involving only northbound vehicles in the major road while the other was responsible for southbound vehicles). This meant that conflicts in minor roads and after the intersection (from each observer’s point of view) were ignored. In roundabouts, each observer was responsi-ble for a quarter of the circulatory carriageway. Rear-end conflicts in the approaches were disregarded. Because of the methodology used to observe conflicts on site and for proper comparison of the number of observed and simulated conflicts, only the conflicts that took place in the intersection itself or in the major road immediately before the intersection were considered. In the case of roundabouts, only the conflicts that took place in the circulatory carriageway were counted.
During a trial period, this method was tested to ensure that all observers understood the requirements, so that the results were as similar as possible. At least one of the authors was permanently in the field accompanying the sessions and helping observers to decide on the less clear cases.
The observations were taken for 9 h per location, each on a dif-ferent day, divided into three periods: the morning, from 7:30 to 10:30 a.m.; early afternoon, from noon to 3:00 p.m.; and late after-noon, from 4:00 to 7:00 p.m. These periods covered different traf-fic demand levels and directional splits. The total workload was 108 person-hours.
development of Microscopic Models
Other observers were responsible for collecting the data required for the microsimulation modeling: traffic volumes per move-ment, pedestrian movements in crosswalks, bus stop frequency (if needed), and vehicle approach speeds using a laser gun (lidar). The parameters that control the speed of vehicles under free-flow condi-tions (desired speeds and levels of compliance with speed limits) were adjusted in the model to correspond to field measurements.
Pedestrians are traditionally simulated in Aimsun by using an embedded pedestrian simulator engine (a plug-in provided by Legion, a company specializing in pedestrian simulation). Unfor-tunately, SSAM is unable to assess pedestrian–pedestrian and vehicle–pedestrian interactions, so the authors chose to emulate pedestrian crossing events with Aimsun’s feature for periodic sec-tion incidents, which allows a specified segment of a road (the crosswalk) to be blocked to vehicles during short time intervals, with a duration and frequency typical of the observed crossings.
car-following and gap-acceptance behavior were not changed. A comprehensive calibration was not deemed necessary, as the main objective of this analysis was to compare alternative layouts; there-fore, the absolute values are not of significant importance. Further-more, keeping default values facilitates future comparisons with similar studies.
locations
Three-Leg Intersection
The chosen three-leg intersection is located on an arterial road within an urban environment. The main street is north–south oriented and has an estimated total entering AADT of 14,483 vehicles, with evenly balanced flows for most of the day but mainly northbound in the morning peak hour. The street is approximately 7 m wide and has one lane each way. No left-turn lane is provided on the major road. The minor street approaches the main one from the west and has a considerable entering AADT of 8,245 vehicles, with most of the movements being northbound. The street is approximately 12 m wide and has one lane for westbound traffic and two lanes for east-bound traffic, features that allow segregated right and left turns. In addition, a one-way street approaches the main road from the east, just a few meters south of the intersection; this street was disregarded because of its low traffic volume. Furthermore, one bus stop is situ-ated on each side of the major street, approximately 60 m north of the intersection, and these are extremely significant factors for the traffic flow, both southbound and northbound, because the street has no bus bays and the buses have to stop in the main road. Other constraints are a couple of crosswalks immediately west and south of the inter-section. Both have residual pedestrian traffic crossing every other 10 or 15 min. The average free-flow speed for cars approaching the intersection was 46.0 km/h, with a standard deviation of 5.4 km/h. Four-Leg Intersection
The chosen four-leg intersection is located in the heart of a resi-dential district, where most of the neighborhood’s commerce can be found. The main street is north–south oriented and has an esti-mated entering AADT of 5,135 vehicles, mainly northbound, par-ticularly in the morning peak hour. The street is approximately 9 m wide, with one lane each way, and parallel parking is allowed in both directions. The minor street is east–west oriented and has an estimated entering AADT of 1,924 vehicles. The street is approxi-mately 8 m wide, with one lane each way, and allows parallel park-ing for the eastbound vehicles on the eastern approach and diagonal parking for both ways on the western approach. Perpendicular park-ing is allowed within the intersection in the northeast and south-east corners, a factor that was ignored during the traffic conflict observations because of the great difficulty of emulating it in the micro simulation software. All four approaches include crosswalks. Because the area is residential, pedestrian traffic is a significant factor. Therefore, the authors registered pedestrian crossing frequency for each crosswalk. The average free-flow speed for cars approaching the intersection was 39.6 km/h, with a standard deviation of 4.9 km/h. One-Lane Roundabout
The chosen roundabout is located in one of the most densely popu-lated areas of the city. This node connects three arterial streets and
one local street. The roundabout has a diameter of 36 m and a circu-latory lane 6 m wide. The total estimated AADT is 22,938 vehicles. All four approaches include crosswalks. Nevertheless, even though the roundabout is located in a central area, pedestrian movement in this intersection is relatively low. Given that, crosswalks here were not considered in the model. The average free-flow speed for cars approaching the roundabout was 46.4 km/h, with a standard deviation of 6.7 km/h.
Two-Lane Roundabout
The chosen two-lane roundabout is located in one of the most densely populated areas of the city. This node connects three important arterial streets and two local streets, one of which is a one-way street toward the intersection. This intersection is within Coimbra’s ring road, and heavy vehicle traffic is considerable. From a partial observation, the authors assumed that heavy vehicles represented
5% of the total traffic. The total estimated AADT is 33,625 vehicles, all four approaches include crosswalks; however, for the reasons mentioned earlier, crosswalks here were not considered in the model. The average free-flow speed for cars approaching the roundabout was 60.0 km/h, with a standard deviation of 7.8 km/h.
results of Field Validation
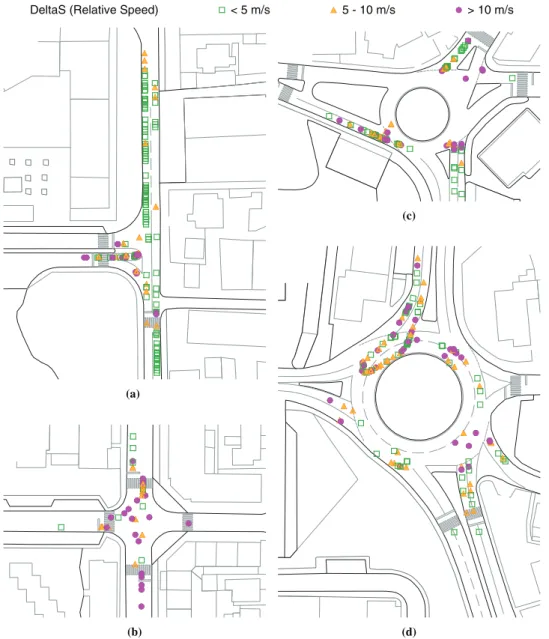
The SSAM analysis produced the results illustrated in Figure 3 for the early afternoon period. The graphical display of conflicts agrees reasonably with observations: (a) most approach legs have low-severity rear-end conflicts. These occur at peak periods when, for several reasons, priority drivers reduce speed and delay upstream vehicles; (b) at the four-leg intersection, the model predicts a high percentage of severe conflicts, which actually occur and are related to perpendicular trajectories and to sudden stops in response to pedestrians at crosswalks; and (c) at the roundabouts, the model
DeltaS (Relative Speed) < 5 m/s 5 - 10 m/s > 10 m/s
(a)
(b)
(c)
(d)
FIGURE 3 SSAM results (early afternoon period) with graphical display of conflicts, colored by relative speed (proxy for accident severity), for (a) three-leg intersection, (b) four-leg intersection, (c) single-lane roundabout, and (d) two-lane roundabout.
predicts entering–circulating and weaving conflicts where they actually occur.
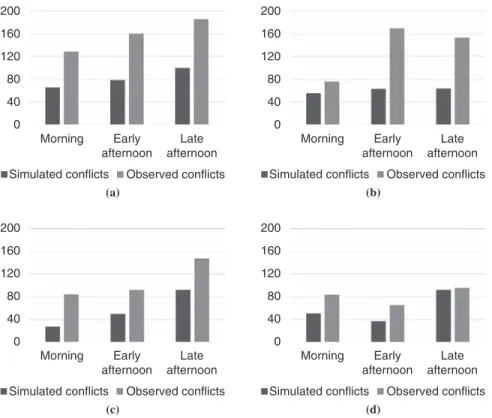
The comparison between observed and simulated conflicts is pre-sented in Figure 4. As noted earlier, only the conflicts that take place in the priority links are registered (major direction links in the priority intersections, circulatory lanes in the roundabouts). SSAM presents a systematic underestimation trend, probably related to the TTC threshold adopted, but in global terms, it is able to replicate the pat-tern of real conflicts in the four intersection types and for the differ-ent demand periods. The least satisfactory results were obtained at the single-lane roundabout and were related to a pedestrian cross-ing in the south leg, not included in the model, that was sometimes responsible for upstream queues that reached the circulatory lane. SuMMAry And concluSionS
Safety assessment based on conventional APMs raises questions about the availability and quality of crash data to serve as a refer-ence for model development, and the study of new layouts or facili-ties operating outside the models’ calibration domain is not feasible. Recently, efforts have been made to expand the use of microscopic simulation models to safety assessment problems. The current study evaluated the potential of the SSAM approach to assess the safety levels at urban intersections. A conceptual validation based on con-ventional APMs showed a strong relation between accidents pre-dicted by the regression models and conflicts prepre-dicted by simulation models. Conflict–accident ratios were found to vary in relation to the intersection type, the entry flow, and the particular APM. For a moderate traffic flow (entering AADT = 12,000 vehicles) that ratio
ranges from about 25,000:1 to 30,000:1 in a four-leg inter section and from 180,000:1 to 500,000:1 on a single-lane roundabout.
A field validation compared simulated and observed conflicts in four types of intersections. Despite a systematic underestimation trend, SSAM was able to replicate the hourly evolution of con-flicts and to identify the hazardous areas of each intersection. The suboptimal results at the single-lane roundabout indicate that this safety approach is quite sensitive to inaccurate modeling. Never-theless, one may conclude that SSAM analysis is a quite promising approach to assessing the safety of new facilities, of innovative lay-outs [e.g., turboroundablay-outs (28)], or of traffic regulation schemes [e.g., limiting the driving degree of freedom on freeways (8)]. AcknowledgMentS
This research was partially funded by FEDER (Programa Operacio-nal Factores de Competitividade–COMPETE) and FCT (Fundação para a Ciência e a Tecnologia) in the scope of Projects AROUND (Improving Capacity and Emission Models of Roundabouts) and EMSURE (Energy and Mobility for Sustainable Regions). reFerenceS
1. Laureshyn, A., Å. Svensson, and C. Hydén. Evaluation of Traffic Safety, Based on Micro-Level Behavioural Data: Theoretical Framework and First Implementation. Accident Analysis and Prevention, Vol. 42, No. 6, 2010, pp. 1637–1646.
2. Güttinger, V. A. Conflict Observation in Theory and in Practice.
Inter-national Calibration Study of Traffic Conflict Techniques, NATO ASI Series Vol. 5, 1984, pp. 17–24. Observed conflicts 0 Morning Early afternoon Late afternoon 40 80 120 160 Simulated conflicts
Simulated conflicts Observed conflicts 0 Morning Early afternoon Late afternoon 40 80 120 160
Simulated conflicts Observed conflicts 0 Morning Early afternoon Late afternoon 40 80 120 160 200 (a) (b) (c) (d)
Simulated conflicts Observed conflicts 0 Morning Early afternoon Late afternoon 40 80 120 160 200
FIGURE 4 Comparison of observed and simulated total conflicts at four sites: (a) three-leg intersection, (b) single-lane roundabout, (c) four-leg intersection, and (d) two-lane roundabout.
3. Amundsen, F., and C. Hyden (eds.). Proc., 1st Workshop on Traffic
Conflicts: Oslo 77. Norwegian Council for Scientific and Industrial Research, Oslo, Norway, 1977.
4. Asmussen, E. Joint International Study for the Calibration of Traffic Conflicts Techniques. International Calibration Study of Traffic Conflict
Techniques, NATO ASI Series Vol. 5, 1984, pp. 1–6.
5. Ardö, H., M. Nilsson, A. Laureshyn, and A. Persson. Enhancements of Traffic Micro Simulation Models Using Video Analysis. Presented at 17th European Conference on Mathematics for Industry, Lund, Sweden, 2012.
6. Gettman, D., L. Pu, T. Sayed, and S. G. Shelby. Surrogate Safety
Assess-ment Model and Validation: Final Report. FHWA-HRT-08-051, FHWA, U.S. Department of Transportation, 2008.
7. Tarko, A. P. Use of Crash Surrogates and Exceedance Statistics to Estimate Road Safety. Accident Analysis and Prevention, Vol. 45, 2012, pp. 230–240.
8. Habtemichael, F. G., and L. de Picado-Santos. The Impact of High-Risk Drivers and Benefits of Limiting Their Driving Degree of Freedom.
Accident Analysis and Prevention, Vol. 60, 2013, pp. 305–315. 9. Al-Ghandour, M. N., B. J. Schroeder, B. M. Williams, and W. J. Rasdorf.
Conflict Models for Single-Lane Roundabout Slip Lanes from Micro-simulation: Development and Validation. In Transportation Research
Record: Journal of the Transportation Research Board, No. 2236,
Transportation Research Board of the National Academies, Washington, D.C., 2011, pp. 92–101.
10. Cunto, F., and F. F. Saccomanno. Calibration and Validation of Simu-lated Vehicle Safety Performance at Signalized Intersections. Accident
Analysis and Prevention, Vol. 40, No. 3, 2008, pp. 1171–1179. 11. Duong, D., F. Saccomanno, and B. Hellinga. Calibration of
Micro-scopic Traffic Model for Simulating Safety Performance. Presented at 89th Annual Meeting of the Transportation Research Board, Washington, D.C., 2010.
12. Kim, K.-J., and J. Sul. Development of Intersection Traffic Accident Risk Assessment Model. Presented at 4th IRTAD Conference, Seoul, South Korea, 2009.
13. Dijkstra, A., P. Marchesini, F. Bijleveld, V. Kars, H. Drolenga, and M. van Maarseveen. Do Calculated Conflicts in Microsimulation Model Predict Number of Crashes? In Transportation Research Record:
Jour-nal of the Transportation Research Board, No. 2147, Transportation Research Board of the National Academies, Washington, D.C., 2010, pp. 105–112.
14. Huang, F., P. Liu, H. Yu, and W. Wang. Identifying if VISSIM Simula-tion Model and SSAM Provide Reasonable Estimates for Field Mea-sured Traffic Conflicts at Signalized Intersections. Accident Analysis
and Prevention, Vol. 50, 2013, pp. 1014–1024.
15. Svensson, A. A Method for Analysing the Traffic Process in a Safety
Perspective. Lund Institute of Technology, Lund, Sweden, 1998. 16. Aimsun Version 7 User’s Manual. Transport Simulation Systems,
Barcelona, Spain, 2012.
17. Gettman, D., and L. Head. Surrogate Safety Measures from Traf-fic Simulation Models. In Transportation Research Record:
Jour-nal of the Transportation Research Board, No. 1840, Transportation Research Board of the National Academies, Washington, D.C., 2003, pp. 104–115.
18. Bastos Silva, A., and Á. J. M. Seco. Dimensionamento de Rotundas—
Documento Síntese. Instituto de Infraestruturas Rodoviárias, Lisbon, Portugal, 2012.
19. Elvik, R., A. Høye, T. Vaa, and M. Sørenson. Handbook of Road Safety
Measures, 2nd ed. Emerald Group Publishing, Bradford, United King-dom, 2009.
20. Jensen, S. U. Safety Effects of Converting Intersections to Round-abouts. In Transportation Research Record: Journal of the
Transporta-tion Research Board, No. 2389, Transportation Research Board of the National Academies, Washington, D.C., 2013, pp. 22–29.
21. Harwood, D. W., F. Council, E. Hauer, W. Hughes, and A. Vogt.
Predic-tion of the Expected Safety Performance of Rural Two-Lane Highways.
FHWA-RD-99-207, FHWA, U.S. Department of Transportation, 2000. 22. Maher, M. J., and I. Summersgill. A Comprehensive Methodology for the
Fitting of Predictive Accident Models. Accident Analysis and Prevention, Vol. 28, No. 3, 1996, pp. 281–296.
23. Vieira Gomes, S. The Influence of the Infrastructure Characteristics in Urban Road Accidents Occurrence. Procedia—Social and Behavioral
Sciences, Vol. 48, 2012, pp. 1611–1621.
24. Maycock, G., and R. Hall. Accidents at 4-Arm Roundabouts. Transport Research Laboratory, Wokingham, United Kingdom, 1984.
25. Arndt, O. Relationship Between Roundabout Geometry and Accident
Rates, Final Report. Publication ETD02. Transport Technology Division, Department of Main Roads, Brisbane, Australia, 1998.
26. Arndt, O. Relationship Between Unsignalised Intersection Geometry and Accident Rates: A Literature Review. Road and Transport Research, Vol. 10, No. 3, 2001, pp. 49–65.
27. Parker, M., Jr., and C. V. Zegeer. Traffic Conflict Techniques for Safety
and Operations. Observer’s Manual. FHWA-IP-88-027. FHWA, U.S. Department of Transportation, 1989.
28. Vasconcelos, L., A. B. Silva, Á. M. Seco, P. Fernandes, and M. C. Coelho. Turboroundabouts: Multicriterion Assessment on Intersection Capacity, Safety, and Emissions. In Transportation Research Record: Journal of
the Transportation Research Board, No. 2402, Transportation Research Board of the National Academies, Washington, D.C., 2014, pp. 28–37.