E-Lisbon: an e-grocery service
marketing project for Lisbon area
Mihai OPREA
Master dissertation
Advisor at FEUP: Prof. Dr. Lia Raquel Neto Martins Lima Patrício Advisor at UPB: Prof. Dr. Monica Dragoicea
Advisor at SONAE: Dr. Pedro Miguel Azevedo Pinto
Faculda de de Engenharia da Universidade do Porto
I dedicate this work to my family that always supported me, to my lovely girlfriend who was always besides me and carrying about my work, and to all my coordinators and advisers especially to Pedro Pinto in SONAE.
E-Lisbon an e-grocery marketing project for Lisbon area
Abstract
E-commerce is becoming a more and more important trading process, that had a rapidly growth in the past years and will continue to grow with up to 20.1% in 2014 according to eMarketer’s forecasts. With the continuous evolution of e-commerce a number of challenges arise, forcing the companies to offer better and better services and create new strategies in order to attract more customers. This paper describes the actual state of the e-commerce; the marketing segmentation strategies and the design of new services using specialized techniques.
Using proposed segments and a proposed segmentation model, the best freguesias in Lisbon, suitable for e-commerce service, will be indentified. This will be done by analyzing their social-demographic characteristics, using sales data about offline and online stores and also by analyzing the market from different points of view.
In order to drive business results like sales, share-of-wallet increase and new customer acquisition, an action plan is proposed with that include different value propositions implemented for the defined segments, showing their estimated impact.
As a new value proposition, a new service is created and design that will improve the existing service by offering a different, more economical alternative and will provide to the customers an easier access to the online grocery.
Special thanks
I would like to thank to my advisers in FEUP prof. dr. Lia Patrício and prof. dr. João Falcão e Cunha, my advisers in UPB, prof. dr. Theodor Borangiu and prof. dr. Monica Dragoicea that provided me support and guidance to accomplish this project.
Many thank too all my colleagues in FEUP in the MESG program, which shared their knowledge and provided help and especially to Thiago Sobral.
I will also like to thank to my colleagues in Continente Online that were always willing to help and provide information, especially to my coordinator, Pedro Pinto who always offered me support. I am thankful to SONAE for being received and offered the opportunity to develop the project in a business environment.
Last but not least I would like to all the persons involved in creating the MESG-SEM agreement, and having the chance to study in two important Universities with great professors and students.
Index of contents
1 Introduction and project presentation ... 1
1.1 Company presentation - SONAE ... 1
1.2 E-Lisbon project in Continente Online ... 2
1.3 Thesis Project objectives... 2
1.4 Followed methods in the project ... 3
1.5 Project structure and organization ... 3
2 Contextualization and state of the art ... 4
2.1 E-commerce/E-grocery – self-service technology ... 4
2.2 Market segmentation ... 6 2.2.1 Market segmentation ... 6 2.2.2 Geographic segmentation ... 8 2.2.3 Social-Demographic segmentation ... 8 2.2.4 Regional approach ... 9 2.2.5 Marketing communication ... 9 2.3 Service design ... 10
3 Problem description and methodology ... 13
3.1 Problem description and methodology ... 13
3.2 Identifying the variables of interest from the data available ... 16
3.3 Data collection ... 19
3.4 Data integration ... 19
3.5 Data analysis ... 20
4 Segmenting the Lisbon market and proposing a targeting strategy ... 22
4.1 Data analysis and categorization ... 22
4.1.1 Online vs. offline ... 22
4.1.2 Variables importance ... 24
4.1.3 Building the model ... 25
4.2 Residential segment ... 27
4.3 Transportation hubs ... 30
4.4 Corporate segment ... 33
4.5 Special targets ... 35
5 New pick-up point service description ... 36
5.1 Service description ... 36
5.2 Flower of service ... 37
5.3 Story boarding – example of the service – (map with available pick-up points) ... 38
5.4 Multi-level service design - blueprinting ... 39
6 Conclusions and further developments ... 42
References ... 43
APPENDIX A: Targeted freguesias ... 45
APPENDIX B: Storyboarding ... 47
APPENDIX C: Service Experience Blueprint - Ordering ... 48
List of figures
Figure 1 - First e-commerce interface ... 4
Figure 2 – Multilevel Service Design model (Patrício et al 2011) ... 11
Figure 3 – Continente market share ... 13
Figure 4 – Continente Online stores location ... 14
Figure 5 – Targeted zone in Great Lisbon ... 15
Figure 6 – Value segments ... 18
Figure 7 – Movements analysis ... 21
Figure 8– Age group comparison COL and global Continente ... 22
Figure 9 – Education level for the online clients ... 23
Figure 10 – Difference in value segments, online compared to offline ... 23
Figure 11 – Transport cost in relation with population density ... 25
Figure 12 – Social-demographic fit and potential matrix ... 26
Figure 13 – Distribution of freguesias social-demographic fit – potential/km2 matrix ... 26
Figure 14 – Matrix for value segments in COF in COL ... 28
Figure 15 – Universidade parking lot ... 31
Figure 16 – Alvaro Pais parking lot ... 32
Figure 17 – Galp gas station on highway A5 ... 33
Figure 18 – Santa Maria Hospital location ... 34
Figure 19 – Lagoas Park location ... 34
Figure 20 – Pick-up point organization ... 36
Figure 21 – Flower of service – core product surrounded by clusters of supplementary services (Lovelock, 1992) ... 37
Figure 22 – Pick-up point service storyboard ... 39
Figure 23 – SEB for order placement ... 40
List of tables
Table 1 – Segmentation variables for consumer markets, adaptation after Kotler (2012) ... 7
Table 2 – Example of PRIZM clusters – Source Nielsen Claritas ... 9
Table 3 – Social Demographics variables ... 16
Table 4 – Variables for internal characterization of Continente ... 17
Table 5 – External variables ... 18
Table 6 – Variables weights ... 24
Table 7 – Selected freguesias for the residential segment... 28
1 Introduction and project presentation
E-commerce is becoming a more and more important trading process, that had a rapidly growth in the past years and will continue to grow with up to 20.1% in 2014 according to eMarketer’s forecasts. With the continuous evolution of e-commerce a number of challenges arise, forcing the companies to offer better and better services and create new strategies and approaches in order to attract more customers. This paper will describe the actual state of the e-commerce, the marketing segmentation strategies and the design of new service using specialized techniques
1.1 Company presentation - SONAE
SONAE is the biggest company in Portugal with more than 40.000 employees. It was founded in 1959 as “Sociedade Nacional de Estratificados” in Maia and its primary business was wood engineering specialized in high-pressure decorative laminates. Over the next 20 years the company remained in the wood industry, but after the Carnation revolution until nowadays, it started to develop in new directions, SONAE SGPS SA was created as a holding company for different business like retail, real estate, telecommunications, information technology, tourism and leisure, tourism and media. Also SONAE expanded their business abroad and went internationally in the mid ‘80s and in the same period an important step was made in the retail direction by opening their first hypermarket, Continente, in Matosinhos.
Since 2009 the company reorganized its business areas into the following:
Core businesses:
SONAE MC – book, grocery and food retail
SONAE SR – non-food retail (electronics, sporting goods and clothing)
Core partnerships:
SONAE Sierra – international specialist in shopping centers and leisure
SONAECOM – partnership for telecommunications, information technology and media areas
Related business
SONAE RP – manages retail real estate assets
Investment management
Supporting the implementation of corporate and business strategy and financial investments
SONAE MC is present in the food retail market leader in Portugal, having different formats: Bom Bocado (cafeteria/restaurants), Book.it (book shop/stationery), Continente (hypermarket), Continente Modelo (hypermarket close at hand), Continente Bom Dia (convenience supermarket), Continente Ice (frozen products), Meu Super (franchised supermarket) and Well´s (health, well-being and eye care).
Continente trough modelo.com team, has launched in 2000 Continente Online (COL), an e-commerce service channel for SONAE MC that includes all operations of an e-commerce or e-retail business model, like: online ordering and payment, picking and order preparation, delivering operations, invoicing, marketing and catalog management. Continente Online is also responsible for managing the operations for home delivery service offered by Continente physical stores.
Currently COL is operating in 15 physical stores around Portugal, strategically chosen in order to cover the most important areas in the country like: Grande Porto, Grande Lisboa, Coimbra, Viseu, Guimarães, Covilha and Guia.
1.2 E-Lisbon project in Continente Online
Since its first opening in 2000, Continente Online has been one of the leaders in the e-commerce business, Continente as a whole being selected for many the years the most trusted brand in the country. As the business continued to expand, the company desired to offer a better service for its clients and also wanted to acquire new ones trough specifically targeting in order to increase their sales and penetration.
Therefore the E-Lisbon project is aiming to develop a regional grocery e-commerce strategy to drive business results by revising the current business and targeting model to achieve its full potential in Lisbon area. This requires a set of actions to be done, such as:
Internal analysis and diagnostic, best practices and vision for the on-line business
External analysis of the competitors and opportunities
Create a clear target definition of the customers
Evaluate and define new value propositions to drive sales, supporting new customers acquisition and identifying share-of-wallet increase opportunities (by working on variables such as delivery fees, new services offering, promotional initiatives)
Prepare an implementation roadmap for future actions together with the
implementation of short term initiatives and proposals of longer term 1.3 Thesis Project objectives
The main purpose of the thesis is to create a complete market analysis of the Lisbon area characterized by socio-demographics, the current situation of Continente in this area, and external factors. Then provide an overview of the strong and tangible results in order to create a proper business strategy and action plan to achieve an increase in sales, buying frequency and number of customers. The main objectives are listed below:
Define geographically the targeted area
Collect socio-demographic data about respective area at the level of freguesias, such as population, age distribution, wages, movements, buildings, population density, internet use and many more.
Create an internal analysis of Continente, both for offline physical stores (COF) and online stores (COL).
Create a model for data analysis, interpretation and targeting
Identify high potential zones of interest
Suggest an action plan for the identified high-potential zones and analyze the impact
Propose new services and value propositions
1.4 Followed methods in the project
The methods used in the project consist in defining the variables of interest, followed by data collection about Lisbon area, using sources such as INE (Statistics National Institute of Portugal), private statistics companies, Lisbon Metro, internal databases of Continente for both physical stores and online, internal market research department, mapping applications. Afterwards the data was integrated into a single database that contained all the information, by using as a unique record each freguesia. Raw data was processed and consolidated.
Next step was the data analysis, in which a model was created in order to analyze the information about each freguesia. The goal was to select the top freguesias that have a high potential for online shopping and a number of 57 were selected and classified into different types segments that require different types of approaches and value propositions.
1.5 Project structure and organization
The project contains four major parts. It starts with a contextualization and state of the art in order to create a framework for the project and supporting its importance. The next section describes in detail the existing problem in Lisbon for Continente Online and explains the methodology for data collection, integration and processing.
The third section presents the proposed solutions for each type of customer segment and target direction based on the acquired information and what are the proposed actions that should be adopted to accomplish the objectives.
It continues with the description of a new service proposal for the new pick-up points and will end with the conclusion of the research and the future work and developments.
2 Contextualization and state of the art
Since the first communications trough Internet in late 1960s our lives and the way society it is today was changed, because the users and businesses wanted to take full advantages of its great benefits of interconnection and the power of sharing information. The commerce was one of them, therefore the first trading process started to emerge just a few years later in some primitive ways, helping companies to exchange data and documents, placing orders, sending invoices and many others, that evolved in what is called today electronic data interchange. The current chapter will describe a short history of e-commerce and contextualization of self-service technologies and service design.
2.1 E-commerce/E-grocery – self-service technology
The first self-service store was created in 1916 by Clarence Saunders. In grocery stores of that time, shoppers presented their orders to clerks who then gathered the goods from the store shelves. This type of service truly revolutionized the whole grocery industry (Piggly Wiggly, 2014) and therefore most of the stores nowadays are structured in a similar manner where the customers are picking their grocery from the sales area and proceed to the checkout that can either be a person, cashier or a self-checkout kiosk.
As mentioned before the first type of electronic commerce or e-commerce started trough EDI (Electronic Data Interchange), which is a process where computer-to-computer exchange of business documents between companies and it was used primarily in B2B. EDI replaces the faxing and mailing of paper documents (Covalent Works, 2014).
As defined by Turban et al. (2008) e-commerce is the process of selling, transferring, or exchanging products, services, and/or information via computer networks, including the internet.
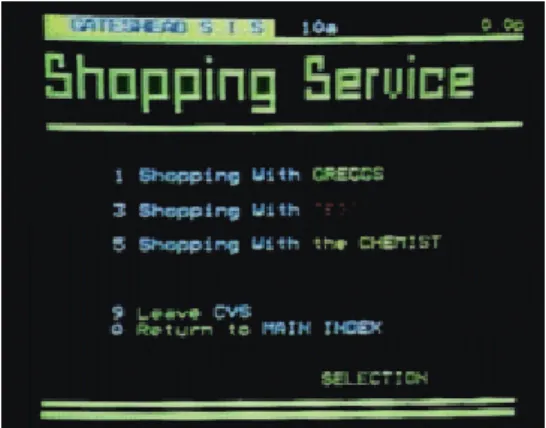
In 1979, Michael Aldrich, a British pioneer and inventor, created in the UK the first e-commerce system which consisted in a modified domestic television connected via a telephone line to a computer that that was processing transactions in real-time. It had a primitive interface based on videotex, with a simple human-computer interface that can be seen in the Figure 1. During the following years, in 1980s this type of system was marketed mostly as B2B, but some other applications for holiday traveling, vehicle spares and loans were created for B2C.
According to Mr. Aldrich archive (2010), the first B2C online shopping system was introduced by TESCO with the help of Gateshead Shopping and Information System in 1984. An elderly couple, Mr. and Mrs. Snowball were the first ever online shoppers. Then in 1986 another project was created that gave the opportunity for the customers and disadvantaged people to order from a total of 4000 grocery articles from Wm Morrison. So brick by brick the base of e-commerce and e-grocery was starting to be built giving to the public the commodity of home shopping.
But that was just the first step, the invention of the World Wide Web as we know today in 1990 by Tim Berners-Lee was a breakthrough revolution, standardizing the communications and paving the path for the first online book store in 1992 by Charles Stack. The giant Amazon was launched in 1994 by Jeff Bezos, the same year with the release of SSL encryption that made the transactions safer, then in 1996 eBay opened and TESCO started a full online shopping service (Aldrich 2010). The dot-com era, 1990s until 2000, created a large number of new businesses that were focused on the online commerce including the major players of e-grocery like, Webvan, Peapod (which is currently the main player in the U.S. market). But as Lunce et al. described (2006) e-grocery was among those businesses in pure play markets that can fail very easily due to nature of the retail business which has a low marginal profit that can be as slim as 5%, so all the activities need to be optimized in order for the company to survive.
Nowadays the e-commerce has reached its maturity with total sales worldwide reaching 1,5 Trillion dollars in 2014 (eMarketeer.com, 2014) with the UK having the world’s biggest e-commerce market in 2010 (Kalapesi et al.) and Czech Republic having the biggest turnover, 26% of the country’s total, generated via online channel (Eurostat, 2013).
Online ordering has extended from the PC or laptops to the mobile devices such as smartphones and tablets, the companies are creating special applications that facilitate ordering and these may include custom shopping list, ordering just by scanning the EAN code on the product and many other functions.
The brick-and-mortar businesses have to migrate towards online in order to keep their market share and brand positions. E-commerce has numerous advantages over the offline retail, one can be that users are able to search and compare different products with just few clicks of the mouse. Also trough web tracking technology it’s very easy to track customer’s preferences in order to deliver a better service and create individualized marketing.
In Europe online grocery business is growing rapidly (doubled over the past 5 years, Kraak, 2014), UK having one of the most mature market with some big players such as TESCO, Asda and Sainsburry. Being in such an ascending trend even giants like Amazon are trying to enter this type of market.
In Portugal, most of the offline grocery stores also have online shopping and this includes, Continente, Jumbo, El corte Ingles and Froiz, the oldest being Continente with over 13 years of presence in the e-grocery market.
The future of the online grocery in Europe looks promising, only early movers will win and only if they have an outstanding value proposition, because nowadays “good enough” is not just good enough. One tipping point might be the click and collect service that let customers to make an online order and pick it up in the store. Also this helps the retailers to easily enter in the online market being a lot easier than home deliveries by eliminating some problems such as market fluctuations on demand and high investments in trucks or delivery
services. It is a service that appeals to European consumers with a significant fraction disposed toward pickup as they are toward delivery, but as there are different segments of customers, the best option is to have both of the services available (Galante et al. 2013).
Nowadays the self-service technology includes a lot of automated services that in the past were only realized by employed personnel; this includes self-serve checkouts in supermarkets, online check-in for airports, automated phone information and many others. By adopting self-service the companies are reducing costs, but they are also reducing the personal contact which is known to have a positive impact in customer retention. Investing in this type of services also improves the service delivered, both qualitatively and speed. For the final customer this leads to a lower price of the service and a better experience.
2.2 Market segmentation
In order to be able to compete more efficient, the companies are adopting the target marketing by focusing on groups of customers that share the same characteristics rather than scattering their marketing efforts. This leads to a bigger chance of satisfying the customer’s needs.
To have efficient target marketing it is required to follow the next steps (Kotler, 2012): 1. Identify and profile distinct groups of buyers who differ in their needs and wants
(market segmentation).
2. Select one or more market segments to enter (market targeting)
3. For each target segment, establish and communicate the distinctive benefit(s) of the company’s market offering (market positioning).
The current project will focus more on the market segmentation and targeting.
The simplest form of marketing is the mass marketing which engages the mass production, distribution and promotion to addresses the same product for all types of customers. This might come in handy because it has the largest potential market that involves low costs and there is no need of multiple ways of promotion for different segments. But nowadays the market is getting scattered and together with the evolution of the advertising media and distribution channel is creating a hard and expensive work for the adepts of mass marketing. The trends now in the age of the big data (with the help of the new technologies and advanced analytical software) is to go into micromarketing that targets small groups of customers that share certain relevant characteristics and can be at one of the four levels: segments, niches, local areas and individuals. (Kotler, 2012)
2.2.1 Market segmentation
Market segmentation represents a strategy that divides a broad market into different well-defined slices (Kotler, 2012) or segments. A market segment represents a group of customers that “share common characteristics, needs, purchasing behavior, or consumption patterns (Lovelock, Wirtz, 2007). The segments must be homogenous and the customers must share as much similarity as possible and a big dissimilarity on the same characteristics between different segments.
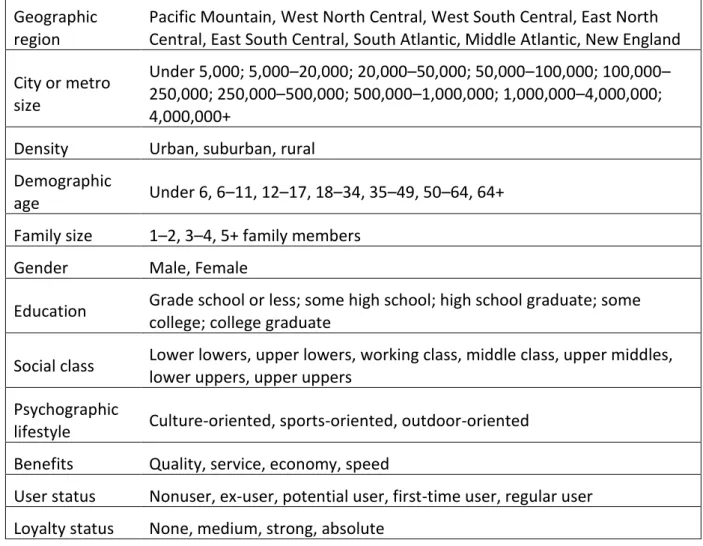
According to Kotler (2012) researchers use two larger groups of variables to create de segments markets:
1. Descriptive characteristics: geographic, demographic and psychographic – where the researcher examines different needs or product responses
2. Behavioral considerations: customer responses to usage occasions, benefits, or brands – where the researcher looks for whether different characteristics are associated with each customer-response segment
Some examples of these variables can be seen in the next table.
Table 1 – Segmentation variables for consumer markets, adaptation after Kotler (2012)
Geographic region
Pacific Mountain, West North Central, West South Central, East North Central, East South Central, South Atlantic, Middle Atlantic, New England City or metro
size
Under 5,000; 5,000–20,000; 20,000–50,000; 50,000–100,000; 100,000– 250,000; 250,000–500,000; 500,000–1,000,000; 1,000,000–4,000,000; 4,000,000+
Density Urban, suburban, rural
Demographic
age Under 6, 6–11, 12–17, 18–34, 35–49, 50–64, 64+
Family size 1–2, 3–4, 5+ family members
Gender Male, Female
Education Grade school or less; some high school; high school graduate; some
college; college graduate
Social class Lower lowers, upper lowers, working class, middle class, upper middles, lower uppers, upper uppers
Psychographic
lifestyle Culture-oriented, sports-oriented, outdoor-oriented
Benefits Quality, service, economy, speed
User status Nonuser, ex-user, potential user, first-time user, regular user
Loyalty status None, medium, strong, absolute
As each person or client company has its unique characteristics and needs, they can be a potentially separate target segment. But traditionally companies tried to achieve economies of scale by targeting all their clients within a specific market segment and serving each in similar fashion. This is the case of mass customization that offers a service with some small individualized products elements to a large number of clients that can be achieved by offering a standardized core product and tailoring supplementary service elements to fit the requirements of individual buyers (Gilmore and Pine, 2000).
2.2.2 Geographic segmentation
Geographic segmentation divides the market into geographical units such as, states, regions, cities, counties or neighborhoods. A company can operate in one or many regions, but it should pay attention to the local variations. In this way it can tailor marketing strategies to the needs of the local customers groups in trading areas, neighborhoods or even individual stores. More and more the regional marketing means go exactly to a specific zip code and companies are using mapping software to localize their customers, the zones of influence of each store in a given radius (usually by driving times, 5, 10 or 15 minutes). Having these zones mapped the retailers can rely on customer cloning, assuming that the best prospects are already living in the same area.
2.2.3 Social-Demographic segmentation
Using demographic segmentation the market is divided using variables such as age, family size, gender, wage, education, employment status, nationality, and social class. The demographic variables are useful to use because they are easy to measure and because they’re often associated with consumer needs and wants. Even when the target market is described in non-demographic terms (i.e. personality type), it may need to be linked back to demographic characteristics in order to estimate the size of the market and the media that should be used to reach it efficiently.
Some of the most important variables that are also going to be used in this project are presented in detail here:
AGE – the customer’s tastes, needs and abilities change with age that means an elderly customer might have difficulties in carrying their own groceries comparing to a younger one.
GENDER – is generally known that men and women have different tastes in many domains like cars, perfumes, food, drinks etc.
WAGE – is an important variable that reflect the buying power of an individual, so different strategies must be adopted based on the product and service type offered to align with the customer possibilities
FAMILY – the size of the family is another important factor, the same as number of children and their age. This variable can be also correlated with the age
Some of the approaches can combine the two types of variables, social-demographics and geographical data, in order to give more enriched information about a region and its type of costumers. Nielsen Claritas developed a geoclustering approach called PRIZM (Potential Rating Index by Zip Markets) that classifies the U.S. neighborhoods in 14 groups and 66 lifestyle segments called PRIZM Clusters (Enbenkampf, 2003). The groupings take into consideration 39 factors in five broad categories: education and affluence, family life cycle, urbanization, race and ethnicity, and mobility. The neighborhoods are broken down by zip code, zip+4, or census tract and block group. The clusters have descriptive titles such as Blue Blood Estates, Winner’s Circle, Hometown Retired, Shotguns and Pickups, and Back Country Folks. The inhabitants in a cluster tend to lead similar lives, drive similar cars, have similar jobs, and read similar magazines. Table 2 contains some examples of four PRIZM clusters.
Table 2 – Example of PRIZM clusters – Source Nielsen Claritas
Young Digerati. Young Digerati are the nation’s tech-savvy singles and couples living in
fashionable neighborhoods on the urban fringe. Affluent, highly educated, and ethnically mixed, they live in areas typically filled with trendy apartments and condos, fitness clubs and clothing boutiques, casual restaurants, and all types of bars—from juice to coffee to
microbrew.
Beltway Boomers. One segment of the huge baby boomer cohort—college-educated, upper
middle-class, and home-owning—is Beltway Boomers. Like many of their peers who married late, these boomers are still raising children in comfortable suburban subdivisions and pursuing kid-centered lifestyles.
The Cosmopolitans. Educated, midscale, and multiethnic, The Cosmopolitans are urbane
couples in America’s fast-growing cities. Concentrated in a handful of metros—such as Las Vegas, Miami, and Albuquerque—these households feature older home owners, empty nesters, and college graduates. A vibrant social scene surrounds their older homes and apartments, and residents love the nightlife and enjoy leisure-intensive lifestyles. Old Milltowns. Once-thriving mining and manufacturing towns have aged—as have the residents in Old Milltowns communities. Today, the majority of residents are retired singles and couples, living on downscaled incomes in pre-1960 homes and apartments. For leisure, they enjoy gardening, sewing, socializing at veterans clubs, and eating out at casual
restaurants.
2.2.4 Regional approach
This type of approach involves creating a specific strategy for a specific region and this should adapt to the existent situation in that area. The planning is done based on a clear vision of what the markets demand and how they behave.
Kotler defines the regional marketing as “The strategic market-oriented planning of a region with a view to matching stakeholders’ needs and local economic objectives.”
The definition implies that the regional marketing includes strategic planning based on the local market research and studies. It also uses inside-outside approach to achieve the objectives, that means both an inside analysis of the company’s situation in the specified region and the outside that can be social-demographics defining it, opportunities and threats and particularly characteristics. As an example, for promoting a product in two different regions can be totally changed based on the organization of the transport system. In a small city it might be difficult to spread flyers when you don’t have a big central point with a lot of traffic like a transportation hub as in a big city with metro or ferry.
2.2.5 Marketing communication
Within a service setting, the marketing communications tools are very important because they help creating strong images and a sense of confidence, credibility and reassurance. Marketing communications are in a way or another essential to a company’s success (Lovelock, 2007). They are the key point in transmitting the value proposition of a company’s products or services, what can they offer and how can be used to improve one’s life.
The main role of marketing communications is to help inform, persuade and remind customers about the products and brand they commercialize, also to tell about the existence of the company and makes it well known by the public.
Marketing communication mix refers to specific methods used to promote a company and its products to their target customers. According to Kotler, (2012) it consists of eight major modes of communication:
1. Advertising - Any paid form of nonpersonal presentation and promotion of ideas,
goods, or services by an identified sponsor via print media (newspapers and magazines), broadcast media (radio and television), network media (telephone, cable, satellite, wireless), electronic media (audiotape, videotape, videodisk, CD-ROM, Web page), and display media (billboards, signs, posters).
2. Sales promotion - A variety of short-term incentives to encourage trial or purchase
of a product or service including consumer promotions (such as samples, coupons, and premiums), trade promotions (such as advertising and display allowances), and business and sales force promotions (contests for sales reps).
3. Events and experiences - Company-sponsored activities and programs designed to
create daily or special brand-related interactions with consumers, including sports, arts, entertainment, and cause events as well as less formal activities.
4. Public relations and publicity - A variety of programs directed internally to
employees of the company or externally to consumers, other firms, the government, and media to promote or protect a company’s image or its individual product communications.
5. Direct marketing - Use of mail, telephone, fax, e-mail, or Internet to communicate
directly with or solicit response or dialogue from specific customers and prospects.
6. Interactive marketing - Online activities and programs designed to engage
customers or prospects and directly or indirectly raise awareness, improve image, or elicit sales of products and services.
7. Word-of-mouth marketing - People-to-people oral, written, or electronic
communications that relate to the merits or experiences of purchasing or using products or services.
8. Personal selling - Face-to-face interaction with one or more prospective purchasers
for the purpose of making presentations, answering questions, and procuring orders.
2.3 Service design
Since the competitiveness and customer expectations are continuously increasing in all service industries, designing and providing new services it is a must. Even if a service delivered is good might not be enough, that’s why a company needs to find new ways to create and provide the services. The final outcome of a service combining all the processes involved in its delivery must create a better customer experience and new benefits.
Evenson (2008) defines service design as a process that involves understanding users and their context, service providers and social practices, as well as transforming this understanding into the development of evidence and service systems interaction. “A service design approach is holistic. It looks at systems and subsystems of relationships and interactions. It takes the context into consideration, being aware that services are living systems. The work of service design is often interdisciplinary by necessity.” (Mager, 2009)
Service design is an emerging field (Mager 2009). The design methods are still in development and sometimes are borrowed from other related areas. A new service development process can be organized into several steps (Edvardsson et al. 2000): (1) service idea generation; (2) service strategy & culture gate; (3) service design; and (4) service deployment and implementation. From this perspective, design is only one step of the development process.
According to Mager (2009) the five principles of service design are: holistic view, interdisciplinary, co-creative work, visual thinking and radical approach. Furthermore, in (2010, Stickdorn) also proposes his principles of service design thinking:
1. User Centred - Services should be experienced through the customer’s eyes 2. Co-creative - All stakeholders should be included in the service design process 3. Sequencing - The service should be visualized as a sequence of interrelated actions 4. Evidencing - Intangible services should be visualized in terms of physical artefacts 5. Holistic - The entire environment of a service should be considered
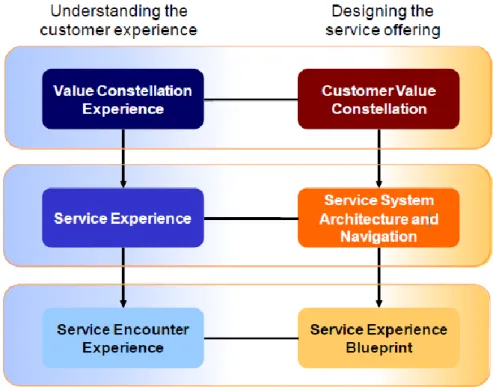
Both of these approaches refer to the practice of the service design rather than the outcome. One method of service design is the multilevel service design (MSD) developed by Patrício et al (2011) which unites the contributions of new service development, interaction design and designs the service offering trough the different levels of customer experience. The three levels, as seen in Figure 2, are: (1) the service concept level, considering Value Constellation Experience and Customer Value Constellation, (2) the service system level, considering Service Experience through Service System Architecture and Navigation and (3) the service encounter level considering Service Experience Blueprint to design Service Encounter Experience.
The process consists into two stages, first with understanding the customer experience on every level using qualitative methods that can be supplemented with quantitative methods. The second stage will use the customer experience needs to design the service offering.
This paper will concentrate on the Service Experience Blueprinting for describing a new service proposal. SEB was designed by (Patrício et al. 2008) and it derives from service blueprinting by (Shostack, 1984). SEB studies customer service task and customer experience requirements being independent of the service interface used. In MSD, it is used to map the actions of the different participants in the service encounter, both frontstage and backstage. It also describes the lines of interaction, lines of visibility, waiting points, fail points and service interface links (a point where the customers is guided to another interface).
The key components of a service blueprint are (Patrício, 2013):
1. Definition of service standards for each activity in the frontstage 2. Specification of the physical evidence in the frontstage
3. Activities performed by the customer in the frontstage 4. Line of interaction
5. Activities performed by the service employees in the frontstage 6. Line of visibility
7. Activities performed by the service employees in the backstage 8. Support processes involving other employees
9. Support processes involving technology
Another important aspect is that SEB integrates with Activity Diagrams from UML, incorporates the experience requirements into the process and explicitly designs the service interface links to enhance the customer experience across channels.
3 Problem description and methodology
3.1 Problem description and methodology
Great Lisbon is one of the most important regions in Portugal, from economic point of view, concentrating around 25% of the Portugal population (Censos 2011). Continente Online along the years has observed a lower market share than the national level in the region and has decided to target trough a regional approach the existing potential.
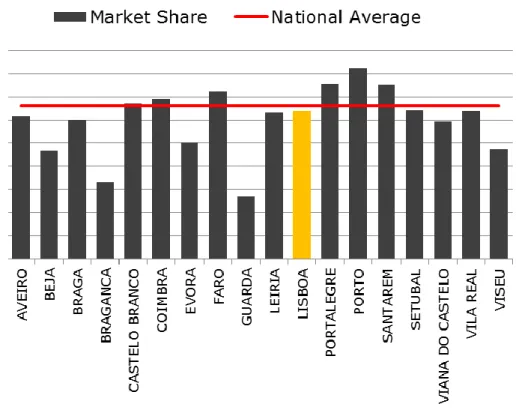
As seen in the Figure 3 the market share of Lisbon (Nielsen Company, 2013) is 1.5%, lower than the national average and almost with 10% lower than the second most important region in the country, Porto. Also another important factor is that the average monthly earnings in Lisbon area (INE, 2011) are with almost 30% higher than the national average, with 1.375€ per person compared with 1.085€ on national level.
Figure 3 – Continente market share
Another reason for targeting Lisbon area was because of the high penetration of internet users, 75% of the population over 15 years is using internet in Great Lisbon, compared with 66% in Great Porto or 63% the national average (Media screen, 2013).
Having these aspects in mind, the company wishes to achieve the full potential that the region can offer and needs to take some actions in order increase their market share, the volume of sales and share-of-wallet.
The first step in the process is to define the targeted area from geographic point of view. The purpose of the project is to target the Great Lisbon area, but due to the costs of transportation only the areas in the proximity of the stores that operate with online order. It
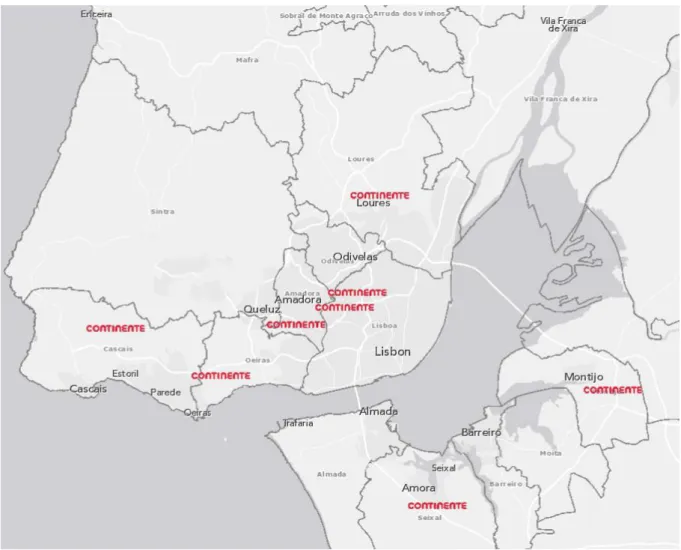
must be mentioned that there are eight physical Continente stores that have operations for the online, these are: Continente Amadora, Continente Cascais, Continente Seixal, Continente Colombo, Continente Loures, Continente Montijo, Continente Oeiras, and Continente Telheiras. The location of these can be seen in Figure 4.
Figure 4 – Continente Online stores location
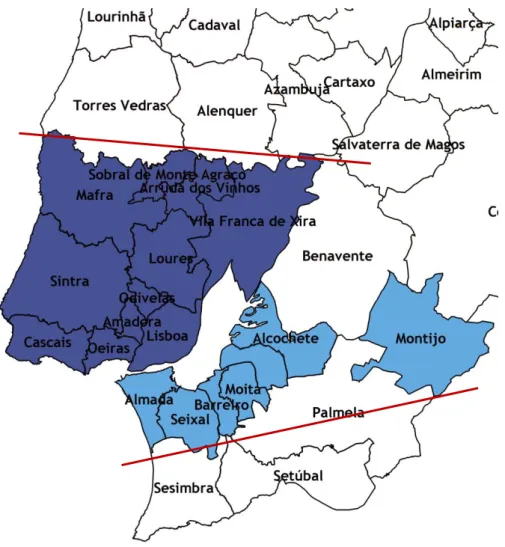
Based on their location, a selection of 17 concelhos was made, in the districts of Lisbon and Setubal, counting a total number of 172 freguesias from those concelhos. In the Figure 5 the colored freguesias between the two red lines, represent the one included in the analysis. All the data that was collected was at the freguesias level for a more accurate analysis.
The second steps is to collect socio-demographic data about respective freguesias, and select the variables of interest like population, age distribution, wages, market potential, movements and traffic, transportation hubs, number of buildings, population density, internet use and many more.
The third step is to analyze the internal data of Continente, like data for the offline stores, COF, in terms of market share, the distribution of the clients in terms of sales and frequency and the total number of clients. For the online stores (COL) the same procedure was done, but with more in depth analysis. The data collected included the number of unique clients for online, their average order, frequency of buying, the type of delivery used, the online penetration, highlighting the differences between COF and COL.
The fourth step was to create an external analysis or market analysis that was taking into consideration the number and location of the competitors’ stores, the Continente market share, surface share, along with the leaders in each freguesia.
Figure 5 – Targeted zone in Great Lisbon
The fifth step was consolidating and integrating all the data collected in the previous steps in a big database that contains all the information about all the freguesias and that could be used for the analysis.
The sixth step was defining and creating a model for data analysis, interpretation and targeting in order to identify high potential zones of interest. This is a critical step in the process because it has to be very accurate in order to correctly choose the zones of interest based on the identified important factors. If the model is wrong the selection of the freguesias might be wrong and the decisions that will be taken will not lead to the desired results. The model can be considered the key point of the current project.
After successfully identifying of the freguesias of interest, the last step consists in creating an action plan that will include creating new services and value propositions, ways of attracting the clients and the type of marketing communication used to achieve the objectives.
These actions are going to be customized for each freguesia according to their specific characteristics and will include 4 main directions:
1. Residential segment – which targets the people that live in high potential freguesias that might be willing to buy their groceries online and having them delivered home
2. Corporate segment – the main target being the people that work inside big companies or business parks
3. Transportation hubs – this direction targets high traffic zones
4. Special targets – clients that don’t buy groceries or lost clients from the offline stores
As a part of the action plan, a new service will be developed and designed, that will be described in detail in the Chapter 5 – New pick-up point service description.
3.2 Identifying the variables of interest from the data available
The characterization of each freguesia was done in depth; therefore an important number of variables were selected to be used in the analysis from the data available. According to the steps presented in the previous section, these are divided into: socio-demographics, internal variables for offline and online Continente stores, external variables that represent the external factors that characterize the market.
The social-demographics variables selected can be found in the next table, together with their measure unit.
Table 3 – Social Demographics variables
Variable Unit of measurement
Population no. of residents
Population density residents/km2
Age group (0-5, 5-10, 10-14, 14-20, 20-24, 25-45, 45-65, over 65)
no. residents within range
Population with superior studies no. of residents
Population employed no. of residents
Population using internet % of residents
Families no. of families
Average monthly wage euros
Buildings no. of buildings
Houses no. of houses
Pop. entering the municipality for work or study no. of persons
Pop. exiting the municipality for work or study no. of persons
Car traffic on major highways no. of cars daily
Metro stations locations geo-position
Ferry traffic no. of persons annually
Freguesia surface km2
Parking lots location geo-position
Parking lots capacity no. of places
These variables were considered to be the most appropriate for the present study, for example the population is considered an important factor in order to know the number of possible clients, the population density is used to analyse the transportation costs (a freguesia with higher population density has lower costs because the clients are more probable to live closer to each other), the average wage is important to determine the potential in a certain area.
The variables used for internal characterization of Continente, both offline and online stores can be found in the Table 4.
Table 4 – Variables for internal characterization of Continente
Variable Unit of measurement
Offline Continente stores
Stores no. of stores
SONAE Clients no of clients
1
Value segments no. of clients
Lost clients no. of clients
Continente Online
Unique clients no. of clients
Average orders per month no. of orders
Average value per order Euros
Average orders per client per month no. of orders
Home deliveries no. of orders
Pick-up from store no. of orders
Online penetration % of families
Online coverage Freguesias
1
Value segments no. of clients
Non-grocery clients no. of clients
It is clear why some of the variables were chosen, such as the existing number of clients, the number of offline stores, to understand the current general situation. On the other
hand, variables such as lost clients, or non-grocery clients were selected in order to target those clients in a special way, in order to convert them to normal clients.
The variables related to the number of orders, their value and type of delivery for the online store provide information about the trends and preferences of the customers together with the amount they spent when buying online.
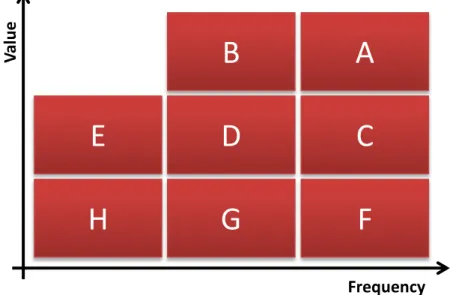
In the table there is also presented the “Value segment” variable notated with (1) which represent the segment used to characterize the value and frequency of purchases (Figure 6), the clients from segment A buy more frequently and have a high value purchase while segment H buys less frequently with a low value:
Figure 6 – Value segments
External variables were collected in order to characterize the market, Table 5, and include the number of competitors’ stores in order to know what the level of competition is.
Table 5 – External variables
Variable Unit of measurement
Competitors’ stores no. of stores
Leader Store chain
Market share % of market
Surface share % of selling surface
Consumption index for grocery and hygiene no unit
Frequency V al u e
A
B
C
E
D
F
H
G
3.3 Data collection
After deciding the variables of interest that are going to be used, a long and arduous process of collecting all the data for each freguesia was conducted. Multiple sources were used, both internal from SONAE and external from various providers.
For the social demographics the major data source was the national institute of statistics (INE, 2014) that provided the information from the 2011 Census and other studies related to our variables via their website and census (Census 2011): population, population density, buildings, age group, employed population, families and houses, monthly wage and freguesias surface, movements; ferry traffic (2012). Other data sources used were the following (together with the year of the study):
Transportes de Lisboa – Metro traffic and stations locations (2013)
EMEL and Parkopedia – information about the parking lots (2014)
IMT – the national institute of mobility and transports – information about the road traffic (2013)
Marktest – private company of market research in media - internet usage (2013) It should be noted that the information for the movements, population entering and exiting the municipality was only available at the level of concelho; the same for the internet usage which was available at level of the region (Great Lisbon), although this will not affect the study.
The internal data for the physical stores of Continente two data sources were used: the market research department of Continente and other internal data. Trough collaboration with these departments we managed to obtain the relevant information for the selected freguesias for the entire year of 2013.
For the online store the data was collected in raw format from the internal database of the orders and clients, starting with 1st of June 2013 until 1st of March 2014, a total of nine months. This period was chosen and not the full year, because in June 2013 a new platform for online shopping was released and it is more appropriate to have the results of the same platform than from different platform, in order to minimize the errors and biases due to different platforms. This data include information about the orders, the value, unique clients, frequency of buying and delivery type. The online coverage was obtained from the operations department of COL. The values for the value segments were obtained in collaboration with the market research department of Continente.
The variables used for the external analysis were obtained from a market study conducted by the Nielsen Company in 2013, which provided the market share, surface share, and the leader. The competitors’ stores and consumption index were collected from the market research department.
3.4 Data integration
After collecting all the data from different sources for the variables presented in the previous section there was a need to integrate them into one single database that is homogenous, structured and standardized, because the data from different source was organized in different forms according to the needs of each provider. This is needed in order
to facilitate the access to the information from one point and to ensure that the collected data is viable.
One of the first steps in data integration is to detect the records in the different data sets that belong to the same statistical unit so that there is a unique record of data that contains all the information collected from different sources. In this case, the unique record is each freguesia.
A second step is to make sure there is a harmonization between reference periods of time, same year, same time interval etc. to provide relevant data. This was taken into consideration in the current study; the social-demographics (which change very little in time) were collected in 2011 during the national census, the information for traffic and internet usage was collected in the same year, 2013, to have more recent, therefore more accurate information (due to the high oscillation in values). Keeping the same time frame, for maximum accuracy, the information for offline and online Continente stores, market and surface share, consumption index and competitors was collected in the same year, 2013.
For the raw data of COL containing the list with all the orders and information about the customer for the respective order, first a preprocessing was done. This consisted in counting all the unique clients, mapped by their postal code to see the belonging to each freguesia. Then only the clients from the target were selected and split by their type of delivery (home or pick-up from store). Then more processing was done to calculate their frequency of buying, the value per order and the category of products that they were buying, to identify the non-grocery ones. To calculate the online penetration, the number of total clients was divided to the total number of families in each freguesia. The families were used because usually only one member of the family makes purchase or there is only one account per family.
One of the most demanding tasks in the data integration and collection was mapping the geographic positions for the variables that needed it (parking lots, metro stations). The collection was done visually using the maps in order to determine the freguesia affiliation.
The final integrated database contains the list with all 172 freguesias selected from the 17 concelhos which represent 172 unique records that contain information for each variable for characterizing each freguesia. This was another important step, to make sure there are no missing values for any record since every freguesia has the same importance in the analysis. 3.5 Data analysis
After successfully data collection and integration, the next phase is a complete analysis in order to identify the high-potential freguesias and zones of interest. This analysis must consider different points of view, according to the segmentation strategy and must include both socio-demographic view and business view.
Most of the data analysis will be done in the next chapter when constructing the model for characterizing the freguesias. In this section the additional data that wasn’t available at the freguesias level will be analyzed.
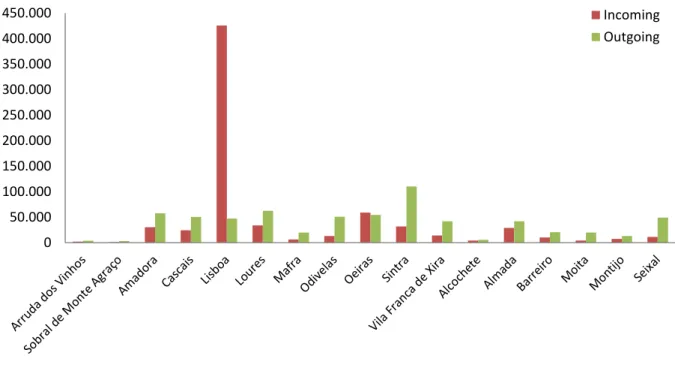
Information about movements was only available at the concelho level, but it provides important information about the volume of people that enter and exit each concelho. The next graph (Figure 7) illustrates the number of persons for each concelho. It is noticeable that around 430 000 persons of population are entering in Lisboa for working or studying. Another important factor is that only Lisbon and Oeiras have more people entering than exiting, all the
other concelho having an outward trend. This proves that most of the population entering in Lisbon is from the surrounding areas.
Figure 7 – Movements analysis
Also by analyzing other variables it can be concluded that concelho Lisbon has unique characteristics compared with the others, but this is normal since is the capital and all the administration offices, ministries and major companies are located here.
0 50.000 100.000 150.000 200.000 250.000 300.000 350.000 400.000 450.000 Incoming Outgoing
4 Segmenting the Lisbon market and proposing a targeting strategy
This chapter will present the creation of the proposed model for analyzing the freguesias that have a good fit for the online grocery, that have a high potential and buying power, together with low costs of services. In order to achieve the project results a series of actions will be proposed and their impact on the clients and the cost will be analyzed.
4.1 Data analysis and categorization
Before creating the final analysis model, a number of different other models were used, without success. That highlights the fact that in order to create or choose a model for analysis can be a trial and error process and it depends to a large extent of what are the results that need to be obtained.
What the proposed model tries to accomplish is to pinpoint identify the freguesias that have a good match with the characteristics of the online clients. This includes social-demographic fit and value segment, the age should be within the target age of the online clients and freguesias that have a potential above average. Before presenting the model, the characteristics of the online buyer was done.
4.1.1 Online vs. offline
In order to see what the typical online buyer is, the market studies results from the market research department were used to determine the most important socio-demographic characteristics, and by comparing the sales between COF and COL, it was determined what are the predominant frequency/value characteristics, in the Lisbon area.
As presumed, the predominant age group for the online shoppers (Figure 8) is the 25-45 interval, weighting almost three thirds of the total online clients (exact percentage was hidden due to confidentiality), showing that young and middle aged population is more attracted to use e-commerce for buying their groceries. This might happen because they trust more in the online services than the elders which are more skeptical and because they are using the internet with up to 40% more than the elders (Mediascreen, 2013).
Figure 8– Age group comparison COL and global Continente
0-18 18-25 25-35 35-45 45-55 55-65 >65
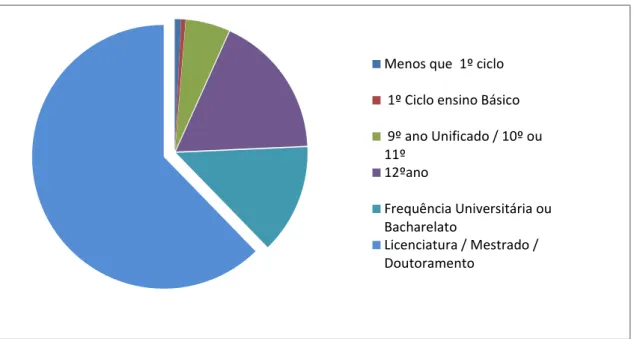
Another important aspect is the education of the population, as seen in the Figure 9. More than 60% of the online clients have the superior studies completed and more than 10% are attending bachelor or university courses.
Figure 9 – Education level for the online clients
For the value segments the Figure 10 shows the difference of the online sales compared with the offline stores’ sales, and it demonstrates that the predominant ones for online in Lisbon area are the A 90% above, B 220 % above offline stores and D with only 20%. This suggest those segments should be taken into consideration when analyzing a freguesia. (Note: the numbers were multiplied by a constant due to confidentiality reasons, real numbers were used in the analysis).
Figure 10 – Difference in value segments, online compared to offline
Another important factor is the family type, which from the study, results that most of these are consisted of 3 or more members. Wage is considered by the company another important variable, because it is related to the middle and upper class, therefore a higher wage a higher buying power. One of the reason for buying online, which was pointed out by the clients, is the fact that they are not willing to carry their groceries, so living in tall buildings represents a relevant characteristics of the target, buildings with 3 or more floors will be included in the model definition.
Menos que 1º ciclo 1º Ciclo ensino Básico 9º ano Unificado / 10º ou 11º 12ºano Frequência Universitária ou Bacharelato Licenciatura / Mestrado / Doutoramento
A
B
C
D
E
F
G
H
Until now it can be concluded that the most common online customer is between 25 and 45, makes purchases frequently with a high value, has superior education and is part of a family with at least 3 members that live in a building with more than 3 floors.
4.1.2 Variables importance
Based on the social-demographics and segment analysis a new dependent variable was created, which is called the “social-demographic fit” (SD_fit) that gathers all the characteristics indicated in the previous section. In order to have the same data unit, all the variables were transformed into percentage related to the population or the total number of families, i.e. if in a freguesia there is a total population of 1000 and there are 100 person in the target age, then it will be considered that the freguesias has 10% of population in the target age. For the families the number was related to the total number of families and similar for the value segments, the number of clients in one segment was transformed in the percentage of the total number from all the segments (i.e. if A segment has 10 customers and the total number of customers is 100, then it will weight 10/100 = 10%).
Then each of the variables was weighted differently according to their importance. At first for the value segment the difference in percentage (online compared to the offline) was used, transformed in percentage from the sum of the three differences:
Seg. A - 23%
Seg. B - 71%
Seg. D - 6%
As can be observed the segment B has the biggest weight, 71%, while D has the lowest weight of just 6%. These weights were used to calculate just the segment fit, which will be used as a variable with the other social demographics. The next formula was used:
Seg_fit = A∙0.23+B∙0.71+D∙0.06
To determine the weights for all the others a scale from 1 to 3 was used, where 1 is less important and 3 the most important. The next table presents the weights of each variable. Table 6 – Variables weights
Variable Weight
Seg_fit 3
Target age 25-45 years old (TA) 3 Families with 3 or more members (FAM) 3 Population with superior studies (SUP) 3 Monthly average wage (WAGE) 2 Employed population (EMP) 1 Buildings with 3 or more floors (BLD) 1
Choosing the weights was done after conciliation with the company’s managers and also using the data for the market studies. Since it is important to have a good segment fit, the variables was weighted with 3. Also because the target age, type of family and superior
still important but less important than the previous variables so it was given a weight of 2, while for being employed and the tall building variable was decided to receive only 1 because they should be taken into consideration but it is not such an important factor.
Therefore the formula for calculating the social-demographic fit value is the following:
SD_fit = 3∙Seg_fit + 3∙TA + 3∙FAM + 3∙SUP + 2∙WAGE + EMP + BLD
4.1.3 Building the model
In order to determine the potential for each freguesia, another new dependent variable was introduced that measures the potential per square kilometer, having its unit in euros/km2. Since the main target are the groceries sales, it will be considered only the potential of the population for food, personal care and hygiene. The potential is dependent on the population, consumption index and average consumption per capita (ACC) for the categories presented before. Considering that the value for the average consumption per capita for the year 2013 is
2055€ (Continente Market Research), the formula for potential is:
Potential = Population ∙ index ∙ 2055€
To obtain the potential per square kilometer, the total potential in a freguesias was divided to its surface (also measured in km2), but since the population divided by surface represents the population density the formula for potential per square kilometer is:
Potential/km2 = Population density ∙ index ∙ 2055€
The main reason for using potential per surface and not just the potential is because of the costs, as already mentioned when choosing the variables. Figure 11 shows the dependence of the costs and density for all Continente stores in Portugal that operate online orders. It can be observed that in the zones with higher population density the transportation costs are lower and vice versa, therefore the higher the population density the higher the potential per square km.
Figure 11 – Transport cost in relation with population density
Using the two new variables presented above a matrix was developed in order to characterize and select the best freguesias with high potential and high social-demographic fit. The matrix has four quadrants that represent each case: low fit and low potential, low fit high potential , high fit low potential, and high fit and high potential (Figure 12).
St o re 1 St o re 2 St o re 3 St o re 4 St o re 5 St o re 6 St o re 7 St o re 8 St o re 9 St o re 1 0 St o re 1 1 St o re 1 2 St o re 1 3 St o re 1 4 St o re 1 5
High SD fit Low potential High SD fit High potential Low SD fit Low potential Low SD fit High potential
Figure 12 – Social-demographic fit and potential matrix
Figure 13 – Distribution of freguesias social-demographic fit – potential/km2 matrix The matrix was applied for all 172 freguesias and the result can be seen in the figure 13. The freguesias of interest are located in the red square in the high potential and high segment fit quadrant. The intersection lines were located at the median of each value. The median was used instead of the mean because the data for potential didn’t have a normal distribution, some of freguesias having extreme values for potential compared to the others. Must be noted that in the figure there are not visible all the freguesias due to the abnormal distribution, and a limit was used for displaying freguesias that have the potential less than 10 million euros to better facilitate the visualization.
Using the matrix, the best 57 freguesias were selected that have the closest profile to the