1
A Work Project, presented as part of the requirements for the Award of a Masters Degree in Finance from the Faculdade de Economia da Universidade
Nova de Lisboa.
The Value Relevance of Tangible Fixed Assets
João Emanuel da Silva Sabino Student Number 213
A Project carried out with the supervision of Professor Cláudio Pais
2 Abstract
The Value Relevance of Tangible Fixed Assets
This Work Project aims to verify whether gains from the revaluation of tangible
fixed assets in Portugal and Spain are relevant to investors. My sample consists of
Portuguese and Spanish listed firms and it spans from the mandatory adoption of IFRS
in 2005 until 2009. The results suggest that gains from revaluations are relevant to
investors in Portugal and Spain both individually and together and independently of the
dependent variable used (March or December share prices). Also, further analysis
suggests that revaluations have lower value relevance in firms with high levels of debt
which implies an opportunistic motivation.
3 Introduction
This work project aims to assess whether the gains from the revaluation of
tangible fixed assets in Portugal and Spain have any impact on prices and, thus, value
relevance for investors.1 The motivation for this work project is to expand the current
knowledge on the value relevance of the revaluation of non financial assets for investors
under an International Accounting Standards Board (IASB) framework. This is relevant
since there are several existing studies on the subject of the value relevance of financial
assets but only a few when it comes to the value relevance of non financial assets.
Additionally, this kind of study is important if we take into account that a new
accounting system has come into existence in Portugal, the Sistema Nacional de Contas
(SNC) which consists, for the most part, of a summary of the International Accounting
Standards (IAS) rules and that applies to all companies except listed companies, banks
and insurance companies.
This study focuses mainly on the predictive value side of relevance which allows
for better forecasts of past and present events. However, this study can also be seen
from a feedback value side of relevance, as it allows information users to “correct prior expectations”. Unfortunately, the timeliness characteristic will not be included in this study due to insufficient observations that would allow for the testing of this
characteristic. In order to study this characteristic I need to use returns instead of prices
and, also, current revaluations or, in other words, revaluations performed in the years
studied, however, there are few observations which match this criteria and, therefore,
1
4
there are not enough observations to run a regression and get reliable results. This study
also focuses on the reliability of fair value which according to Hermann et al. (2006) is
more reliable than historical cost.
The empirical model used for testing value relevance is based on the model
developed by Ohlson (1995) with a few changes to allow for testing of gains from
revaluations.
It is essential to mention that this work project is just an initial study which
increases the current knowledge on the value relevance of the revaluation, or, in other
words, the use of fair value to measure non financial assets in European economies that
use IAS and, more specifically, IAS 16 – Property, Plant and Equipment, and which has
not been very thoroughly researched. This work project can be replicated for other
economies or for the entire European Union, for example. Not only is it possible to
extend this study to firm returns (Barth and Clinch, 1998; Aboody et al., 1998; Easton
et al., 1993) but also to a cash flow analysis (Aboody et al., 1998) or to an operating
income analysis (Aboody et al., 1998).
To test whether the gains from the revaluation of tangible fixed assets are
relevant, I estimate the relation between gains from revaluations in Portuguese and
Spanish firms from 2005 to 2009 and firm share prices at the end of the fiscal year. The
tests are controlled for Equity (less gains from revaluations) and Net Income. The
analysis is based on 814 hand collected firm year observations. As predicted, I find that
gains from revaluations are value relevant to investors, however, they are actually
negatively related with share prices. When I analyze the gains separately in each
5
Spain, which is probably due to the fact that several firms in the sample are cross-listed,
and positively related in Portugal.
I also perform an analysis using debt-to-equity ratios, in order to assess if
revaluations are performed for opportunistic reasons or to show a firm’s true financial statements. I find that revaluations have a lower value relevance in firms with a high
level of debt which implies an opportunistic motivation. This result is in line with
previous research such as Easton et al. (1993) and Aboody et al. (1999).
This work project is divided into several parts: a literature review which includes
a brief summary of the accounting method associated with the revaluation of non
financial assets and a review on several papers on the subject; a sample analysis that
explains which parameters were used to define the sample; a regression and descriptive
statistics; an analysis on the results and some comments; an additional analysis using
debt-to-equity ratios; and, finally, my conclusions.
Literature Review
IAS 16
As previously stated, this work project takes place in a European setting, which
means that the firms used in the sample follow IASB and, more specifically, IAS 16,
which is the accounting standard relevant for this research. The principal issues when
one accounts for tangible fixed assets are “the recognition of assets, the determination of
6
recognised in relation to them” (IAS 16.1).2 IAS 16 applies to property, plant and
equipment when it is “probable that future economic benefits associated with the asset
will flow to the entity” (IAS 16.7) and when its cost can be measured with a high degree of reliability and its main objective is to provide information relating to property, plant
and equipment to the users of financial statements in a way that allows them to “discern
information about an entity’s investment in its property, plant and equipment and the changes in such investment” (IAS 16.1).
“An item of property, plant and equipment that qualifies for recognition as an asset shall be measured at its cost” (IAS 16.15). This cost includes the asset’s purchasing price, costs directly attributable to bringing the asset to the location and
condition necessary for it to be capable of operating in the manner intended by
management and the initial estimate of the costs of dismantling and removing the item
and restoring the site on which it is located. The recognition of costs in a tangible fixed
asset’s carrying amount ends when the item is in the location and condition necessary for it to be capable of operating in the manner intended by management. “The cost of an item of property, plant and equipment is the cash price equivalent at the recognition
date. If payment is deferred beyond normal credit terms, the difference between the cash
price equivalent and the total payment is recognised as interest over the period of credit
unless such interest in capitalised in accordance with IAS 23” (IAS 16.23).3
A firm can choose between using the cost model or the revaluation model as its
accounting policy for recognizing an asset’s cost. With the cost model “after recognition as an asset, an item of property, plant and equipment shall be carried at its cost less any
2 Depreciation charges and impairment losses is an issue which is addressed in IAS 36 – Impairment of Assets.
7
accumulated depreciation and any accumulated impairment losses” (IAS 16.30). With
the revaluation model “after recognition as an asset, an item of property, plant and equipment whose fair value can be measured reliably shall be carried at a revalued
amount, being its fair value at the date of the revaluation less any subsequent
accumulated depreciation and subsequent accumulated impairment losses. Revaluations
shall be made with sufficient regularity to ensure that the carrying amount does not
differ materially from that which would be determined using fair value at the end of the
reporting period” (IAS 16.31). The fair value of land and buildings is usually determined through market-based evidence by appraisal normally performed by
professionally qualified valuers. The fair value of plants and equipments is usually their
market value determined by appraisal. If a tangible fixed asset is rarely sold or of a
specialised nature which leads to the inexistence of market-based evidence an entity
may need to estimate fair value using an income or a depreciated replacement cost
approach. When an item of property, plant and equipment is revalued, any accumulated
depreciation at the date of the revaluation can either be restated proportionately with the
change in the gross carrying amount of the asset so that the carrying amount of the asset
after revaluation equals its revalued amount or, it can be eliminated against the gross
carrying amount of the asset and the net amount restated to the revalued amount of the
asset.
“If an asset’s carrying amount is increased as a result of a revaluation, the increase shall be recognised in other comprehensive income and accumulated in equity
under the heading of revaluation surplus. However, the increase shall be recognised in
profit or loss to the extent that it reverses a revaluation decrease of the same asset
8
decreased as a result of a revaluation the process is exactly the opposite which means
that the decrease is recognised in profit or loss, however, the decrease is also recognised
in other comprehensive income when there is a sufficient balance in the revaluation
surplus.
It is also important to mention that an entity shall apply this Standard for annual
periods beginning on or after 1 January 2005 but earlier application is encouraged (IAS
16.81).
Related Research
This work project contributes to the research on the value relevance of fair value
estimates of non-financial assets, especially of tangible fixed assets. Aboody et al.
(1999) find that revaluations in the UK are positively associated with share prices and
returns and that fixed asset revaluation amounts are not unreliable. They also find that
revaluations are positively associated with future firm performance and that revaluations
reflect, at least partly, changes in underlying asset values on a timely basis.
Barth and Clinch (1998) show that revaluations of tangible fixed assets in
Australia are relevant to investors despite the fact that the value relevance seems to be
stronger for plant and equipment than for property. They also demonstrate that
revaluations which were done several years before are still value relevant to investors
and that both upward and downward revaluations add value to investors as well.
Easton et al. (1993) came to the conclusion that book values which include asset
revaluation reserves are more in line with the market value of firms than book values
9
earnings analysis, net increments of the asset revaluation reserves have a relatively low
explanatory power except in special situations, such as when the change in the debt
level is high or when the net increment to the revaluation reserve as a proportion of
book value is relatively high. This research was also performed in Australia.
I also believe that it is important to make a brief literary review of the history
and study of fair value, as well as the subject of relevance. According to Herrmann et al.
(2006) and to the Statement of Financial Accounting Concepts (SFAC) nº2 Qualitative
Characteristics of Accounting Information, relevance is defined by three main
characteristics: predictive value, feedback value and timeliness. Predictive value is the
capacity of the information under analysis to provide better forecasts of past and present
events. This is considered by many researchers as the most important characteristic and
the one which has been subject to more studies as those mentioned earlier or even my
own work project. Feedback value is the capacity of the information to allow users to
“confirm or correct prior expectations”. At the time of the acquisition, fair value and historical cost are the same. However, as time goes by, fair value changes while
historical cost does not, which means that fair value has “the potential to provide
valuable feedback to users”. Finally, timeliness is the availability of information to a decision maker while it has capacity to influence decision making. This subject was
studied in the papers by Aboody et al., (1999) and Barth and Clinch (1998).
Herrmann et al. (2006) not only argue that fair value is more relevant to decision
makers, but also that it is more reliable than historical costs. SFAC nº2 defines
reliability using three characteristics: verifiability, neutrality and representational
faithfulness. Although verifiability favors historical cost, there are a few exceptions
10
than fair value. Neutrality and representational faithfulness favor fair value since
historical cost violates the principle of neutrality because it “introduces a distinct conservative bias” and it does not provide representational faithfulness when “the market rate of depreciation (or appreciation) differs materially over time from the book
rate of depreciation”.
Sample and Data Selection
The initial sample consists of 225 firms, 57 Portuguese and 168 Spanish. This
includes all the listed companies in Portugal and Spain, from 2005 to 2009. This sample
spans a 5-year period, which is big enough to perform a value relevance analysis. This
time period is not more extended because IAS 16 only came into force on 1 January
2005 and, in order to have a consistent sample, I opted for not using information prior to
this date.
However, this sample suffered some changes due to the following reasons: (a) I
could not find any or part of the necessary information; (b) the accounting period of the
firm does not end on December 31st; or, (c) the firm does not have consolidated
financial statements. This resulted in the elimination of 37 firms, leading to a final
sample of 188, 51 Portuguese and 137 Spanish. Noteworthy is also the fact that some
firms do not have information for all the years from 2005 to 2009, either because (i) the
firm only came into existence after 2005; (ii) the firm did not publish its 2009 Financial
11
there was no information available for a given year.4 This led to a total of 828
observations, 226 concerning Portuguese firms and 602 concerning Spanish firms.
In order to remove any outliers in the sample I used a relatively common
process, which is to remove all observations that are not in the interval constructed by
the mean plus or minus three times the standard deviation. This results in the extraction
of 14 observations which were considered outliers.
All the necessary accounting data was extracted from the firms’ financial
statements, hand-collected from the firms’ websites or the corresponding regulatory
body (CNMV in Spain and CMVM in Portugal). Share prices were extracted from
Bloomberg.
Empirical Model
My goal is to discover if revaluations are value relevant to investors where value
relevance refers to “a predicted association with equity market values” (Barth et al., 2001). I use share price at the end of the fiscal year as a measure of relevant information
to investors much like the researchers mentioned throughout my work project and
because it has been shown by Sharpe and Walker (1975) that “announcements of asset revaluations were associated with substantial upward movements in stock prices, and
that these shifts in stock prices were generally sustained in the post-announcement
months”, that the market “digests this new information quickly” and, finally, that the movement in stock prices could not be entirely explained by earnings, dividend changes
or induced changes in volatility. These conclusions are supported by other studies such
12
as the ones performed by Standish and Ung (1982) and Emanuel (1989). I chose the end
of the fiscal year instead of three months after because the values for the remaining
variables were taken from firms’ annual reports at the end of the year and, therefore, share prices at the end of the fiscal year should reflect all that information (Barth and
Clinch, 1999).
Following the theoretical model developed by Ohlson (1995), I estimate a cross
sectional equation that relates revaluations to the share price at the end of the fiscal
year: it it it it it EqPS vPS EPS P 0 1 2Re 3 (1)
where P is share price at the end of the fiscal year of firm i at year t. EqPS is the book
value of equity less the value of revaluation, RevPS is the value of revaluation and EPS
is earnings, all these variables are per share. 0anditare included to capture the part of share price that is not explained by the dependent variables. This means that my main
goal is to estimate the impact of revaluations on prices while EqPS and EPS are held
fixed. I predict that the coefficients of EqPS and EPS in (1) are positive and statistically
significant or, in other words, I predict that both variables are value relevant to investors
while the coefficient of RevPS is statistically significant but I cannot be sure if it is
positive or negative. This is uncertain because I would expect this coefficient to be
positive (Sharpe and Walker, 1975) but there are some firms which are cross-listed,
especially in Spain, and according to Barth and Clinch (1996) this leads to a negative
coefficient. I use Wald tests to test for coefficient equality between the coefficients for
EqPS and EPS in (1) in order to guarantee that these variables do not explain the same
13
This first analysis estimates the impact of revaluations on share prices in
Portugal and Spain together, however, since they are different countries it is important
to also estimate the impact of revaluations on share prices in Portugal and Spain
separately. In order to do this I run equation (1) once again but only for the observations
concerning Portugal and, afterwards, using only observations concerning Spain. I
predict that the coefficients concerning the Portuguese EqPS, RevPS and EPS are
positive and statistically significant and that the coefficients concerning the Spanish
EqPS and EPS are statistically significant and positive and that the coefficient
concerning RevPS is statistically significant but negative because in Spain there are four
stock exchanges (Madrid, Barcelona, Valencia and Bilbao) and there are a lot of firms
which are listed in more than one of these stock exchange or in other words, there are
several firms which are cross-listed and, according to Barth and Clinch (1996), when
there is cross-listing the coefficient concerning revaluations is negative. Once again I
use Wald tests to test for coefficient equality between the coefficients for EqPS and EPS
in Portugal and in Spain in order to guarantee that these variables do not explain the
same thing in each model.
I will also perform a White test on all these models in order to assess if the
residual variance of the variables in the regression models are constant
(homoscedasticity) or not (heteroscedasticity). I believe it is important to mention that
the presence of heteroscedasticity may result in the underestimation of the variance of
the coefficients which can lead to the conclusion that a coefficient is statistically
different from zero and therefore that the variable is statistically significant when in fact
it is not. In order to prevent this I will use White’s Heteroscedasticity-Consistent Standard Errors if the White test proves that there is heteroscedasticity in the models.
14 Descriptive Statistics
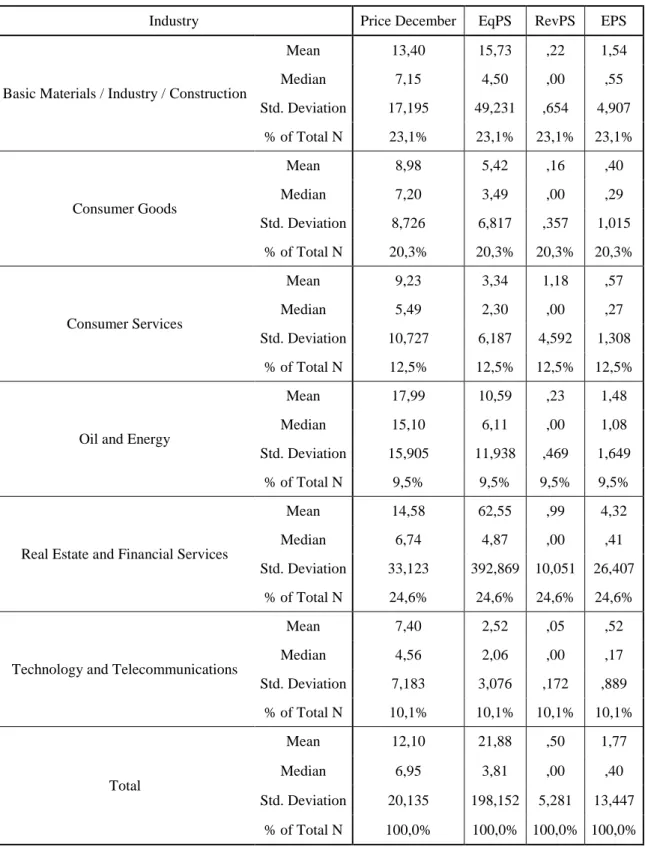
Table 1 presents descriptive statistics for the regression variables, both broken
down by industry and aggregate. We can see that there is no clear dominance from any
industry despite the fact that the Real Estate and Financial Services and the Basic
Material / Industry / Construction industries have a higher representation and make up
for almost half of the total sample, and that Oil and Energy and Technology and
Telecommunications clearly have a lower representation in the sample and, together,
represent only around 20% of the total number of observations.
It is important to mention that this industry classification is the one used by the
Madrid Stock Exchange. Portugal and Spain have slightly different industry
classifications. However, since Spain represents the majority of the observations, I
decided to use the classification put forth by the biggest stock exchange in Spain which
is the Bolsa de Madrid. The firms included in this stock exchange alone represent the
majority of the sample.
The table shows that the mean (median) price is €12,10 (€6,05) but that, if we look at the mean (median) price of each industry, we can see that it spans from a low of
€7,40 (€4,56) in the Technology and Telecommunications industry to a high of €17,99 (€15,10) in the Oil and Energy industry. We can also see that the mean RevPS is €0,50 although, when we look at it by industry, we realize that it spans from a low of almost
zero (€0,05 in the Technology and Telecommunications industry) and a high of €1,18 in the Consumer Services industry. This mean represents 2,3% of the mean of the book
value of equity per share excluding the revaluations per share. The median RevPS is
15
made visible is that the mean (median) EqPS is €21,88 (€3,81) and that the mean
(median) EPS is €1,77 (€0,40).
Table 1 – Descriptive Statistics for Dependent and Independent Variables
Industry Price December EqPS RevPS EPS
Basic Materials / Industry / Construction
Mean 13,40 15,73 ,22 1,54 Median 7,15 4,50 ,00 ,55 Std. Deviation 17,195 49,231 ,654 4,907 % of Total N 23,1% 23,1% 23,1% 23,1% Consumer Goods Mean 8,98 5,42 ,16 ,40 Median 7,20 3,49 ,00 ,29 Std. Deviation 8,726 6,817 ,357 1,015 % of Total N 20,3% 20,3% 20,3% 20,3% Consumer Services Mean 9,23 3,34 1,18 ,57 Median 5,49 2,30 ,00 ,27 Std. Deviation 10,727 6,187 4,592 1,308 % of Total N 12,5% 12,5% 12,5% 12,5%
Oil and Energy
Mean 17,99 10,59 ,23 1,48 Median 15,10 6,11 ,00 1,08 Std. Deviation 15,905 11,938 ,469 1,649
% of Total N 9,5% 9,5% 9,5% 9,5%
Real Estate and Financial Services
Mean 14,58 62,55 ,99 4,32 Median 6,74 4,87 ,00 ,41 Std. Deviation 33,123 392,869 10,051 26,407
% of Total N 24,6% 24,6% 24,6% 24,6%
Technology and Telecommunications
Mean 7,40 2,52 ,05 ,52 Median 4,56 2,06 ,00 ,17 Std. Deviation 7,183 3,076 ,172 ,889 % of Total N 10,1% 10,1% 10,1% 10,1% Total Mean 12,10 21,88 ,50 1,77 Median 6,95 3,81 ,00 ,40 Std. Deviation 20,135 198,152 5,281 13,447 % of Total N 100,0% 100,0% 100,0% 100,0%
16 Regression Results
Value Relevance of Revaluations in Portugal and Spain
Table 2 presents summary statistics from estimating equation (1), which relates
gains from revaluations with share prices, for both Portugal and Spain. As predicted,
revaluations are statistically significant when we control for earnings and book value of
equity (t-statistic = -19,050).5 I could not predict whether revaluations were positively or
negatively related with share prices, since there are several firms which are cross-listed.
If we look at Table 2 we can see that revaluations are actually negatively related with
share prices at the end of the fiscal year. I believe this to be the result of cross-listing, as
some of the firms in the sample are listed in more than one stock exchange, which is in
accordance with prior research. Also, as expected, the book value of equity and earnings
are positively related with share prices and are statistically significant (t-statistics =
7,408 and 4,419).6
In Table 2 there is also a coefficient equality test, or Wald test, which tests for
the equality between the coefficients concerning the book value of equity and earnings.
Since the p-value of this test is below 1% I reject the null hypothesis that these
coefficients are equal and, therefore, I conclude that investors distinguish between the
book value of equity and earnings. This result was expected but it is still important to
make sure that revaluations are not distorting investor expectations.
Table 2 also has a heteroscedasticity test, more specifically, a White test in order
to check if the residual variance of the variables is constant or not. Since the p-values of
5
In this case and henceforth book value of equity corresponds to the book value of equity less the value of revaluations.
6 Appendix 1 presents summary statistics for the same regression using March share prices instead of December share prices and it supports these findings.
17
this test are below 1% I reject the null hypothesis that the residual variance is constant
and therefore I run equation (1) again using Heteroscedasticity-Consistent Standard
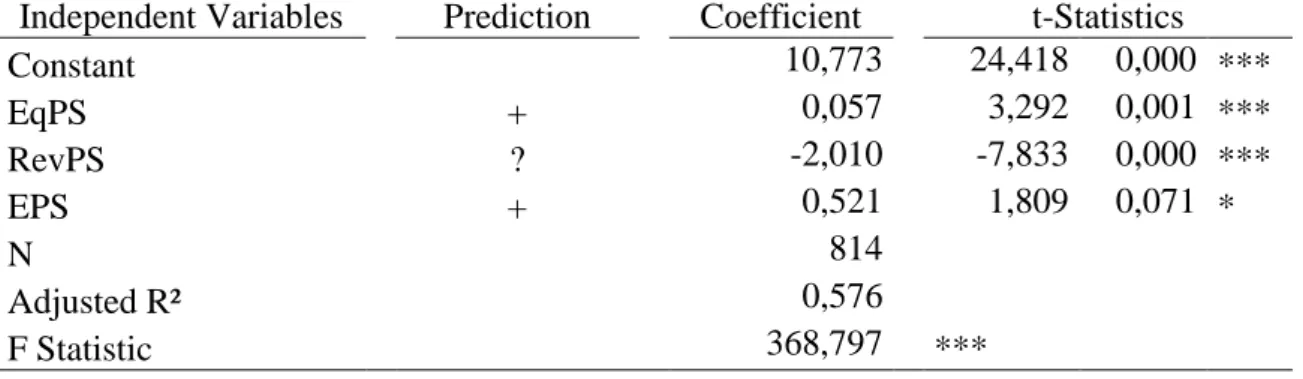
Errors (HCSE) and the results can be seen in Table 3. This table shows that all the
variables are still statistically significant although EPS is only significant at a 10% level
while RevPS and EqPS are statistically significant at a 1% level.
Table 2 – Regression Results for Portugal and Spain
Independent Variables Prediction Coefficient t-Statistics
Constant 10,773 23,658 0,000 *** EqPS + 0,057 7,408 0,000 *** RevPS ? -2,010 -19,050 0,000 *** EPS + 0,521 4,419 0,000 *** N 814 Adjusted R² 0,576 F Statistic 368,797 ***
Coefficient Equality Test Results (Wald Test)
Restriction Chi-Square Statistics
13,721 0,000 ***
Heteroscedasticity Test Results (White Test)
F-statistic 17,234 Prob. F(9,804) 0,000 *** Obs*R-squared 131,638 Prob. Chi-Square(9) 0,000 *** Scaled explained SS 677,022 Prob. Chi-Square(9) 0,000 ***
*** Significant at a 0,01 level.
** Significant at a 0,05 level.
*Significant at a 0,10 level.
Notes: P is share price on December 31st. EqPS is equity less revaluations, per share.
RevPS is the gains from revaluations per share. EPS is earnings per share.
3
1
18 Table 3 – Regression Results for Portugal and Spain using White’s HCSE
Independent Variables Prediction Coefficient t-Statistics
Constant 10,773 24,418 0,000 *** EqPS + 0,057 3,292 0,001 *** RevPS ? -2,010 -7,833 0,000 *** EPS + 0,521 1,809 0,071 * N 814 Adjusted R² 0,576 F Statistic 368,797 *** *** Significant at a 0,01 level. ** Significant at a 0,05 level. *Significant at a 0,10 level.
Notes: P is share price on December 31st. EqPS is equity less revaluations, per share.
RevPS is the gains from revaluations per share. EPS is earnings per share.
Value Relevance of Revaluations in Portugal
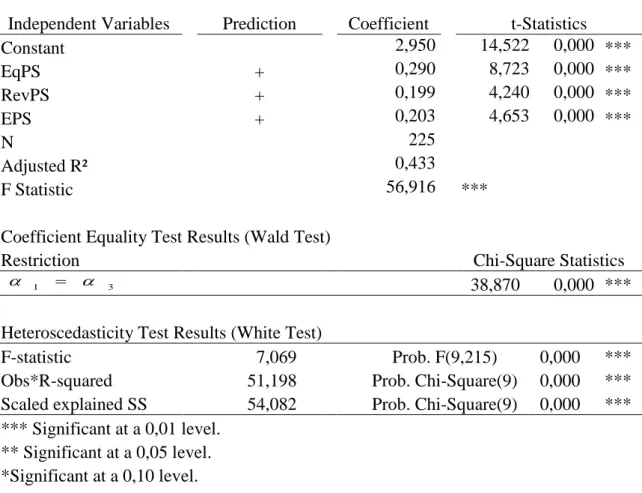
Table 4 presents summary statistics from estimating equation (1) for Portugal.
As predicted, revaluations are statistically significant and positively related with price
when we control for earnings and book value of equity (t-statistic = 4,240). Also, as
expected, the book value of equity and earnings are positively related with share prices
and are statistically significant (t-statistics = 8,723 and 4,653).
In Table 4 there is also a coefficient equality test, or Wald test, which tests for
the equality between the coefficients concerning to the book value of equity and
earnings. Since the p-value of this test is below 1% I reject the null hypothesis that these
coefficients are equal and, therefore, I conclude that investors distinguish between the
book value of equity and earnings. This result was expected but it is still important to
19
Table 4 also has a heteroscedasticity test, more specifically, a White test in order
to check if the residual variance of the variables is constant or not. Since the p-values of
this test are below 1% I reject the null hypothesis that the residual variance is constant
and therefore I run equation (1) again using Heteroscedasticity-Consistent Standard
Errors (HCSE) and the results can be seen in Table 5. This table shows that all the
variables are still statistically significant at a 1% significance level.
Table 4 – Regression Results for Portugal
Independent Variables Prediction Coefficient t-Statistics
Constant 2,950 14,522 0,000 *** EqPS + 0,290 8,723 0,000 *** RevPS + 0,199 4,240 0,000 *** EPS + 0,203 4,653 0,000 *** N 225 Adjusted R² 0,433 F Statistic 56,916 ***
Coefficient Equality Test Results (Wald Test)
Restriction Chi-Square Statistics
38,870 0,000 ***
Heteroscedasticity Test Results (White Test)
F-statistic 7,069 Prob. F(9,215) 0,000 *** Obs*R-squared 51,198 Prob. Chi-Square(9) 0,000 *** Scaled explained SS 54,082 Prob. Chi-Square(9) 0,000 ***
*** Significant at a 0,01 level.
** Significant at a 0,05 level.
*Significant at a 0,10 level.
Notes: P is share price on December 31st. EqPS is equity less revaluations, per share.
RevPS is the gains from revaluations per share. EPS is earnings per share.
3
1
20 Table 5 – Regression Results for Portugal using White’s HCSE
Independent Variables Prediction Coefficient t-Statistics
Constant 2,950 13,324 0,000 *** EqPS + 0,290 4,172 0,000 *** RevPS + 0,199 5,479 0,000 *** EPS + 0,203 3,093 0,002 *** N 225 Adjusted R² 0,433 F Statistic 56,916 *** *** Significant at a 0,01 level. ** Significant at a 0,05 level. *Significant at a 0,10 level.
Notes: P is share price on December 31st. EqPS is equity less revaluations, per share.
RevPS is the gains from revaluations per share. EPS is earnings per share.
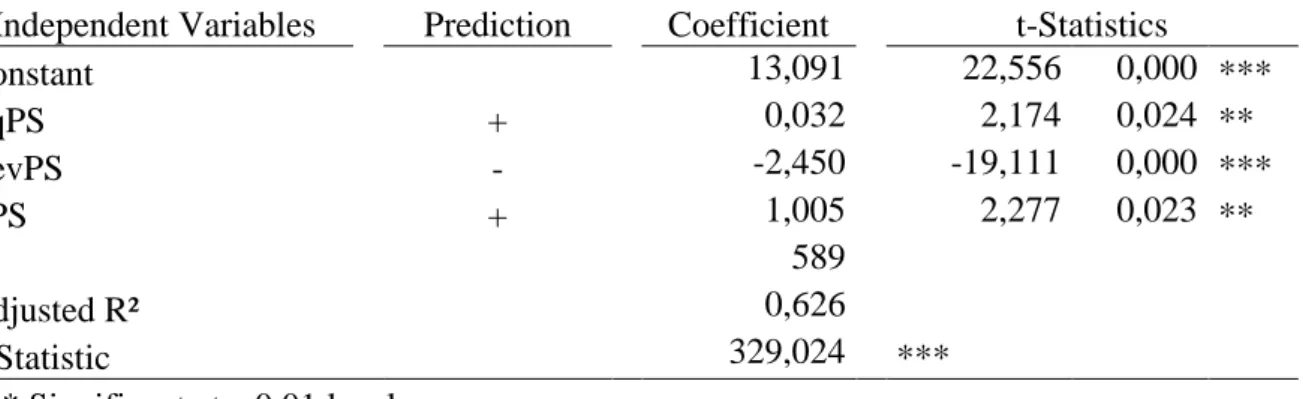
Value Relevance of Revaluations in Spain
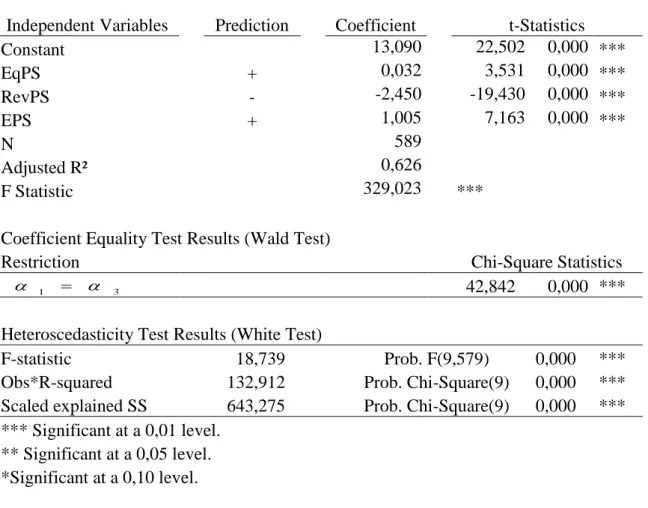
Table 6 presents summary statistics from estimating equation (1) for Spain. As
predicted, revaluations are statistically significant when we control for earnings and
book value of equity (t-statistic = -19,430). I predicted that revaluations were negatively
related with share prices, since there are several Spanish firms which are cross-listed
and Table 4 confirms that prediction. Also, as expected, the book value of equity and
earnings are positively related with share prices and are statistically significant
(t-statistics = 3,531 and 7,163).
In Table 6 there is also a coefficient equality test, or Wald test, which tests for
the equality between the coefficients concerning to the book value of equity and
earnings. Since the p-value of this test is below 1% I reject the null hypothesis that these
21
book value of equity and earnings. This result was expected but it is still important to
make sure that revaluations are not distorting investor expectations.
Table 6 – Regression Results for Spain
Independent Variables Prediction Coefficient t-Statistics
Constant 13,090 22,502 0,000 *** EqPS + 0,032 3,531 0,000 *** RevPS - -2,450 -19,430 0,000 *** EPS + 1,005 7,163 0,000 *** N 589 Adjusted R² 0,626 F Statistic 329,023 *** Coefficient Equality Test Results (Wald Test)
Restriction Chi-Square Statistics
42,842 0,000 ***
Heteroscedasticity Test Results (White Test)
F-statistic 18,739 Prob. F(9,579) 0,000 ***
Obs*R-squared 132,912 Prob. Chi-Square(9) 0,000 *** Scaled explained SS 643,275 Prob. Chi-Square(9) 0,000 *** *** Significant at a 0,01 level.
** Significant at a 0,05 level. *Significant at a 0,10 level.
Notes: P is share price on December 31st. EqPS is equity less revaluations, per share.
RevPS is the gains from revaluations per share. EPS is earnings per share.
Table 6 also has a heteroscedasticity test, more specifically, a White test in order
to check if the residual variance of the variables is constant or not. Since the p-values of
this test are below 1% I reject the null hypothesis that the residual variance is constant
and therefore I run equation (1) again using Heteroscedasticity-Consistent Standard
Errors (HCSE) and the results can be seen in Table 7. This table shows that all the
3
1
22
variables are still statistically significant although EqPS and EPS are only significant at
a 5% significance level.
Table 7 – Regression Results for Spain using White’s HCSE
Independent Variables Prediction Coefficient t-Statistics
Constant 13,091 22,556 0,000 *** EqPS + 0,032 2,174 0,024 ** RevPS - -2,450 -19,111 0,000 *** EPS + 1,005 2,277 0,023 ** N 589 Adjusted R² 0,626 F Statistic 329,024 *** *** Significant at a 0,01 level. ** Significant at a 0,05 level. *Significant at a 0,10 level.
Notes: P is share price on December 31st. EqPS is equity less revaluations, per share.
RevPS is the gains from revaluations per share. EPS is earnings per share.
Additional Analysis
According to Easton et al. (1993), there are two main reasons for the incidence
of revaluations: the need or desire to present a “true and fair view” of a firm’s financial statements or to lower debt-to-equity ratios. Revaluations can be seen as opportunistic if
a company has a high level of debt when compared to its equity because an upward
revaluation leads to the creation of a revaluation reserve which increases the level of
equity and, as a consequence, decreases the debt-to-equity ratio. Lower debt-to-equity
ratios are important because they “loosen debt constraints and enhance financial
flexibility” (Easton et al., 1993). According to Aboody et al. (1999), “revaluations associated with debt-to-equity ratio motivations are less likely to reflect future
23
This leads me to predict that the coefficient of revaluations related to the level of debt is
negative in order to reflect the lower value relevance of revaluations in firms with high
levels of debt.
In order to assess the relationship between the gains from revaluations and share
prices while considering debt-to-equity ratios, I insert an interaction term in (1) which
consists of the interaction between gains from revaluations and debt-to-equity ratios
(RevPSxDE). The debt-to-equity ratio is formed by dividing total liabilities by equity
less the revaluation balance (Aboody et al., 1999). Like in the previous analysis, I
predict that the coefficients concerning EqPS and EPS are statistically significant and
positive, the coefficient concerning RevPS is still undetermined for the same reasons as
in previous analysis and, finally, I predict that the coefficient concerning the new
interaction term, RevPSxDE, is negative. However, share prices may not always benefit
from the decrease in debt constraints which are not directly related with the association
between revaluations and future performance, therefore, Aboody et al. (1999) did not
predict the sign for the coefficient of the new variable.
it it it it it EqPS vPS EPS vPS DE P 0 1 2Re 3 4Re (2) The results for equation (2) are in table 8. As predicted, revaluations are still
relevant (t-statistics = -8,356) but the coefficient is lower (in absolute terms), also, like
in the initial analysis, revaluations are negatively related with share prices and, like
before, this is due to the effect of cross-listing. As expected, earnings and the book
value of equity are significant and positively related with share price (t-statistics = 4,833
and 7,415). Finally, the interaction term between revaluations and debt-to-equity ratios
24
predicted. I also performed Wald tests to assess whether the coefficients concerning
EqPS and EPS are identical and for RevPS and RevPSxDE as well and in both cases the
null hypothesis that these coefficients are identical is rejected.
Table 8 – Regression Results for Portugal and Spain with the coefficients for revaluation variables to differ depending on the debt-to-equity ratio
Independent Variables Prediction Coefficient t-Statistics
Constant 10,647 23,693 0,000 *** EqPS + 0,057 7,415 0,000 *** RevPS ? -1,371 -8,356 0,000 *** EPS + 0,563 4,833 0,000 *** RevPSxDE - -0,039 -5,036 0,000 *** N 814 Adjusted R² 0,588 F Statistic 291,259 ***
Coefficient Equality Test Results (Wald Test)
Restriction Chi-Square Statistics
16,771 0,000 *** 61,247 0,000 *** *** Significant at a 0,01 level. ** Significant at a 0,05 level. *Significant at a 0,10 level.
Notes: P is share price on December 31st. EqPS is equity less revaluations, per share.
RevPS is the gains from revaluations per share. EPS is earnings per share. RevPSxDE is
an interaction term between RevPS and DE which is the debt-to-equity ratio where equity is EqPS.
Conclusions
In this work project I test whether the gains from revaluations of tangible fixed
assets in Portugal and Spain are value relevant to investors. Prior research focuses on
the relation between asset revaluations and share prices and returns and, for the most
part, it finds that asset revaluations are value relevant. Also, prior research focuses
3 1 4 2
25
mainly on firms in the UK and Australia. I consider share prices as a good measure of
assessment of asset values and as a good summary measure of relevant information for
investors.
Initially, I find that gains from revaluations in Portugal and Spain are
significantly negatively related with share prices. In my initial equation I control for the
book value of equity and for earnings. My findings provide strong evidence that gains
from revaluations are relevant to investors.
However, as I develop my model, I find that, in truth, revaluations are only
negatively related with share prices in Spain. In Portugal, revaluations are actually
positively related with share prices which is what would be considered more common.
However, and according to previous research, the fact that there is cross-listing in Spain
may be the reason for this negative correlation.
Additionally, I further develop the initial model by adding an interaction term
which allows me to test if the debt level of a firm, using debt-to-equity ratios, has an
impact on the relevance of revaluations. Revaluations have a lower relevance in firms
with a high level of debt, or a high debt-to-equity ratio which suggests that there is an
opportunistic motivation behind these revaluations.
My work project provides input to the debate on the recognition of non financial
assets and, in this case, tangible fixed assets, at fair value rather than at historical cost.
The fact that it has consistently been found that fair value revaluations are statistically
significant suggests that fair value is a reliable method of valuation and that tangible
26 Bibliographic References
Aboody, David; Barth, Mary; Kaznick, Ron. 1999. “Revaluations of Fixed Assets and Future Firm Performance: Evidence from the UK.” Journal of Accounting and
Economics, Vol. 26: pp. 149-178.
Barth, Mary; Beaver, William; Landsman, Wayne. 2001. “The Relevance of the Value Relevance Literature for Financial Accounting Standard Settings: Another View.”
Journal of Accounting and Economics, Vol. 31: pp. 77-104.
Barth, Mary; Clinch, Greg. 1996. “International Accounting Differences and their
Relation to Share Prices: Evidence from U.K. Australian, and Canadian Firms.”
Contemporary Accounting Research 13: pp. 135-170.
Barth, Mary; Clinch, Greg. 1998. “Revalued Financial, Tangible, and Intangible Assets: Associations with Share Prices and Non-Market-Based Value Estimates.” Journal of
Accounting Research, Vol. 36.
Easton, Peter; Eddey, Peter; Harris, Trevor. 1993. “An Investigation of Revaluations of Tangible Long-Lived Assets.” Journal of Accounting Research, Vol. 31.
Emanuel, D. M. 1989. “Asset Revaluations and Share Price Revisions.” Journal of
Business Finance and Accounting, 16 (2).
Herrmann, Don; Saudagaran, Shahrokh; Thomas, Wayne. 2006. “The Quality of Fair
Value Measures for Property, Plant, and Equipment.” Accounting Forum 30: pp 43-59. IASB. 2003. “Property, Plant and Equipment.” International Accounting Standard 16. London.
27
Ohlson, James. 1995. “Earnings, Book Values, and Dividends in Equity Valuation.”
Contemporary Accounting Research: pp 661-687.
Sharpe, I. G.; Walker, R. G. 1975. “Asset Revaluations and Stock Market Prices.”
Journal of Accounting Research, Vol. 13, No. 2, pp: 293-310.
Standish, Peter; Ung, Swee-Im. 1982. “Corporate Signalling, Asset Revaluations and
the Stock Prices of British Companies.” The Accounting Review, Vol. 57, No. 4, pp: 701-715.
28 Appendix
Appendix 1 – Regression Results for Portugal and Spain using March share prices
Independent Variables Prediction Coefficient t-Statistics
Constant 10,389 21,451 0,000 *** EqPS + 0,310 2,309 0,021 ** RevPS ? -0,711 -3,995 0,000 *** EPS + 0,899 6,324 0,000 *** N 676 Adjusted R² 0,077 F Statistic 19,850 ***
Coefficient Equality Test Results (Wald Test)
Restriction Chi-Square Statistics
36,973 0,000 ***
*** Significant at a 0,01 level.
** Significant at a 0,05 level.
*Significant at a 0,10 level.
Notes: P is share price on March 31st. EqPS is equity less revaluations, per share. RevPS is the gains from revaluations per share. EPS is earnings per share.
3
1