A Work Project, presented as part of the requirements for the Award of a Master’s Degree in Finance from the Nova School of Business and Economics.
THE RISK PREMIUM OF PRIVATE EQUITY – A GEOGRAPHICAL COMPARISON
PEPE JURKLIES
MASTER STUDENT NUMBER: 33874
Work project carried out under the supervision of: Professor Gonçalo Sommer Ribeiro
1 Abstract
This thesis demonstrates empirical evidence for performance determinants of private equity funds with investments in the United States, Canada, Japan, United Kingdom, France and Germany using a comprehensive database with information on private equity performances. The analysis provides findings on determinants and their impact on private equity fund performances. The results indicate a positive impact of public stock market index excess returns and show empirical evidence of a negative impact of rising interest rates on fund performances due to a substitution effect for other investment opportunities and a higher cost of leverage.
Keywords
Private Equity, Fund Performance, Alternative Investments, Risk Premium
Acknowledgement
I would like to express my gratitude to the operators of the database preqin.com without whose help the empirical analysis would hardly have been possible. The provision of access helped to analyze fund performances as well as their characteristics. Also, I would like to thank my academic and professional supervisors both, for their guidance and recommendations regarding the depth and direction of my analysis.
This work used infrastructure and resources funded by Fundação para a Ciência e a Tecnologia (UID/ECO/00124/2013, UID/ECO/00124/ 2019 and Social Sciences DataLab, Project 22209), POR Lisboa (LISBOA-01-0145-FEDER-007722 and Social Sciences DataLab, Project 22209) and POR Norte (Social Sciences DataLab, Project 22209).
2 1. Introduction
In current times of low interest rates in many, economically strong countries and prolonged peaks in economic business cycles, private equity funds are receiving a high amount of interest from many different parties (Harris, Jenkinson and Kaplan, 2014). Investors are diversifying their portfolios and looking for investment opportunities where moderate returns can still be achieved and consider alternative asset classes to be a suitable fit. Private equity funds use the opportunity to work with high amounts of committable capital and favorable debt market conditions to conduct leveraged buyout transactions (Driessen, Lin and Phalippou, 2007). Since stakes in those funds cannot be publicly traded and secondary markets are not efficient, performances of private equity fund investments are rather difficult to observe. Private equity funds are also receiving more attention in the literature, firstly because a tremendous amount of capital is invested in this asset class (Kaplan and Schoar, 2005), USD 582bn in 2018 for buyout transactions, which makes up approximately 17% of the global buyout value in total mergers and acquisitions (Bain, 2019). Secondly, because it is argued that fund managers controlling this amount of capital play an essential strategic role in the economy (Gottschalg, Phalippou and Zollo, 2003). The purpose of this thesis is to provide an empirical evaluation of factors that affect the performance of private equity funds in order to better understand the risk profile of this asset class and additionally highlight geographical differences.
This paper proceeds by discussing the theoretical background of private equity performance and its determinants in chapter 2. Subsequently, the next chapter demonstrates the literature foundations of hypotheses and then the respective hypotheses are formulated. Chapter 4 provides information on the underlying dataset and the respective application methodology for an empirical analysis including results. The last chapter deals with the classification of these results and pointing to potential limitations with the following recommendation for further research.
3 2. Theoretical Background
2.1 Private Equity Fund Performance
Investments in private equity funds are closed-ended investments that have an expected lifetime of approximately ten years during which the investments are locked in the fund (Kaplan and Strömberg, 2008). Before private equity funds can invest money from investors, there is a fund-raising time which usually takes up to one or two years until a first and a final closing date is set. From the first closing date onwards, the money can be invested, and the respective year is called vintage or inception year. Investors can do further commitments until the final closing date of the fund. The illiquidity of the investments caused by the long duration of a fund’s lifetime accounts for the key challenge to objectively value a fund’s performance (Higson and Stucke, 2012). The organizational form of private equity funds is exempted from public disclosure statements and ongoing performance measurements during a fund’s lifetime have to be assessed in alternative ways (Kaplan and Sensoy, 2014). A private equity fund’s lifetime is divided into two phases, the investment phase and the distribution phase, whereby it should be noted that these may overlap. Investors have outgoing cash flows during the investment phase to provide capital for company acquisitions and to compensate for the management fees of the fund (Kaplan and Strömberg, 2008). In the distribution phase, investors receive cash flows from the proceeds of the sale of respective companies net of carried interest.
In order to generate a positive return for investors after fees, private equity funds use various methods to generate added value within the portfolio company. For example, a high portion of leverage is used to finance the purchase, which is cheaper than financing the purchase with expensive equity. The resulting liabilities are largely paid off over the holding period through profits generated by the company itself. This allows a conversion from lower-cost debt to high-value equity until the sale of the company takes place. Since the common valuation method for the purchase and sale of companies is the multiple method based on earnings before interests,
4
taxes, depreciation and amortization ‘EBITDA’ across the private equity industry, another approach to creating value is financial engineering. In the case of financial engineering, existing processes are optimized in terms of efficiency and cost-saving procedures. In addition, growth opportunities are exploited in different dimensions, for example, geographically, with respect to the product portfolio and sales channels and other possibilities in order to generate more EBITDA. A third way to create profits for investors is to make use of the multiple growth with regards to the previously mentioned multiple valuation method. This is possible, for example, through the timing of the purchase and sale within economic cycles and the valuation environment that corresponds to those cycles. The multiple can also increase through further acquisitions of add-on companies, whereby the portfolio company grows inorganically as a platform. As a result, it can become more significant in the market or even a market leader and thus receives a higher valuation. Most private equity funds make use of many of these methods simultaneously in an attempt to achieve the best possible return for the fund and their investors. The net return for investors in private equity funds can therefore be determined on the basis of outgoing cash flows, distributed cash flows and the residual value of the fund (Driessen, Lin and Phalippou 2012). In order to assess the anticipatory value of a fund, the residual value has to be estimated, which is commonly determined by the net asset value ‘NAV’ (Kaplan and Sensoy, 2014). The NAV is a fair value valuation of existing investments in the fund conducted by the respective fund management team. Therefore, a commonly used performance measurement ratio is the total value to paid-in capital ‘TVPI’, also known as ‘money multiple’ (Kaplan and Sensoy, 2014). TVPI is the sum of all distributions as a ratio of distribution to paid-in capital ‘DPI’ and the residual value to paid-in capital ‘RVPI’, which can be illustrated as follows:
𝑇𝑉𝑃𝐼 =∑𝑡<𝑇𝑡=1𝐶𝐹𝑡𝑅+𝑁𝐴𝑉𝑇
5
To account for the time value of the distribution cash flows, the RVPI is considered as terminal cash flow at the maturity of the fund and thus, an internal rate of return ‘IRR’ can be calculated. The IRR is the most frequently used performance indicator in private equity and is the most important measurement in performance reports when private equity companies show their track record in order to conduct a new fund raising (Ick, 2005). The internal rate of return is the discount rate at which the net present value ‘NPV’ of multiple cash flows over time becomes equal to zero (Phalippou, 2008). The literature repeatedly points out that the IRR measurement method entails various pitfalls and shortcomings by making assumptions that cannot be realistically implemented. For instance, the re-investment assumption of intermediary distributions (Ick, 2005) and issues comparing an IRR of aggregated cash flows to an average IRR of multiple cash flows (Phalippou, 2008) are predominantly challenging in reality. However, it is the common practice and for example, the European Private Equity and Venture Capital Association as well as the British Private Equity and Venture Capital Association set the IRR as the standard performance measurement in their guidelines (EVCA, 2006 and BVCA, 2010). Thus, this method will be used net of fees within the extent of this paper to determine performance measurement for investors in private equity funds. In order to provide consistency across different countries, the term net of fees includes ongoing management fees and performance fees considered as carried interests but does not take into account taxes. Taxes do not depend on the performance or cost structure of funds but is rather dependent on the origin of the investors.
2.2 Determinants of Private Equity Fund Performance
Given the growing size of investments in the private equity asset class, there is an increasing interest in the literature to determine factors that drive the returns of those funds. For instance, macroeconomic relationships were examined, and it was found that private equity fund performance turned out to behave significantly pro-cyclical (Kaplan and Stromberg, 2009). The
6
performance is mostly generated during times of high public stock-market returns (Gompers, Lerner, Kovner and Scharfstein, 2008) and low bond yields (Phalippou and Zollo, 2005). Gottschalg, Phalippou, and Zollo (2003) study the relationship between private equity fund returns and market returns under the assumption of CAPM. They find positive betas, but find the performance not to behave linearly to those betas. When using IRR as performance measurement and creating market equivalent IRRs, a statistically significant positive relationship could be established, which implies that systematic risk of underlying investments influences returns. Public stock-market developments substantially influence fund performance regardless of when considering the index performance (Phalippou and Zollo, 2005).
Debt market conditions strongly relate to the amount of leverage that can be used for buyout transactions, which impacts private equity fund performances as those use this leverage to generate returns (Kaplan and Strömberg, 2008). An increasing level of interest rates, especially credit spreads and corporate bond yields, has a negative impact on fund performances according to research conducted by Phalippou and Zollo in 2005. Credit spreads between corporate bonds and long-term government bonds indicate the default probability and expected recovery in case of an economic downturn, which is both relevant for leverage costs in buyout transactions. Thus, this indicator captures aspects of business cycles relevant for private equity fund performance (Phalippou and Zollo, 2005). According to Ljungqvist, Richardson and Wofenzon (2007) low interest rates cause private equity funds to increase their investment pace and use this situation for higher leverage in transactions.
Another important characteristic for performance is considered to be the size of the fund, where an increasing and concave relationship was discovered (Gottschalg, Phalippou, Zollo, 2003). This relationship implies better returns for larger funds subject to a limitation. The increase in fund size does not increase the return proportionally, but the improvement in performance slows down as the fund size increase becomes larger, until this effect is only marginal. This is
7
explained by the pressure of not finding enough good investments to generate higher returns when fund sizes become too large. In 2005, research by Phalippou and Zollo has not confirmed a concave relationship, but also found small funds to have significantly lower performance. The fund size is also considered to be a main driver of performance by Kaplan and Schoar (2005). Higson and Stucke (2012) found a positive relationship for larger funds to generate higher outperformance relative to public equity compared to smaller funds.
A further element that has an impact on performance is the experience and skill of fund managers. Early research from 1999 by Gompers and Lerner finds the fund sequence number to have an impact on fund performance, which was later confirmed by Kaplan and Schoar (2005). The fund sequence number indicates how many funds were initiated by the private equity company and thus implies the number of funds previously and currently managed. According to research from Gottschalg, Phalippou and Zollo in 2003, first-time and second-time funds are outperformed by more experienced funds. In line with previous research, Phalippou and Zollo (2005) find an important positive effect of fund family experience and fund performance. It was also identified that skilled private equity firms outperform others when funds with long-term return persistence and long-lasting partnerships with limited partners were examined (Korteweg and Sorensen, 2013).
3. Hypothesis Development
Based on the established relevance of the various variables for private equity fund performance in above-mentioned research papers, this chapter deals with the development of our own hypotheses about how those variables have an impact on the performance, which then have to be tested. Furthermore, those variables will be tested within and across different countries to test for geographic differences.
8
3.1.1 Geographic Differences across all variables
Private Equity funds can operate very similarly in their methods of creating value across different countries. Moreover, many funds invest internationally or globally and therefore react similarly to shocks in different countries. The following hypothesis is formulated based on this concept:
H1: A consistent effect is to be expected across all geographical regions with regard to the individual identified variables, although these might differ in their magnitude
3.1.2 Risk-Free Rate
After Phalippou and Zollo (2005) linked rising bond yields with rising cost of debt in leverage buyout transactions and subsequently Kaplan and Strömberg (2008) found that leverage in private equity transactions is decreasing due to higher costs in a rising interest rate environment, the following hypothesis is formed:
H2: Rising interest rates have a strong negative impact on the performance of private equity funds due to a substitution effect of assets with a lower risk profile while offering an attractive yield and due to rising cost of leverage for existing and new debt
3.1.3 Market Risk
Kaplan and Sensoy (2014) state that based on their evidence the private equity performance is linked to public equity performances and shocks affect both asset classes in similar ways. Jones and Rhodes-Kropf (2003) found a beta for private equity funds with a buyout strategy focus of 0.65. When analyzing European private equity funds, Kaserer and Diller (2004) find a correlation of 0.8 to the MSCI Europe. Research by Gottschalg, Phalippou and Zollo (2003) derives to CAPM-betas of 1.7 using public market indices returns. Later, the empirical model of Ang, Chen, Goetzmann and Phalippou (2013) concluded a beta on public stock markets of
9
1.4 for private equity funds. Based on the latest findings in previous research, the following hypothesis is formulated:
H3: Increasing public stock market index excess returns have a positive impact on private equity fund performances
3.1.4 Fund Series
The number of fund series implicates how many funds have already and currently are managed by the same fund management company. Thus, this number indirectly reveals information on how often deal selection, company purchases, value creation process implications, and deal exits have been experienced by the management team. Per Korteweg and Sorensen (2013) private equity funds with experience outperform other private equity funds by 7%-8% per year. As Gompers and Lerners (1999) addressed this issue for the first time, which Gottschalg, Phalippou and Zollo later confirmed, the following hypothesis is derived:
H4: More experience within the fund management company, increases the performance of the private equity fund
3.1.5 Fund Size
Fund size is an important characteristic as it implicates information about reputation, economies of scale and learning effects from conducting multiple deals. Simultaneously, a large fund size can result in a difficulty to find enough lucrative deals which can indicate a positive concave relationship (Phalippou and Zollo, 2005). Kaplan and Schoar (2005) find that fund size relates positively to performance. With respect to these findings, the following hypothesis is formed: H5: Increasing fund size drives private equity fund performance positively
3.1.6 Private Equity Industry Performance
The private equity industry performance indicates information on performance among competitors. It also indirectly implicates industry trends like underinvestment, which might
10
arise due to a high valuation environment of target companies or a trend like less availability of cheap debt. At fund level, an increasing industry performance can positively impact fund performance and thus, the following hypothesis is formulated:
H6: A higher private equity industry performance of the respective country increases private equity fund performance
4. Empirical Analysis
4.1 Dataset and Methodology
This chapter discusses the methodology used to test the previously derived hypotheses. First, a description is given of how data points of individual variables were collected and compiled in order to define variables precisely. Subsequently, the dataset as a whole is described, and the chosen model is explained.
4.1.1 Data Collection
In order to create a comprehensive set of data for testing the hypotheses set out above, various sources were used which provide uniformly comparable data in the respective asset classes. Therefore, Bloomberg was used as the data source for recording historical public stock market developments in the various countries under study. For retrieving the data, the following selections are applied. The relevant indices in Bloomberg were DAX Index, MDAX Index, SDXK
Index, TECDAX Index for Germany, SPX Index for the US, SPTSX Index for Canada, NMX Index for the UK, CAC Index and CN20 Index for France, and NKY Index for Japan. As a next
step, the period and time frame were defined as Start Date 28/12/2005 and End Date 02/01/2019 with periodicity set as monthly. As there are premium differences for small and large-cap investments, not only the main indices with the largest 30 or 40 companies are considered for Germany and France, respectively, but also indices such as the Small Dax in order to include information on different size premia in the analysis. This also supports the comparability with the information from private equity fund performances, as different sizes were also considered.
11
As for government bond yields, the data was retrieved from investing.com as the comparability of all different bonds was given in combination with the possibility to set same time frames and periodicities equal to those of the equity indices. Afterward, the respective monthly bond yields were selected.
The database preqin.com was used to access comprehensive private equity data. This database is not publicly accessible and access for the use of the data was provided by a special agreement with the operators of the database themselves. It is widely used in the literature and found to provide accurate sets of data (Kaplan and Sensoy, 2014). Within the Performance Search multiple filters are applied to the funds. Only data for closed-ended private equity funds with a
buyout strategy were selected that had their vintage years and final closing between 2006 and 2013. As this paper sets the focus on the six countries Germany, the UK, Japan, the US, Canada
and France only funds with their majority (above 50% of total investments) investments in those countries were selected. In total, performance information on 543 funds is available at this stage. In a final step, 66 funds with incomplete data have been excluded, resulting in information from 477 funds being considered in the analysis.
4.1.2 Definition of Variables
In this section, the dependent and independent variables are presented and defined. A general overview of the variables' definitions that are used in the model is given in Table A 1 in the appendix.
4.1.2.1 Time Frame
The dependent and independent variables are considered exclusively in the time frame from January 2006 to December 2018 with a monthly frequency. 2006 was defined as the first year to consider the period before the financial crisis and include information on private equity funds that are fully liquidated after an average lifetime of ten years. As all financial performance
12
variables will be compared on an overall yearly basis, the last completed year is 2018 and thus the last to be considered for the examined period.
4.1.2.2 Geographic Comparison
The geographical comparison is based primarily on economically strong countries that have open markets, where investors from different countries can allocate capital and where the private equity industry experiences a strong or strongly developing activity since 2006. The US, Canada, Japan, Germany, France, and the UK are particularly noteworthy and will be assessed within the framework of this analysis. Henceforth, all variables will be considered for each of these countries respectively, or for private equity funds with major investments in these countries. Moreover, these countries were selected because they represent a sound cross-section of different monetary policies with different central banks and also due to their varying policies regarding protectionism or open market approach when considering the economy.
4.1.2.3 Dependent Variable
As discussed previously, the model will examine the risk premium for investors in private equity, measured as net returns, as a dependent variable. Private Equity funds are usually measured by two performance indicators, the IRR and the multiple. The multiple reveals information on the absolute receivable money over paid-in capital without any consideration of time. Since the maturities of private equity funds vary, an analysis of the internal rate of returns takes the time value of money into consideration. Thus, the internal rate of return can be used to compare private equity fund performance with each other. In the following step, however, private equity funds also vary in terms of cost structures (e.g. carried interest and management fees), which is why the variable to be considered must be the internal rate of return less the costs paid by investors and hence the net internal rate of return ‘net IRR’. This term does not take taxes into account as those are subject to the investor’s origin and private equity funds have no influence on taxes with this regard. It must be noted that for funds that have not been
13
fully liquidated and distributed all the returns to investors, the net IRR is based on equation 1. In order to minimize a bias created by the difference between actual distributions and net asset value calculations of fund managers, the latest vintage year of private equity funds taken into consideration is 2013 as the distribution phase of those funds has, on average, already started. Based on the geographical comparison in different starting years, a cross-sectional panel data set is obtained. For this reason, all individual fund net IRRs are grouped on a fund size weighted average of private equity funds with the same vintage year and same country focus. For example, a portfolio is formed for funds with Germany as a geographic region that were launched in 2008. This procedure is then applied to the other five countries for each year. The result is 48 country net IRR, CNIRR, values in eight vintage years across six countries indicating the respective industry average performances. On average 60 funds have been considered per year. Overall, the net returns for investors are thus sought to be explained as a function of all relevant factors.
4.1.2.4 Classification of time periods for independent variables
For the comparability of the dependent variable with various financial independent variables, the period to be considered must match the underlying time period implied in the net IRR. Assuming an average of ten years for private equity funds and including the time restriction from 2006 until 2018, there are the following time spans. Three completed time spans:
2006-2016, 2007-2017, 2008-2018 and five uncompleted time spans: 2009-2018, 2010-2018, 2011-2018, 2012-2011-2018, and 2013-2018.
4.1.2.5 Independent Variables Risk-free rate
With respect to the variable RiskFree, the government bond with the respective yield to maturity will be selected in order to use an appropriate proxy for the risk-free rate for all periods. Regarding U.S. and Canadian government bonds, no bonds with a maturity of six, eight, or nine years are emitted. Consequently, linear interpolation for the calculation of a seven-year,
eight-14
year and nine-year government bond yield, using a five-year and ten-year government bond yield is used, respectively.
Market-risk
The variable RMPremium refers to the development of the public stock market index in the respective country in excess of the risk-free rate. Since the stock indices in the countries include a different number of companies which are sometimes categorized by size, both the variables for Germany and France were formed with the sum of several non-overlapping stock indices in order to reflect for different returns small-cap companies and include them in the analysis. As a total return calculation includes interest on capital and dividends, capital gains and losses this method will be used for the calculation of the respective time periods and then transformed as a percentage in annual returns. Thus, comparability for each financial independent variable can be provided.
Fund Size
The variable FundSize contains information on the average fund size across all private equity funds that invest in the respective country and have the same respective vintage year. In order to exclude possible differences due to subsequent additional capital commitments, the size is determined by the final closing size. As funds operate in different currencies, the final closing size is indicated in million USD in order to avoid any currency effects.
Fund Series
FundSeries is a variable that refers to the experience of the fund management company. The
fund series number indicates how many funds were already initiated by the same private equity company. The experience is thus shown through implicit information on deal and management experience within previous funds. With an increasing number of previously managed funds, the
15
experience of a management team increases in the selection of good deals, valuing those and implementing value-adding strategies.
4.1.3 Descriptive Statistics of the Dataset
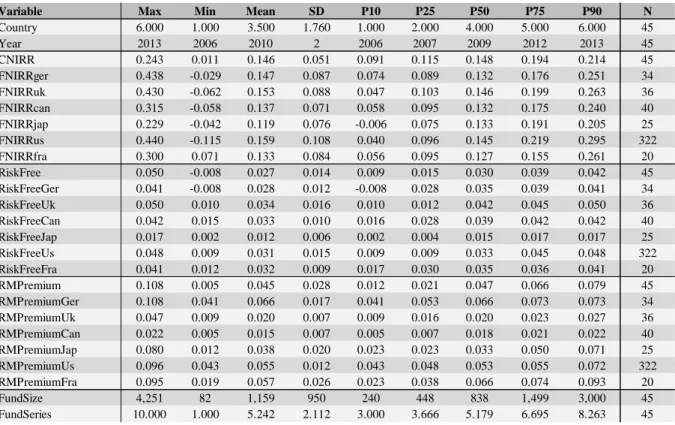
This section describes the characteristics of the previously defined variables and provides a statistical overview. Table A 3 in the appendix shows the summary statistics for dependent and independent variables. As this analysis contains panel data, the first two variables Country and
Year contribute less to the evaluation of the content, but rather set the framework for the
assessment. With regard to the size of funds, the statistical description reveals that the smallest fund has assets of USD 82mm while the largest fund holds assets of USD 4,251m at the final closing date. Summarizing the statistics of the variable FundSeries, it becomes apparent that among all fund management companies within the dataset there are fund management companies who have not managed a fund before and others that have managed up to 10 funds including the fund under study. The average fund management company has experience in managing 4.31 funds up to the date of the respective vintage year. In total, there were 45 observations for all variables in the panel data set, which is due to the fact that the variables with incomplete information were excluded from the data set for evaluation purposes. Excluded panel variables were funds with vintage 2010 and investment focus Germany, vintage in 2010 and main investments in Japan as well as vintage 2009 and prioritizing investments in Canada due to missing information on CNIRR values. It should be noted, however, that the 45 variables in row 3 and 13 result from fund size-weighted average values of individual funds and that the number of underlying observations is 477.
4.1.4 Econometric Model
The hypotheses derived from chapter 3 are empirically tested in this section with the help of the previously defined variables and collected information on these variables. In order to enable
16
a statistical assessment, a cross-sectional time-series analysis is carried out in which the behavior of the country-specific dependent variable CNIRR is observed across time.
𝐶𝑁𝐼𝑅𝑅𝑖𝑡 = 𝛼 + 𝛽1𝑥1,𝑖𝑡+ … + 𝛽𝑘𝑥𝑘,𝑖𝑡+ 𝜀𝑖𝑡 (2)
𝐶𝑁𝐼𝑅𝑅𝑖𝑡 = ith country observation of the dependent variable in year t (i=1, …, 6) (t= 2006,…,2013)
𝛼 = constant / intercept
𝛽1/𝛽𝑘= coefficient of the 1st/ kth independent variable (k=1, …, 6)
𝑥1,𝑖𝑡 = ith country observation of the independent variable in year t 𝜀𝑖𝑡 = error term for the ith country observation in year t
𝑘 = number of independent variables
To analyze the panel dataset correctly, it has to be tested which of the techniques, fixed-effect model or random-effect model, is more suitable for the existing data. The fixed-effect model removes the effect of time-invariant characteristics and focuses on net effects of the underlying predictors on the dependent variable CNIRR. The random-effect model assumes the variation across countries is random and uncorrelated when including the predictor and independent variables in the model. The difference between both models is therefore whether the unobserved individual effect reflects aspects that correlate with the regressors in the model or not. Consequently, the Hausman test was performed with the null hypothesis that the unique error terms are not correlated with the regressors and as can be seen in Table A 4 in the appendix, the null hypothesis can be rejected at a 5% significance level, which indicates the use of a fixed-effect model.
As the performance of private equity funds is generated through the acquisitions and sales of stakes in companies with equity and debt, the predictors RiskFree and RMPremium are introduced as variables named X1 and X2, respectively in two different steps in order to extract first stand-alone effects and afterward the combined influence. Next, the variables FundSize and FundSeries are included in the model as X3 and X4, simultaneously.
Furthermore, groupwise heteroscedasticity in the fixed-effect regression model cannot be excluded and consequently, robust standard errors are initially applied to the model. When
17
taking into account the analysis of time series data, serial autocorrelation in panel data has to be examined although this bias usually affects longer time series of 20-30 years. When using the Wooldridge test for autocorrelation, the panel data indicates no first-order autocorrelation and thus can be neglected. However, the data used for the variables RiskFree and RMPremium relates strongly to macro panels which can be affected by cross-sectional dependence meaning that residuals are correlated across entities. Thus, the Pesaran test of cross-sectional dependence is used to control for a bias in test results, called contemporaneous correlation. As can be seen in Table A 4 in the appendix, cross-sectional dependence seems to be present, which indicates the necessity of an adjustment by using Driscoll and Kraay standard errors. As a result, the fixed-effect model accounts for heteroscedasticity, autocorrelation of the moving average type with a time lag and cross-sectional dependency. There is a time lag averaging 5 years in the model taken into account within the Driscoll and Kraay standard errors. The resulting implication can be explained by the circumstance that investors do not receive returns regularly every year, but rather a main proportion after five years of the fund’s inception.
Once the regression for the analysis of the panel data has been established, the behavior of individual fund returns FNIRR is examined within the respective countries. The following regression is set up for this purpose:
𝐹𝑁𝐼𝑅𝑅𝑧,𝑗𝑡 = 𝛼 + 𝛽1𝑥1,𝑗𝑡+ … + 𝛽𝑘𝑥𝑘,𝑗𝑡+ 𝜀𝑗𝑡 (3)
𝐹𝑁𝐼𝑅𝑅𝑗𝑡 =jth fund observation of the dependent variable in year t (j= 1, …, n) (t= 2006,…,2013)
𝛼 = constant / intercept
𝛽1/𝛽𝑘= coefficient of the 1st/ kth independent variable
𝑥1,𝑖𝑡 = jth fund observation of the independent variable in year t 𝜀𝑖𝑡 = error term for the jth fund observation in year t
𝑘 = number of independent variables 𝑧 = zth country (z=1, …, 6)
𝑛 = number individual funds within country
The regression tests the previously formulated hypotheses on how the dependent variable
FNIRR relates to the independent variables RiskFree and RMPremium.
18
4.2 Empirical Results
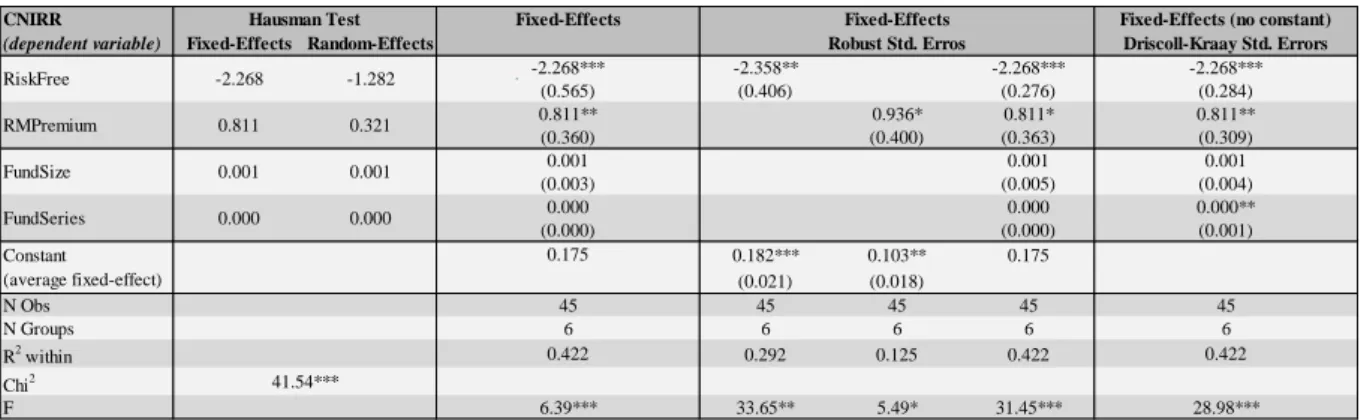
For the testing of hypotheses H1-H5 at a country-level, the model set in up in equation 2 was regressed in several steps with the underlying data. Table 1 shows the coefficient estimates of the fixed-effect regression model for all independent variables including a statistical description below. The respective standard errors are in parentheses. Statistical significance is denoted for a significance on the 1%, 5%, and 10%. Examining the findings of this fixed-effects regression model it can be seen that the R2 within the panel data explains 42.2% of the variance. The model can be considered significant at a 1% level at an F-value of 28.98. To test hypothesis H1, which states that the influence of the independent variables is consistent across countries, the coefficients of the variables must show statistical significance to confirm the hypothesis. As can be seen in the final regression in the last column of Table 1, the coefficients for the risk-free rate, market risk premium, and fund series hold against a 5% significance level and thus confirm H1. In other words, the influence of the three variables on the performance of the private equity asset class is consistent across the six different countries, which was to be expected as the same profit generation methods are used across the countries. Hypothesis H2 stating that higher interest rates have a negative impact on the private equity fund performance is confirmed with a significance up to 1%. The results show a beta of -2.268, which implies that on average the performance decreases by 2.268% if the risk-free rate increases by 1%. This influence is very strong and composed of two different effects. First, if the risk-free rate rises, it acts as a substitution opportunity for investors who no longer consider the risk profile of private equity attractive enough. Secondly, it becomes more difficult for private equity fund managers to generate returns as the cost of leverage becomes more expensive, while the cheap debt was initially one of the main value creation levers. The results for testing hypothesis H3, the positive impact of public stock market index excess returns, are significant at the 5% level and confirm a positive influence. With a beta of 0.811, the result implies a lower sensitivity to
19
the public stock market indices than to the risk-free rate and indicates that the performance of private equity funds increases by 0.811% on average if the returns on public stock market index excess returns increase by 1%. The test for examining hypothesis H4, which states that experience has a positive influence on performance, shows with a significance of up to 5% that the hypothesis can be confirmed. It should be noted however, that the coefficient is almost equal to zero and therefore has only a marginal effect. This is against the expectations that arose during the development of hypothesis H4 and the underlying research from previous literature. The hypothesis H5, that fund size has a positive influence on fund performance cannot be confirmed due to a lack of statistical significance. This result is contrary to arguments stated in the development of hypothesis H5 and previous findings from other literature. It should be noted that the three constant values shown in the fourth column of Table 1 range from 0.103 to 0.182 with significance up to 1%, which implies that up to 18.2% of returns are to be explained by country-specific independent variables.
Table 1: Fixed-Effects Regression Model on CNIRR
Statistical significance is denoted for a significance on the 1%, 5%, and 10% level by ***, **, * using a two-tailed t-test.
In order to investigate the country-specific factors, regressions based on equation 3 were made for the six underlying countries Germany, United Kingdom, Japan, United States, Canada, and France. With these regressions, the hypotheses H1, H2 and H3 are to be examined again at private equity fund-level performance within every country and in addition hypothesis H6 is to be tested as well. Table 2 depicts coefficient estimates of linear regressions for all independent variables. The respective standard errors are in parentheses below. Statistical significance is
CNIRR
(dependent variable) Fixed-Effects Random-Effects
-2.358** -2.268*** (0.406) (0.276) 0.936* 0.811* (0.400) (0.363) 0.001 (0.005) 0.000 (0.000) 0.182*** 0.103** 0.175 (0.021) (0.018) N Obs 45 45 45 N Groups 6 6 6 R2 within 0.292 0.125 0.422 Chi2 F 33.65** 5.49* 31.45***
Fixed-Effects (no constant) Fixed-Effects
Robust Std. Erros
RMPremium FundSize FundSeries
Hausman Test Fixed-Effects
Driscoll-Kraay Std. Errors -2.268*** (0.565) 0.811** (0.360) 0.001 (0.003) 0.000 (0.000) 0.175 45 6 Constant (average fixed-effect) RiskFree 0.422 0.422 6.39*** (0.001) 45 6 0.811** (0.309) 0.001 (0.004) 0.000** 28.98*** 41.54*** -2.268 -1.282 0.811 0.321 0.001 0.001 0.000 0.000 -2.268*** (0.284)
20
denoted for a significance on the 1%, 5%, and 10% level. Assessing the findings of these regressions it can be noted that the R2 explains between a minimum of 71.9% (US) and a maximum of 84.7% (France) of the variance of the respective countries. All models can be considered significant at a 1% level with their respective F-values. For the examination of hypothesis H1, cross-country consistency for all introduced variables, the statistically significant coefficients of each variable are compared. Up to a 10% significance level, the effect of a rising risk-free rate is consistent across four out of six countries studied and the influence of the public stock market index excess return is consistent across all countries under study. Thus, the hypothesis H1 can be confirmed at fund-level. In addition, it is noticeable that annual time effects are not of constant significance when looking at the whole data set. In testing hypothesis H2, the effect of the risk-free rate on the performance of private equity funds, Germany and Canada show results with a significance up to 10% and a beta of 3.357 and -14.578, respectively. The United Kingdom has a beta of -19.237 up to a 5% significance and the US has a beta of -2.508 with a significance up to 1%. The coefficients for the risk-free rate variable of Japan and France are statistically not significant. These results imply a consistent negative effect but with a strong deviation in its intensity. The beta of Germany and the US seem to be in the realm of reality, with the meaning that at fund level a strong sensitivity to the risk-free rate prevails. If the risk-free rate in these countries increases by 1%, the fund performance of German funds decreases by an average of 3.357% and of American funds by 2.508% on average. Considering the betas of Canada and the UK, these figures do not appear to be realistically when putting into context, as these betas indicate an extreme effect that would cause the funds to perform negatively once the risk-free rate rises by 1%. However, hypothesis H2 can be confirmed considering all statistically significant values. When examining the effect of public stock market index excess returns on the performance of private equity funds, hypothesis H3, at fund level, the results for the countries Germany, UK, Japan, and the US are
21
up to 1% significant. Canada has a result with a significance up to 5% and France up to 10%. For all countries, the result shows a positive effect on private equity fund performance and thus, confirms hypothesis H3. On average, funds in Germany have a beta of 3.6, in Japan 3.4, in the US 4.6, and 2.6 in France. In a country comparison, this means that all of them have a high sensitivity to public stock market index excess returns, but index returns in the US have the strongest effect on domestic funds and index returns in France have the least impact on domestic funds. Similar to the results of the UK and Canada for H2, the results for H3 are very high and do not seem realistic with betas of 37.833 and 35.396, which needs to be further investigated when classifying the results. When comparing fund-level results with country-level results, it can be seen that the strong effects can be reduced by diversification and therefore these betas are implicitly in the idiosyncratic risk of the individual funds. Taking into consideration annual effects of these models, the vintage year 2009 had a slightly negative impact on the individual fund performance at a 1% significance level in Germany, Japan, and the U.S. with values of around -0.2% for all countries. This implicates that the performance is slightly worse for all funds that have started investing right after the financial crisis, which could be explained by missing committed capital from investors that have lost the capital during the crisis. In order to test hypothesis H6, the private equity industry performance is included in order to consider a possible explanation of the variance from that variable. The introduction of this variable weakens the statistical significance of all models and depicts only one statistically relevant coefficient for the industry performance, which is in the regression for Germany with a beta of 0.966 up to a 5% significance level. Thus the hypothesis H6 can be only be confirmed for Germany indicating a positive impact of the private equity industry performance on an average German private equity fund performance. Examining the variance inflation factor values, multicollinearity cannot be excluded from the regressions. Thus, particular years with existent
22
collinearity are omitted from the model as shown in Table 2 as the outcomes change significantly if no correction would have been made.
Table 2: Linear Regression Model on FNIRR
Statistical significance is denoted for a significance on the 1%, 5%, and 10% level by ***, **, * using a two-tailed t-test.
5. Discussion
5.1 Classification of Results
Based on the findings of previous studies, it is known that the interest rate environment as well as the economic market situation have a consistent influence on the performance of private equity funds at country-level and at fund-level. So far, these findings have been considered from a global perspective while some literature has set certain focus points on industries. This paper supports to provide a specific geographical comparison taking into account six different countries between 2006 and 2018. The empirical results show statistically significant and consistent coefficients for the risk-free rate and market risk premium. In order to understand the illustrated effect of the interest rate environment more precisely, the effect can be segregated into a substitution effect and an increasing cost of debt effect. Within the substitution perspective, it is conceivable that investors would have alternatives asset classes with less-risky returns available and therefore less capital is committed to private equity. Thus, fund sizes
excl. CNIRR incl. CNIRR excl. CNIRR incl. CNIRR excl. CNIRR incl. CNIRR excl. CNIRR incl. CNIRR excl. CNIRR incl. CNIRR excl. CNIRR incl. CNIRR
-3.357* -1.328 -19.237** 0.470 2.288 -2.785 -2.508*** -14.573 -14.758* -0.987 -1.098 -2.168 (2.431) (2.336) (7.813) (3.001) (4.667) (4.322) (0.568) (15.013) (7.540) (2.714) (1.936) (4.084) 3.621*** 3.065 37.833*** 0.825 3.437*** -3.620 4.551*** 6.669 35.396** -0.136 2.579* 4.714 (0.936) (2.683) (13.468) (5.143) (0.340) (3.353) (0.481) (5.449) (15.052) (5.193) (1.208) (6.068) -0.002 -0.067 0.294*** 0.060 -0.012 -0.050 0.023 0.182 0.115** 0.147 0.090 -0.099 0.057 0.052 (0.099) 0.069 0.078 0.055 0.016 0.181 (0.048) 0.027 0.061 0.141 0.018 0.058 0.363** -0.021 -0.061 -0.039 0.013 0.195 0.464** 0.019 0.112* -0.112 (0.048) (0.046) (0.138) (0.063) (0.079) (0.069) (0.019) (0.214) (0.187) (0.067) (0.061) (0.167) -0.182*** -0.009 -0.919 -0.026 -0.202*** 0.136 -0.151*** 0.114 -0.014 0.048 (0.062) (0.109) (0.304) (0.126) (0.050) (0.172) (0.038) (0.212) (0.102) (0.128) -0.019 -0.081*** -0.071 -0.196 -0.005 -0.107* 0.138 (0.040) (0.032) (0.073) (0.110*) (0.051) (0.055) (0.211) 0.151** omitted omitted 0.001 omitted -0.038 omitted 0.388** omitted 0.050 omitted
(0.060) (0.032) (0.028) (0.151) (0.0641)
0.004 omitted omitted -0.081* omitted -0.014 omitted 0.006 omitted -0.033 omitted
(0.045) (0.044) (0.0267) (0.081) (0.096)
omitted omitted omitted omitted omitted omitted omitted omitted omitted omitted omitted omitted
0.966** 0.919* 1.386* 4.479 0.325 2.358
(0.418) (0.473) (0.743) (5.504) (0.528) (1.922)
R2 0.825 0.316 0.829 0.301 0.811 0.331 0.719 0.108 0.802 0.049 0.847 0.447 F 32.14*** 2.05* 28.03*** n/a 17.41*** n/a 102.27*** 7.36*** 32.83*** 0.34 51.6*** n/a CNIRR RMPremium RiskFree FNIRR 2007 2008 2009 2010 2013 2011 2012
23
decrease which has a negative impact on performance according to previous studies. Rising interest rates have the effect that less debt is available for leveraged buyout transactions and the available debt is secured by stricter covenants. Regarding the premium of public stock market index returns as a variable, it is confirmed that there is a positive impact on the performance of private equity funds at country-level as well as at fund-level. Thus, the findings are in line with previous research and that these are consistent across all countries under study. Although the fund series variable as a proxy for experience has statistical significance, the coefficient is almost equal to zero which implies only a marginal effect on the private equity performance at country-level. This is contrary to the hypothesis H4 and previous research and might derive based on two effects. On the one hand, experience can positively effect the return through learning effects, reputation and implicit economies of scale. On the other hand, this number does only account for the experience of the management company and not of the individual fund manager, which could be new to the team and thus does not bring these learning effects from previous funds. The variable for fund size does not show any statistical relevance in the model, so that the formulated hypothesis H5 can be neglected within the extent of this study. With regards to the private equity industry performance as an independent variable to explain a domestic private equity fund performance, no statistically relevant finding could be ascertained that improves the overall regression model. This indicates that funds are not affected by the performance of their competitors and previous explanations are more sufficient. It also implies that there is no extensive direct competition when purchasing companies. This would mean, that there are enough lucrative deals available so that private equity funds rather compete against strategic buyers when trying to purchase a company than with other private equity funds.
5.2 Limitations to the Model
The findings from the classified results listed were derived with statistical significance, however, the data set and the individual data points therein are subject to some limitations. At
24
first, when comparing the sample size at country-level, it becomes clear that approximately three-quarters of the funds have an investment focus in the U.S. and therefore the country with its market conditions had an essential influence on the findings. Secondly, the net IRR of the funds is based on a cash flow calculation that includes the distributions paid to date and the net asset value of the fund, which is, in most cases, calculated by the fund management company itself and subsequently reviewed for plausibility by auditors. The illiquidity of private equity investments causes the performance indicators of funds that have not been fully liquidated to be subject to uncertainty. The fund performances included in the dataset of this paper that apply to this kind of uncertainty should be reviewed again after liquidation or if the residual value accounts for less than 10% of the total value to reduce biases. When examining the risk-free rate with the use of government bonds as proxies for the interest rate environment, this is a common approach, but the underlying information does not take into consideration any effects of a tightening credit loan environment causing higher cost of debt and less debt availability. As already proven in studies, the changing amount and terms of leverage used have a strong impact on private equity fund performances. It can hardly be accounted for, as there is no publicly available, transparent, and consistent information on credit loan terms for private equity investments in order to quantify those for the econometric model.
5.3 Conclusion
Within the analysis of this paper four key findings could be identified, which relate to the behavior of private equity fund performances.
It was found that across all countries, both in the private equity industry at country-level and at the individual fund-level of respective countries, performance is strongly negatively affected by rising risk-free rates. Both the substitution effect for investors switching to other investment opportunities and the more expensive debt conditions are related to this finding. This leads to the conclusion that in the prevailing environment of low interest rates among developed
25
countries, the private equity asset class is flourishing and is therefore experiencing strong growth in committed capital and investment activities. However, it remains to be examined how sustainable this strong investor attention will be once the interest rate situation changes again. Furthermore, a positive impact of rising public stock market index excess returns on private equity fund performance was observed consistently for all countries under study. This implies two conclusions. A growing public equity index is comparable to the underlying equity in portfolio companies of private equity funds, which also grows in the same time period and has a higher valuation at the end of the period, thus generating higher returns for private equity funds at exit. In addition, large public companies, which are usually represented in the indices, are important buyers of the portfolio companies of private equity funds. If these buyers are financially healthy and well off due to high valuations, they are able to pay a premium on the purchase price for potential synergies with the portfolio companies. This allows private equity funds to generate further returns.
When comparing the results at country-level with the results at fund-level, it was also observed that idiosyncratic risk can be reduced by diversification. Both, the negative effect of rising risk-free rates and the positive effect of rising public stock market index excess returns has been found to be lower at country-level that at an individual fund-level.
It was also found that the explanation of private equity fund performance by the private equity industry performance is not statistically relevant. This implies that the behavior of the funds’ performance is not influenced by competitors and they therefore only compete indirectly. This would imply that there were many potential target companies for the private equity funds at the time period under study and therefore direct competition does not directly affect performance. However, this behavior is to be verified for the future if the private equity asset class still receives increasing investor attention and consequently more funds with more committed capital will enter the biddings for potential target companies.
26 References
Ang, A., Chen, B., Goetzmann, W. and Phalippou, L. (2013), Estimating Private Equity Returns from Limited Partner Cash Flows, Working Paper, SAID Business School and University of Oxford, 2013-14
British Venture Capital Association (2010), A Guide to Private Equity, London
Driessen, J., Lin, T. and Phalippou, L. (2012), A New Method to Estimate Risk and Return of Nontraded Assets from Cash Flows: The Case of Private Equity Funds, Journal of Financial and Quantitative Analysis, Volume 47(3), 511-535
European Private Equity and Venture Capital Association (2006), EVCA Reporting Guidelines, Belgium
Gompers, P. and Lerner, J. (1999), An Analysis of Compensation in the U.S. Venture Capital Partnership, Journal of Financial Economics, Volume 51, 3-44
Gompers, P., Lerner, J., Kovner, A., Scharfstein, D. (2008), Venture Capital Investment Cycles: The Impact of Public Markets, Journal of Financial Economics, Volume 87, 1-23
Gottschalg, O., Phalippou, L. and Zollo, M. (2003), Performance of Private Equity Funds: Another Puzzle?, Working Paper, INSEAD and Wharton 2008
Harris, R., Jenkinson T., and Kaplan, S. (2014), Private Equity Performance: What do we know?, Journal of Finance, Volume 69(5), 1851-1882
Higson, C. and Stucke, R. (2012), The Performance of Private Equity, Working Paper, London Business School and University of Oxford
Ick, M. (2005), Performance Measurement and Appraisal of Private Equity Investments relative to Public Equity Markets, Working Paper, University of Lugano
Jones, C. and Rhodes-Kropf, M. (2003), The Prive of Diversifiable Risk in Venture Capital and Private Equity, Working Paper, Columbia University graduate School of Business
27
Kaplan, S. and Schoar, A. (2005), Private Equity Performance: Returns, Persistance, and Capital Flows, Journal of Finance, Volume 60(4), 1791-1823
Kaplan, S. and Sensory, B. (2014), Private Equity Performance: A Survey, Annual Review of Financial Economics, Volume 7(1), 597-614
Kaplan, S. and Strömberg, P. (2008), Leveraged Buyouts and Private Equity, Journal of Economic Perspectives, Volume 22(4)
Kaplan, S. and Strömberg, P. (2009), Leveraged Buyouts and Private Equity, Journal of Economic Perspectives, Volume 23, 121-146
Kaserer, C. and Diller, C. (2004), Performance Measurement and Asset Allocation for Private Equity Funds: European Private Equity Funds – A Cash Flow based Performance Analysis, Research Paper, European Private Equity & Venture Capital Association (EVCA)
Korteweg, A. and Sorensen, M. (2013), Skill and Luck in Private Equity Performance, Working Paper, Stanford Graduate School of Business
Ljungqvist, A., Richardson, M. and Wolfenzon, D. (2007), The Investment Behavior of Buyout Funds: theory and Evidence, NBER Working Papers 14180, July 2008, National Bureau of Economic Research, Inc
Phalippou, L. (2008), The Hazards of Using IRR to Measure Performance: The Case of Private Equity, Journal of Performance Measurement, Volume 12(4), 55-56
28 Appendix
Table A 1: Glossary of Variables
Table A 2: Keywords used for finding Government Bond Yields on investing.com Dependent Variable CNIRR FNIRR Independent Variable RiskFree RMPremium
FundSize Average fund size in million US dollar
FundSeries CNIRR
Net internal rate of return at country-level for private equity industry performance based on fund size weighted-average of individual funds
Difference between the total return of public stock market index of respective country and the respective government bond over the same maturity
Net internal rate of return at fund-level for private equity fund performance of respective countries
Bond yield of respective government bond with respective maturity as a proxy for the risk-free rate
Net internal rate of return at country-level for private equity industry performance based on fund size weighted-average of individual funds
Average number of funds managed by private equity fund management company of respective country based on fund size weighted-average
Keyword List Government Bonds
Germany DE10YT=RR, DE9YT=RR, DE8YT=RR, DE7YT=RR, DE6YT=RR, DE5YT=RR
United Kingdom GB10YT=RR, GB9YT=RR, GB8YT=RR, GB7YT=RR, GB6YT=RR, GB5YT=RR
Canada CA10YT=RR, CA7YT=RR, CA5YT=RR
Japan JP10YT=X, JP9YT=X, JP8YT=X, JP7YT=X, JP6YT=X, JP5YT=X
United States US10YT=X, US7YT=X, US5YT=X
29
Table A 3: Descriptive Statistics of Independent and Dependent Variables
Max = maximum, Min = minimum, SD = standard deviation, P10 = 10th percentile, P25 = 25th percentile, P50 = 50th percentile = median, P75 = 75th percentile,
P90 = 90th percentile, N = number of observations
Table A 4: Regression Model Testing for Biases
This table depicts the respective outcome values of the tests performed. The confidence interval for the rejection of the null hypothesis at a level of 1%, 5%, 10% is denoted by ***, **, * using either F-test or Chi2-test.
Variable Max Min Mean SD P10 P25 P50 P75 P90 N
Country 6.000 1.000 3.500 1.760 1.000 2.000 4.000 5.000 6.000 45 Year 2013 2006 2010 2 2006 2007 2009 2012 2013 45 CNIRR 0.243 0.011 0.146 0.051 0.091 0.115 0.148 0.194 0.214 45 FNIRRger 0.438 -0.029 0.147 0.087 0.074 0.089 0.132 0.176 0.251 34 FNIRRuk 0.430 -0.062 0.153 0.088 0.047 0.103 0.146 0.199 0.263 36 FNIRRcan 0.315 -0.058 0.137 0.071 0.058 0.095 0.132 0.175 0.240 40 FNIRRjap 0.229 -0.042 0.119 0.076 -0.006 0.075 0.133 0.191 0.205 25 FNIRRus 0.440 -0.115 0.159 0.108 0.040 0.096 0.145 0.219 0.295 322 FNIRRfra 0.300 0.071 0.133 0.084 0.056 0.095 0.127 0.155 0.261 20 RiskFree 0.050 -0.008 0.027 0.014 0.009 0.015 0.030 0.039 0.042 45 RiskFreeGer 0.041 -0.008 0.028 0.012 -0.008 0.028 0.035 0.039 0.041 34 RiskFreeUk 0.050 0.010 0.034 0.016 0.010 0.012 0.042 0.045 0.050 36 RiskFreeCan 0.042 0.015 0.033 0.010 0.016 0.028 0.039 0.042 0.042 40 RiskFreeJap 0.017 0.002 0.012 0.006 0.002 0.004 0.015 0.017 0.017 25 RiskFreeUs 0.048 0.009 0.031 0.015 0.009 0.009 0.033 0.045 0.048 322 RiskFreeFra 0.041 0.012 0.032 0.009 0.017 0.030 0.035 0.036 0.041 20 RMPremium 0.108 0.005 0.045 0.028 0.012 0.021 0.047 0.066 0.079 45 RMPremiumGer 0.108 0.041 0.066 0.017 0.041 0.053 0.066 0.073 0.073 34 RMPremiumUk 0.047 0.009 0.020 0.007 0.009 0.016 0.020 0.023 0.027 36 RMPremiumCan 0.022 0.005 0.015 0.007 0.005 0.007 0.018 0.021 0.022 40 RMPremiumJap 0.080 0.012 0.038 0.020 0.023 0.023 0.033 0.050 0.071 25 RMPremiumUs 0.096 0.043 0.055 0.012 0.043 0.048 0.053 0.055 0.072 322 RMPremiumFra 0.095 0.019 0.057 0.026 0.023 0.038 0.066 0.074 0.093 20 FundSize 4,251 82 1,159 950 240 448 838 1,499 3,000 45 FundSeries 10.000 1.000 5.242 2.112 3.000 3.666 5.179 6.695 8.263 45
Modified Wald Test Heterskedasticity Wooldridge Test Autocorrelation Breusch-Pagan LM Correlation of Residuals Pesaran Cross-Sectional Dependence Chi2 104.66*** 31.26*** 3.683*** F 0.792