Diversity,
distribution and
conservation of
reptiles in the West
Sahara-Sahel
Maria Margarida Henrique Cardoso
Mestrado Biodiversidade, Genética e Evolução
Departamento Biologia 2016/2017
Orientador
José Carlos Alcobia Rogado de Brito, Principal Researcher, CIBIO- InBIO/FCUP
Coorientador
Todas as correções determinadas pelo júri, e só essas, foram efetuadas.
O Presidente do Júri,
Acknowledgments
Esta grande aventura só foi possível devido a todos aqueles que me ajudaram a chegar até aqui.
Queria, por isso, agradecer ao José Carlos Brito e ao Guillermo Velo-Antón por me darem esta oportunidade de estudar animais que me fascinam e pelos ensinamentos que me transmitiram. Queria também agradecer ao Guillermo Velo-Antón pelo facto de me ter levado para a fazer trabalho de campo, é sempre bom para recarregar energias. Ao José Carlos Brito, queria agradecer toda a disponibilidade e atenção até ao ultimo momento. Todos os meus amigos do mestrado que me ajudaram a que este momento fosse possível, sem eles não teria sido igual, as viagens de metro não seriam cheias de gargalhadas, os almoços não iriam saber ao mesmo e definitivamente estes dois anos não teriam sido tão fáceis. Não posso deixar de falar de todos os colegas do ano anterior do mestrado que sempre se mostraram disponíveis para ajudar.
Queria agradecer ao pessoal do grupo BIODESERTS não só porque só graças a eles é que eu pude fazer esta tese devido a todos os anos de expedições ao deserto, mas também a todo o pessoal do CIBIO que me fazem sentir acolhida, até na pausa do cigarro. Não podia deixar de agradecer ao pessoal do CTM, principalmente à Sofia, que por mais perguntas que eu fizesse, nunca deixou de ter um sorriso para mim. À Patrícia, igualmente, e à Susana, sem as quais teria sido muito difícil chegar até aqui.
Queria agradecer a todos os meus amigos que de alguma forma contribuíram para tornar este ano mais leve. Queria agradecer ao Felipe pelos risos, sorrisos, pelas memorias, por acreditares em mim até ao fim, por toda a força que me deste. Mesmo do outro lado do oceano, estiveste sempre aqui.
Por fim, queria agradecer a pessoa mais importante da minha vida, a minha mãe, que sempre me incentivou a não parar de sonhar e sempre acreditou em mim. Sem ela nunca teria chegado até aqui.
Funding for the collection of the samples used in the current M.Sc. thesis was provided by National Geographic Society (grants CRE-7629-04, CRE-8412-08, GEFNE-53-12), Mohammed bin Zayed Species Conservation Fund (grants 11052709, 11052707, 11052499, 13257467), Rufford Foundation (SG-15399-1), Fundação para a Ciência e Tecnologia (PTDC/BIA-BEC/099934/2008, PTDC/BIA-BIC/2903/2012), and FEDER through COMPETE
Operational Programme for Competitiveness Factors (FCOMP-01-0124-FEDER-008917, FCOMP-01-0124-FEDER -028276).
Abstract
Although biodiversity plays a key role in maintaining ecosystem function and persistence, there is global biodiversity loss at an alarming rate. Overall knowledge about biodiversity in deserts and arid regions is still very poor in comparison to other biomes. Deserts hold 25% of terrestrial vertebrate’s species and may provide important findings about adaptions to extreme environments. The region of West Sahara-Sahel (WSS) in Africa has an increased biodiversity, due to the location in a transition zone between the Palaearctic and Afro-tropic biogeographic realms. Preliminary molecular studies detected cryptic diversity in some reptile species, suggesting that the diversity of the group is still poorly known in the region. In this study, molecular and spatial tools were combined to unravel reptile diversity in the WSS. The aim was to answer the following questions: 1) How many reptile phylogeneticunits occur in the WSS? 2) Which is the distribution of the reptile phylogenetic units? 3) Where are the areas with accumulating diversity of reptile phylogenetic units located? 4) Is the current network of protected areas covering the regions which accumulate the highest diversity? A COI barcode was used to build a barcoding reference library for the WSS reptiles based on a total of 755 samples from 109 taxa. Phylogenetic analyses were conducted on 542 sequences to identify phylogenetic units. Delimitation approaches were used to identify the phylogenetic units occurring in the reptiles from WSS and detect cryptic diversity. Geographical Information Systems were used to map the distribution of phylogenetic units, the richness of lineages, and to quantify gaps in the current network of WSS protected areas for reptile diversity.
A DNA barcoding library representing more than 80% of the described reptile diversity of the WSS was assembled, including a barcode for Agama impalearis (new species recorded). Four new putative cryptic species were identified in the WSS (and another five outside), and 93 mitochondrial lineages were retrieved. Four mountain endemic species were found. Reptile richness was concentrated in mountains, especially in Assaba Mountain. The regions concentrating the highest reptile diversity were not represented in the current protected areas.
DNA barcoding library obtained in this study provides a valuable tool for identifying and assessing the diversity of WSS reptiles. Biodiversity distribution is spatially structured and mountains display an important biological role as refugium and as local biodiversity hotspots. The implementation of protected areas in mountains should be taken under advice to conserve reptile diversity.
Keywords
Barcoding, COI, Cryptic diversity, GIS, Lineages Richness, Putative species, Species Richness
Resumo
Ainda que a biodiversidade desempenhe um papel vital na manutenção da função e persistencia de um ecossistema, encontra-se uma perda global de biodiversidade a um ritmo alucinante. O conhecimento geral sobre a biodiversidade nos desertos e regiões áridas é, ainda, muito pobre por comparação com outros biomas. Os desertos alojam 25% dos vertebrados terrestres e, desta forma, podem proporcionar importantes achados sobre adaptações a ambientes extremos. A região do Sahara-Sahel Ocidental (SSO) em África tem uma biodiversidade alargada, devido à sua localização numa zona de transição entre as regiões biogeográficas do Paleoártico e Afro-tropical. Estudos moleculares preliminares detetaram diversidade criptíca em algumas espécies de répteis, sugerindo que a diversidade do grupo ainda é pouco estudada na região.
Nesta tese, as ferramentas espaciais e moleculares foram combinadas de forma a revelar a diversidade reptil no SSO. A intenção prendia-se com a resposta às seguintes questões: 1) Quantas unidades filogenéticas reptis surgem no SSO? 2) Qual é a distribuição de unidades filogenéticas reptis? 3) Onde se encontram as áreas de unidades filogenéticas reptis com diversidade acumulada? 4) Será que a atual rede de áreas protegidas cobrem as regiões que acumulam a maior diversidade? Foi usado um COI barcode para construir uma biblioteca de referência de barcoding para os répteis de SSO, partindo de um total de 755 amostras de 109 taxa. As análises filogenéticas foram realizadas em 542 sequências para a identificação de unidades filogenéticas. Foram usados métodos de delimitação para identificar as unidades filogenéticas presentes nos répteis de OSS e para detetar a diversidade críptica. Utilizaram-se Sistemas de Informação Geográfica para mapear a distribuição das unidades filogenéticas, a riqueza das linhagens e para quantificar as lacunas na atual rede de áreas protegidas da OSS de diversidade reptil.
Uma biblioteca de barcoding de ADN representando mais de 80% da diversidade reptil descrita no OSS foi reunida, incluindo o barcode para a Agama impalearis (nova espécie registada). Quatro novas potenciais espécies crípticas foram identificadas na OSS (conjuntamente com outras cinco localizadas fora da região mencionada), e foram recolhidas 93 linhagens mitocondriais. Foram encontradas quatro espécies endémicas das montanhas. A riqueza reptil estava concentrada nas montanhas, particularmente na Montanha Assaba. As regiões que concentravam a maior diversidade reptil não se encontram representadas nas atuais áreas protegidas.
A biblioteca de barcoding de ADN obtida neste estudo proporciona uma ferramenta valiosa para a identificação e avaliação da diversidade dos répteis do OSS. A distribuição da biodiversidade está estruturada espacialmente e as montanhas desempenham um
importante papel biológico de refúgio e como hotspots de biodiversidade local. A implementação de áreas protegidas nas montanhas devia ser tida em conta, com vista à conservação da diversidade reptil.
Palavras-Chave
Barcoding, COI, Diversidade críptica, SIG, Riqueza de linhagens, Espécies potenciais, Riqueza de espécies
Table of contents
1. Introduction
1.1 Global biodiversity crisis 15
1.2 The West Sahara-Sahel ecoregions of Africa 16
1.2.1 The case of reptiles in the West Sahara-Sahel 18
1.3 DNA Barcoding as a tool for biodiversity identification 20
1.4 Objectives 22 2. Methods 2.1 Study Area 24 2.2 Sampling 25 2.3 Laboratory methods 28 2.4 Phylogenetic analysis 31 2.5 Barcoding analysis
2.5.1 Distance based analysis 31
2.5.2 Tree based analysis: species and lineage identification 32
2.6 Distribution of phylogenetic units and diversity 33
2.7 Gap analysis 33
3. Results
3.1 Laboratory methods 36
3.2 Phylogenetic analysis 36
3.3 Barcoding analyses 37
3.3.1 Distance based analyses 37
3.3.2 Barcoding analyses 39
3.4 Distribution of phylogenetic units and diversity
3.4.1 Distribution of phylogenetic units 51
3.4.2 Distribution of reptile diversity 63
3.4.3 Gap analysis 66
4. Discussion
4.1 Sampling and DNA barcoding identification success 67
4.2 Species and lineage identification 69
4.3 Distribution of reptile diversity in West Sahara-Sahel 71
5. References 73
Table index
Table 1. List of reptile families and species known to occur in the West Sahara Sahel (adapted from Geniez, Mateo and Bons, 2000; Padial, 2006; Trape and Mané, 2006; Trape, Trape and Chirio, 2012). * indicates species for which no sample was available (see section 2. Methods below)………..19 Table 2. Mountains and Ecoregions found in the WSS and their respective area (km2) and percentage of coverage………...25 Table 3. List of samples available for the current study for each species. Species identified according to external morphological characters. Uncertain id. indicates samples with uncertain morphological diagnosis. * indicates outgroup taxon of taxa occurring in the West Sahara-Sahel………..27 Table 4. PCR conditions for the sequenced gene COI for those species that fail to amplify with the general TD PCR……….30 Table 5. List of Protected Areas in the West Sahara-Sahel, including the status (implemented or under discussion), category, name, and area (Adapted from IUCN & UNEP-WCMC, 2017)………..34 Table 6. Summary of successful barcoding results………47 Table 7. List of species, candidate species and respective lineages identified in this study. *
- distribution is mapped in figures 13 to 22………..47 Table 8. Number of families (F), genera (G), species (S) and lineages (L) of reptiles occurring
in distinct regions of the West Sahara-Sahel………63 Table 9. Area and percent of protection of mountains and ecoregions of the West Sahara- Sahel………..66
Figure index
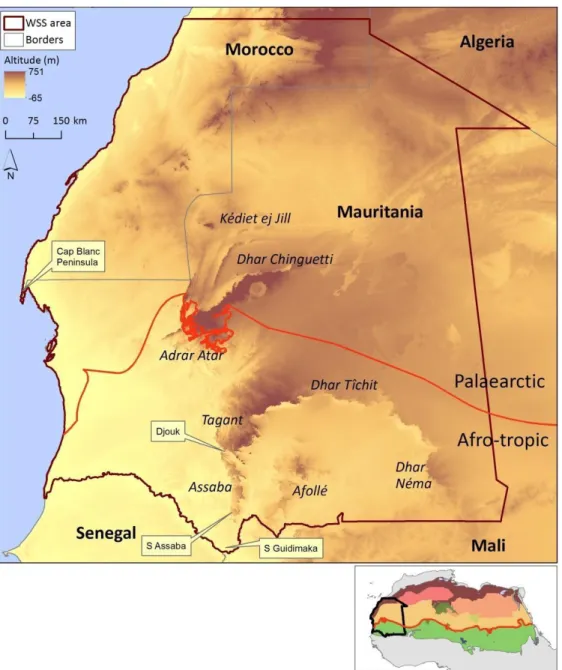
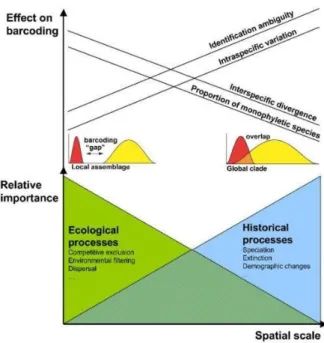
Figure 1. Location of the West Sahara-Sahel (WSS) and distribution of ecoregions (coloured polygons; adapted from Dinerstein et al., 2017) in North Africa (small inset). Location of major mountain massifs and transition line between Palaearctic and Afro- tropic regions in the WSS. Location of particular localities mentioned in the text are depicted by text boxes………..17 Figure 2. Schematic representation of the relative importance of processes as spatial (and temporal) scale increases and the effect on DNA barcoding criterion (adapted from Bergsten et al., 2012). The linear slopes are simplifications and the nature of the scale effects can be non-continuous and chaotic across different domains of scale (see Wiens, 1989). The small red and yellow graphs depict the presence or absence of barcoding gap, i.e., the overlap between inter- and intra-specific genetic distances (adapted from Meyer and Paulay, 2005)……….22 Figure 3. Distribution of mountains and ecoregions (adapted from Dinerstein et al., 2017) within the West Sahara-Sahel, and limit between the Palaearctic and Afro-topic biogeographical realms………...24 Figure 4. Distribution of 755 samples available for this study in Africa (small inset) and within the West Sahara-Sahel region………26 Figure 5. Location of Protected Areas in the West-Sahara-Sahel distinguishing between areas fully implemented and under discussion, and distinct categories of protection (Adapted from IUCN & UNEP-WCMC, 2017)………...34 Figure 6. Line-plot of the barcode gap for all Reptile haplotypes as generated by Spider (Brown et al., 2012). For each individual in the dataset, the grey lines represent the furthest intraspecific distance (bottom of line value), and the closest interspecific distance (top of line value). The red lines show where this relationship is reversed, and the closest non-conspecific is actually closer to the query than its nearest conspecific (i.e. no barcoding gap)……….38 Figure 7. Bayesian COI tree for all reptiles. Species delimitation using 9.5% distance threshold are represented by different colours and the respective lineages are represented using different shades of the same colour. Lineages with more than one specimen were collapse in triangles. Stars indicate species and lineages that occur in the WSS. Black dots indicate posterior probability values equal or higher that 0.95 and the red dots represent lower posterior probability values. The new putative cryptic species are named in green………...41
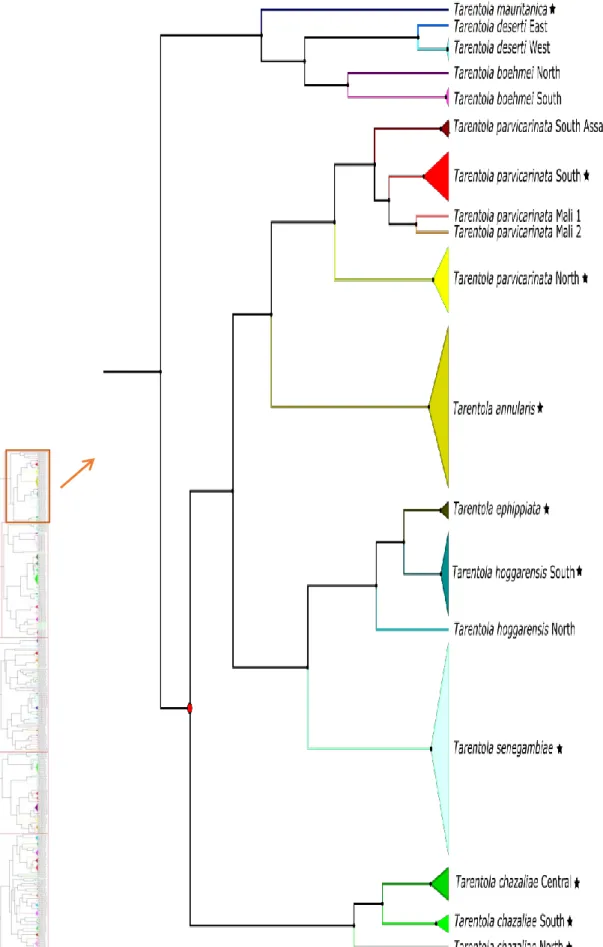
Figure 8. First zoom of the Bayesian COI tree for all reptiles. Clade comprises all species from the genus Tarentola. Stars indicate species and lineages that occur in the West Sahara-Sahel………42 Figure 9. Second zoom of the Bayesian COI tree for all reptiles. Clades comprise all species
from the genera Hemidactylus, Ptyodactylus, Tropiocolotes and Stenodactylus. Stars indicate species and lineages that occur in the West Sahara-Sahel. The new putative cryptic species are named in green………43 Figure 10. Third zoom of the Bayesian COI tree for all reptiles. Clades comprise all species from the genera Varanus, Centrochelys, Crocodylus, Trachylepis, Chalcides, Mesalina,
Latastia and Acanthodactylus. Stars indicate species and lineages that occur in the
West Sahara-Sahel. The new putative cryptic species are named in green……….44 Figure 11. Fourth zoom of the Bayesian COI tree for all reptiles. Clades comprise all species from the genera Chamaeleo, Uromastyx, Trapelus and Agama. Stars indicate species and lineages that occur in the West Sahara-Sahel………..45 Figure 12. Fifth zoom in the Bayesian COI tree for all reptiles. Clades comprise all snake species from the genera Rhagerhis, Psammophis, Python, Gongylophis, Lytorhynchus,
Naja, Atractaspis, Boaedon, Spalerosophis, Hemorrhois, Bamanophis, Crotaphopeltis, Telescopus, Dasypeltis, Echis, Cerastes, Myriopholis and Indotyphlops. Stars indicate
species and lineages that occur in the West Sahara-Sahel. The new putative cryptic species are named in green.………..46 Figure 13. Map of the distribution of reptile species and their lineages in the West Sahara- Sahel: Acanthodactylus boskianus, A. busacki, A. dumerilii, A. taghitensis, and Agama
boensis. Blue, green and yellow dots represent sequenced samples of lineages within
the same species. Red dots correspond to sequenced samples from monophyletic species. Black dots represent occurrence records from un-sequenced samples……..53 Figure 14. Map of the distribution of reptile species and their lineages in the West Sahara- Sahel: Agama boueti, A. boulengeri, A. impalearis, Atractaspis microlepidota,
Bamanophis dorri and Bitis arietans. See figure 13. for legend details………54
Figure 15. Map of the distribution of reptile species and their lineages in the West Sahara- Sahel: Boaedon fuliginosus, Cerastes cerastes, C. vipera, Chalcides delislei, C.
sphenopsiformis and Chamaeleo africanus. See figure 13 for legend details…………..55
Figure 16. Map of the distribution of reptile species and their lineages in the West Sahara- Sahel: Crocodylus suchus, Echis pyramidum, Gongylophis muelleri, Hemidactylus
angulatus, Hemorrhois algirus and Indotyphlops braminus. See figure 13 for legend
details………....56 Figure 17. Map of the distribution of reptile species and their lineages in the West Sahara-
guttulata, M. olivieri and M. pasteuri. See figure 13 for legend details………...57
Figure 18. Map of the distribution of reptile species and their lineages in the West Sahara- Sahel: Mesalina rubropunctata, M. sp. nov., Naja nigricollis, Pristurus adrarensis,
Psammophis cf. rukwae and P. elegans. See figure 13 for legend details………..58
Figure 19. Map of the distribution of reptile species and their lineages in the West Sahara- Sahel: Psammophis schokari, Ptyodactylus rivapadiali sp. nov., Python sebae,
Rhagerhis moilensis, Scincus albifasciatus and Spalerosophis diadema. See figure 13
for legend details………...59 Figure 20. Map of the distribution of reptile species and their lineages in the West Sahara- Sahel: Stenodactylus mauritanicus, S. petrii, S. cf. sthenodactylus, Tarentola annularis,
T.chazaliae and T. ephippiata. See figure 13 for legend details………60
Figure 21. Map of the distribution of reptile species and their lineages in the West Sahara- Sahel: Tarentola hoggarensis, T. parvicarinata, T. senegambiae, Telescopus
tripolitanus, Trachylepis perrotetii and T. quinquetaeniata. See figure 13 for legend
details……….61 Figure 22. Map of the distribution of reptile species and their lineages in the West Sahara- Sahel: Trapelus boehmei, Tropiocolotes algericus, T. tripolitanus, Uromastyx dispar,
Varanus griseus and V. niloticus. See figure 13 for legend details………..62
Figure 23. Relationships between area of mountains/ecoregions (% of study area) in the West Sahara-Sahel and the absolute number (N) of families, genera, species and lineages retrieved in each region………64 Figure 24. Distribution maps of richness of families, genera, species and lineages in each studied region. Richness is weighted by the area of each region. Grey zones (excluded) indicate regions were no taxa were detected………65
Abbreviation index
COI - cytochrome c oxidase I
GIS - Geographical information systems mtDNA - Mitochondrial DNA
p.p – Posterior probability R2 - R-squared
UTM - Universal Transverse Mercator WSS - West Sahara Sahel
1. Introduction
1.1 Global biodiversity crisis
Biodiversity has an important role in controlling ecosystem function and stability, providing several indirect essential services obtained from the natural ecosystems together with tremendous direct economic benefits (Singh, 2002). Still, the world is facing the first mass extinction since the dinosaurs (Sheehan et al., 1991; Ceballos et al., 2015). We are witnessing a loss of biodiversity at an alarming rate, with the current extinction rates exceeding what was expected from the fossil record (Barnosky et al., 2011). While past extinctions happened during a period of million years, the current mass extinction will probably take place in a much shorter span of time of about 200 years (Singh, 2002). Humans play a major role in this crisis, since the current anthropogenic activities lead to habitat loss and fragmentation, overfishing, overhunting, introducing invasive species, spreading diseases, polluting, and causing climate change (Tittensor et al., 2014; Barnosky
et al., 2011; Hoffmann et al., 2010). In response to the global crisis, recent efforts have been
made at the highest international levels to stop the decline of biodiversity and ecosystem services (Krishna Krishnamurthy and Francis, 2012), such as the Convention on Biological Diversity’s 2020 Strategic Plan for Biodiversity (Joppa et al., 2016). Recently, a set of Sustainable Development Goals (SDG) were adopted by several countries as part of the 2030 Agenda for Sustainable Development (UN General Assembly, 2015). Among the 17 defined SDGs, the “Life on land” aims at halting biodiversity loss. Still, it has been argued that no significant improvements in halting biodiversity loss will be achieved by 2020, comparing to 2010 (Tittensor et al., 2014).
The available knowledge about overall global biodiversity is still very limited (Whittaker et al., 2005). Even with 250 years of taxonomic studies, much of the biodiversity is still to be described or to be discovered (Krishna Krishnamurthy and Francis, 2012). Since the majority of species have not been formally described yet, the quantification of biodiversity loss is likely very underestimated (Dirzo and Raven, 2003; Joppa et al., 2011). In addition, given that estimates of biodiversity loss do not consider population extinctions or community changes, then biodiversity loss estimates are further undervalued (Mendenhall et al., 2012).
Global biodiversity conservation requires the preservation of the variability between individuals, species and ecosystems (Jensen, 1990). One way to do it is by looking at species genetic diversity, since intra-specific diversity allow obtaining insights into how they evolved (Mooers, 2007) and into the potential for future evolutionary change (Solbrig, 1991).
Given that the frequencies of unique or rare haplotypes possibly result from natural selection, if ecological or environmental factors are driving the genetic patterns, then they can putatively indicate local adaptation events (Nielsen et al., 2017). Thus, genetic diversity is considered as an important conservation trait since high levels of diversity can increase individual fitness and population resilience (Hughes et al., 2008). Additionally, there is also evidence for a probable correlation between genetic diversity and species richness (Wright
et al., 2015; Selkoe et al., 2016), which together likely improve ecosystem function and
resilience (Reusch et al., 2005; Bernhardt and Leslie, 2013). Thus, preserving genetic variation is critical to mitigate the potential impacts of climate change on biodiversity (Smith
et al., 1993).
The available knowledge about the global, regional, and local distributions for most of the known species is mostly incomplete, a problem named as Wallacean shortfall by Lomolino (2004). Regional knowledge biases occur for the well sampled areas of North America, Australia and Western Europe while other areas, such as Africa and other politically unstable regions, are still poorly studied (Meyer et al., 2016). Biases also occur in certain types of biomes, such as tropical forests that are normally perceived as potential biodiversity hotspots, which in turn stimulates more scientific attention and data collection (e.g. Liu et al., 2015; Barlow et al., 2016; Ocampo-Peñuela et al., 2016). On the contrary, remote regions of restricted accessibility, often subjected to civil conflict and war, are less well sampled and remain poorly known (Brito et al., 2009; Strange et al., 2007). This is especially evident in deserts and arid regions, where little conservation investment and action have been placed in comparison to tropical biomes (Davies et al., 2012; Durant et al., 2012). About 17% of the world’s land mass is covered by deserts and arid regions and despite having low primary productivity, deserts harbour 25% of terrestrial vertebrates species and together with xeric shrublands are in the first three richest biomes for terrestrial vertebrate species (Hassan, Scholes and Ash, 2005; Mace et al., 2005). An enormous potential is thus hidden within desert biodiversity; its study can lead to important findings in physiological and genetic traits related with resistance to extreme temperatures and water stress contexts (Durant et al., 2014).
1.2 The West Sahara-Sahel ecoregions of Africa
The Sahara desert, together with the neighbouring arid Sahel, is the largest warm desert in the world and both represent two main ecoregions of the African continent, covering about 11,230,000 km2 (Dinerstein et al., 2017).
Figure 1 – Location of the West Sahara-Sahel (WSS) and distribution of ecoregions (coloured polygons; adapted from Dinerstein et al., 2017) in North Africa (small inset). Location of major mountain massifs and transition line between Palaearctic and Afro-tropic regions in the WSS. Location of particular localities mentioned in the text are depicted by text boxes.
The West Sahara-Sahel (WSS), covering Mauritania and southern Morocco, exhibits high diversity of topographic features, from salt pans below sea level to mountain plateaux, and heterogeneous climates due to the substantial variability in temperature and precipitation (Brito et al., 2014). The WSS comprises the transition zone between the Palaearctic and Afro-tropic biogeographical realms, and thus constitutes a biogeographic crossroad where endemic species are found beside range-limit populations of species of Palaearctic and Afro- tropic affinity (Brito et al., 2014; Le Houerou, 1997). Cyclic climatic oscillations since at least from 6 to 2.5 Mya have affected the region, when the Sahara desert appeared in western areas (Schuster et al., 2006). The last wet period occurred in the mid-Holocene and ended around 6 to 5000 years ago, when extreme increase in aridity caused the disappearance of mesic vegetation communities and collapse of most water-bodies (Foley et al., 2003;
Holmes, 2008).
Biodiversity distribution in the Sahara-Sahel appears to be linked to environmental changes (Brito et al., 2016). The dynamics of climate oscillation in the region and the arid periods may have induced allopatric diversification and speciation events in taxa restricted to mountains or aquatic environments for long periods (Brito et al., 2014). Areas with more precipitation and subsequent more primary productivity are found to have higher species richness, but the central Sahara accumulates most of the threatened and endemic species (Brito et al., 2016). The WSS mountains constitute isolated suitable areas for a wide array of species, acting as biodiversity refugia and playing an important role in the diversification patterns observed across the region (Brito et al., 2014). In particular, water-bodies in mountains are particularly important places, as they disproportionally accumulate biodiversity representation considering their very small size (Brito et al., 2014). For instance, about 78 % of Mauritanian endemics and 32% of the considered vertebrates where present in 69 analysed water- bodies, and the Assaba mountain gathered the most diverse water-bodies (Vale et al., 2015). The last 10 years of taxonomic research brought new insights regarding the vertebrates occurring in the WSS, showing that there is still urgent research to be made to uncover the hidden cryptic biodiversity (reviewed by Brito et al., 2014). Molecular studies have been demonstrating that what was once recognised as a widespread species, in fact they contain multiple evolutionary lineages, sometimes cryptic, with restricted and fragmented distributions (Brito et al., 2014). These findings are completely altering what we knew about the biodiversity patterns. Emphasising that the current knowledge on biodiversity is incomplete (Brito et al., 2016). Thus, updated information regarding intra-specific diversity across the Sahara Sahel is mostly needed to accurately map biodiversity distribution patterns and to lay the basis for the understanding of evolutionary and landscape processes associated with biodiversity distribution.
Human activities are on the rise across the Sahara-Sahel and human population has almost doubled in the region from 1990 to 2010 (OECD, 2014; Brito et al., 2016). Although the region still displays some of the lowest levels of urbanization in the world, the rate at which is happening is startling (OECD, 2014). Desert ecosystems are predicted with strong and fast climate changes (Loarie et al., 2009), which taken together with the major undergoing habitat changes calls for urgent identification of biodiversity hotspots where to allocate conservation efforts.
1.2.1 The case of reptiles in the West Sahara-Sahel
The reptiles of the WSS provide a case-study for addressing biodiversity distribution in remote regions. Presently, 77 reptile species have been identified in the WSS (Geniez et al.,
2000; Padial, 2006; Trape and Mané, 2006; Trape et al., 2012), from Mediterranean, North- Saharan, Saharan, Sahelian, Tropical and Macaronesian origin (Geniez et al., 2000) (Table 1). Preliminary studies based in molecular markers have detected cryptic diversity in some species, such as in Agama and Uromastyx lizards or Stenodactylus geckos (Gonçalves et
al., 2012; Harris, Vaconcelos, and Brito, 2007; Metallinou et al., 2012), suggesting that a
significant amount of diversity with taxa remains undescribed (Brito et al., 2014). Thus, a complete assessment of the group’s diversity is lacking and the distribution of such diversity is mostly unknown. Such information is urgently needed given that many suitable habitats for reptiles are endangered due to intense wood harvesting and increasing agro-pastoral use (Padial, 2006). Regional red-list categorised 14% of the reptiles of Morocco as threatened (Pleguezuelos et al., 2010), but such data are unavailable for Mauritania. The identification of cryptic diversity combined with the definition of phylogenetic units using genetic tools would certainly contribute for the conservation planning of regional reptile diversity (Hawlitschek et al., 2016).
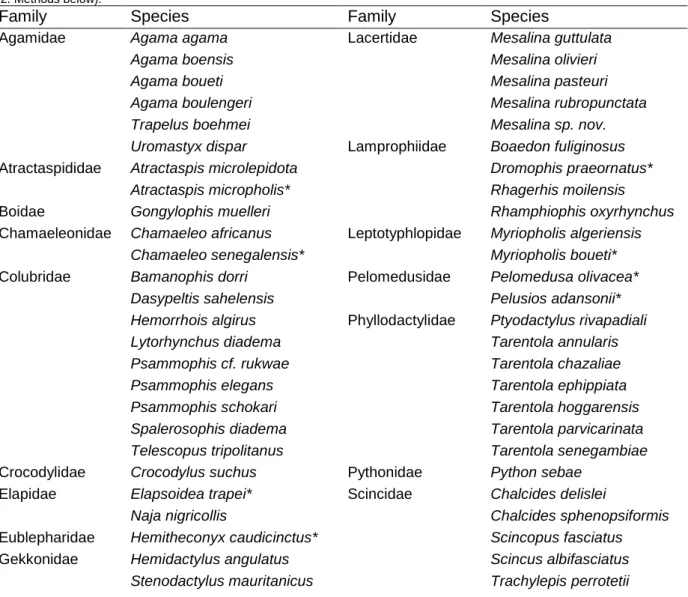
Table 1 – List of reptile families and species known to occur in the West Sahara Sahel (adapted from Geniez et. al., 2000; Padial, 2006; Trape and Mané, 2006; Trape et. al., 2012). * indicates species for which no sample was available (see section 2. Methods below).
Family Species Family Species
Agamidae Agama agama Lacertidae Mesalina guttulata
Agama boensis Mesalina olivieri Agama boueti Mesalina pasteuri Agama boulengeri Mesalina rubropunctata Trapelus boehmei Mesalina sp. nov. Uromastyx dispar Lamprophiidae Boaedon fuliginosus
Atractaspididae Atractaspis microlepidota Dromophis praeornatus* Atractaspis micropholis* Rhagerhis moilensis
Boidae Gongylophis muelleri Rhamphiophis oxyrhynchus
Chamaeleonidae Chamaeleo africanus Leptotyphlopidae Myriopholis algeriensis Chamaeleo senegalensis* Myriopholis boueti*
Colubridae Bamanophis dorri Pelomedusidae Pelomedusa olivacea* Dasypeltis sahelensis Pelusios adansonii* Hemorrhois algirus Phyllodactylidae Ptyodactylus rivapadiali Lytorhynchus diadema Tarentola annularis Psammophis cf. rukwae Tarentola chazaliae Psammophis elegans Tarentola ephippiata Psammophis schokari Tarentola hoggarensis Spalerosophis diadema Tarentola parvicarinata Telescopus tripolitanus Tarentola senegambiae
Crocodylidae Crocodylus suchus Pythonidae Python sebae
Elapidae Elapsoidea trapei* Scincidae Chalcides delislei
Naja nigricollis Chalcides sphenopsiformis
Eublepharidae Hemitheconyx caudicinctus* Scincopus fasciatus
Gekkonidae Hemidactylus angulatus Scincus albifasciatus Stenodactylus mauritanicus Trachylepis perrotetii
Stenodactylus petrii Trachylepis quinquetaeniata Stenodactylus sthenodactylus Sphaerodactylidae Pristurus adrarensis
Tropiocolotes algericus Testudinidae Centrochelys sulcata Tropiocolotes tripolitanus Trionychidae Cyclanorbis senegalensis*
Lacertidae Acanthodactylus aureus Trionyx triunguis* Acanthodactylus boskianus Typhlopidae Indotyphlops braminus Acanthodactylus busacki Varanidae Varanus exanthematicus Acanthodactylus dumerilii Varanus griseus
Acanthodactylus longipes Varanus niloticus Acanthodactylus scutellatus Viperidae Bitis arietans Acanthodactylus taghitensis Cerastes cerastes Latastia longicaudata Cerastes vipera
Echis pyramidum
1.3 DNA Barcoding as a tool for biodiversity assessment
DNA barcoding can aid to bridge the gap of knowledge in poorly studied areas, providing means to understand local species diversity and evaluate intra-specific variability (Krishna Krishnamurthy and Francis, 2012). The technique uses molecular markers to amplify short and highly variable DNA sequences (Hebert et al., 2003), which allow effective species identification through comparison of similarities of sequenced barcodes with a reference database (Hebert and Gregory, 2005). The Consortium for the Barcode of Life (“CBOL”, 2004) suggested that this approach should meet certain operational criteria to assure informative taxonomical identification: 1) a single gene of roughly 600 base pairs, cytochrome c oxidase I (COI) in the 5’ end of mitochondrial DNA (mtDNA) is sequenced and used as a barcode; 2) the same barcode, same region of the same gene, is used universally in order to develop standardised protocols; and lastly 3) the obtained sequences are then analysed with distance based approaches to identify specimens and hence their taxon (Savolainen et al., 2005; Rubinoff, 2006; Krishnamurthy and Francis, 2012).
DNA barcoding has shown to provide invaluable source of information for forensic studies (Carvalho et al., 2015; Rolo et al., 2013), biodiversity inventories (Telfer et al., 2015; Walther
et al., 2013), quantifications of phylogenetic diversity (Smith, Hallwachs, and Janzen, 2014),
population monitoring and demographic studies (Craft et al., 2010; Kunprom, Sopaladawan, and Pramual, 2015; Alfonsi et al., 2013), tracking illegally trade species (Yan et al., 2013; Welton et al., 2013; Zhang et al., 2015), detection of rare or secretive animals (Schnell et
al., 2012), and invasive species identification (Xu et al., 2016). Barcoding has provided an
amazing input to taxonomic research by aiding in the identification of species and in the discovery of new, sometimes cryptic, ones (Hebert et al., 2004; Vieites et al., 2009; Padial
et al., 2010; Murphy et al., 2013).
The divergences found in COI allow the discrimination of closely allied species, so COI can be used as an effective tool in species identification (Hebert et al., 2003). Divergences reflect
both the high rates of sequence change in COI and the constraints on intraspecific mitochondrial DNA divergence, the latter are in part due to selective sweeps mediated via interaction with the nuclear genome (Hebert et al., 2003). Additionally, the higher divergences exhibited in some ‘species’ does not compromise the use of COI marker for their identification. Instead, it is quite the opposite, since COI may allow the delimitation of regional lineages within species (Hebert et al., 2003). Barcoding is now commonly accomplished using operational taxonomic units (e.g. Jones et. al., 2011; Pentinsaari et al., 2017)). Blaxter et al. (2005) defined ‘molecular operational taxonomic unit’ has a cluster of individuals identified based on sequence similarity. This has revolutionized the way how units worthy of monitoring and conservations efforts are selected (Adamowicz, 2015).
Although COI is a valuable marker, it should be used with caution when relying only on this barcode for species discovery or identification. Given that COI is maternally inherited and that distinct evolutionary processes may act differently on either genders (Shaw, 2002; Trewick, 2008; Will and Rubinoff, 2004), nuclear pseudogenes of mitochondrial origin (numts) are common in main eukaryotes’ clades (Krishnamurthy and Francis, 2012) and mitochondrial introgression has been detected (Cong et al., 2017). As such, Bergsten et al., (2012) argued that the best approach for achieving higher identification rates is to do it at small geographic scales. As expected, intraspecific diversity increases with geographical sampling scale due to phylogeographic structure and isolation by distance phenomena (Figure 2). Bergsten et al., (2012) also noticed that with increasing geographic sampling scale there is a decrease in interspecific divergence, since more closely related, allopatrically distributed, species occur over larger areas, and there is an increase in the amount of non-monophyletic species. Given that spatial scale is relevant when using identification and delimitations approaches that rely on species monophyly, national and regional barcoding initiatives are best for maximal identification precision (Bergsten et al., 2012).
Until recently, COI was scarcely used for barcoding reptiles. This was mainly due to the methodological challenges arising from the high variability of DNA sequences making difficult the binding of primers (Murphy et al., 2013). With the development of new primers (Nagy et
al., 2012), the use of COI for barcoding became widespread in the last years (e.g. Vences et al., 2012; Hawlitschek et al., 2013; Vasconcelos et al., 2016), and supported the
establishment of the global initiative Cold Code that aims at barcoding all herpetofauna (Murphy et al., 2013).
Figure 2. Schematic representation of the relative importance of processes as spatial (and temporal) scale increases and the effect on DNA barcoding criterion (adapted from Bergsten et al., 2012). The linear slopes are simplifications and the nature of the scale effects can be non-continuous and chaotic across different domains of scale (see Wiens, 1989). The small red and yellow graphs depict the presence or absence of barcoding gap, i.e., the overlap between inter- and intra-specific genetic distances (adapted from Meyer and Paulay, 2005).
Overall, barcoding studies enhance the understanding of global species diversity. For a better understanding of biodiversity distribution patterns, this approach should be used in conjunction with spatial tools, such as Geographical Information Systems (GIS). This combination culminates into spatially explicit maps of genetic information with valuable phylogeographic information to inform effective conservation planning (Krishna Krishnamurthy and Francis, 2012). GIS provide valuable tools to investigate geographic related processes for conservation planning, for example mapping regions concentrating high species richness and optimised reserve design solutions (Brito et al., 2016), the modelled distribution of poorly known species (Papeş and Gaubert, 2007), or the predictions of range shifts induced by climate-change (Thuiller et al., 2006).
1.4 Objectives
This work aims at increasing the available knowledge on the diversity, distribution and conservation of reptiles in West Sahara-Sahel. In detail, it is expected to answer the following questions:
1) How many reptile phylogenetic units occur in the West Sahara-Sahel? 2) Which is the distribution of reptile phylogenetic units?
3) Where are the areas accumulating diversity of reptile phylogenetic units located?
4) Is the current network of protected areas covering the regions accumulating the highest diversity?
Molecular and spatial tools will be used in an integrative approach to derive the reptile phylogenetic units’ distribution allowing identifying richness areas and priority areas for the conservation of reptile biodiversity in WSS. Considering the huge information gaps on local species richness and individual species’ ranges at all taxonomic levels and that biodiversity mapping in the WSS is still poor (Brito et al., 2014), it is expected to improve the current knowledge at these levels for local reptile fauna by providing data on reptiles’ phylogenetic diversity and their respective current biogeographical patterns. The creation of a barcoding reference library for the WSS reptiles will also contribute for the ‘Cold Code’ global initiative that aims to barcoding global herpetofauna (Murphy et al., 2013).
2. Methods
2.1 Study area
The study area is located in the West Sahara-Sahel (WSS) and comprises Mauritania and southern Morocco (Figure 3). With a total area of 1,024,538 km2, the WSS includes vast arid areas with a series of scattered scarps-like mountains (scarps separating sandstone plateaus) facing south-west. Mountain rock pools, locally known as gueltas, are located at the base of some of the escarpments. There are eight mountains and nine ecoregions (Dinerstein et al., 2017) within the WSS with distinct distributions and areas (Table 2).
Figure 3– Distribution of mountains and ecoregions (adapted from Dinerstein et al., 2017) within the West Sahara-Sahel, and limit between the Palaearctic and Afro-topic biogeographical realms.
Table 2. Mountains and Ecoregions found in the WSS and their respective area (km2) and percentage of coverage. Region Area (km2) % Mountain Adrar Atar 11037 1.08 Afollé 10836 1.06 Assaba 3643 0.36 Dhar Chinguetti 7646 0.75 Dhar Néma 8103 0.79 Dhar Tîchit 3863 0.38 Kédiett ej Jill 469 0.05 Tagant 18923 1.85 Ecoregion
Mediterranean Acacia-Argania dry woodlands and succulent thickets 1554 0.15 North Saharan Xeric Steppe and Woodland 128796 12.57
Saharan Atlantic coastal desert 31004 3.03
Saharan halophytics 4599 0.45
Sahelian Acacia savanna 310270 30.28
South Sahara desert 463828 45.27
West Sahara desert 13119 1.28
West Saharan montane xeric woodlands 6278 0.61
West Sudanian savanna 569 0.06
2.2 Sampling
A total of 755 samples were available for this study (Figure 4). Samples were collected by researchers and collaborators of BIODESERTS research group during 34 field expeditions to North Africa (http://biodeserts.cibio.up.pt/expeditions). Samples were assigned to previously existing taxonomical units based on external morphological characters and following standard identification keys (Geniez et al., 2004; Trape and Mané, 2006; Trape, Trape, and Chirio, 2012)
Geographic coordinates of all samples were collected in the field with a Global Positioning System (GPS) on the WGS-1984 datum. Metadata of all samples were inserted in a georeferenced database and a Geographical Information System (ArcGIS) was used for display of distribution data. Tissue samples were preserved in tubes with 100% ethanol to guarantee DNA integrity.
Figure 4. Distribution of 755 samples available for this study in Africa (small inset) and within the West Sahara-Sahel region.
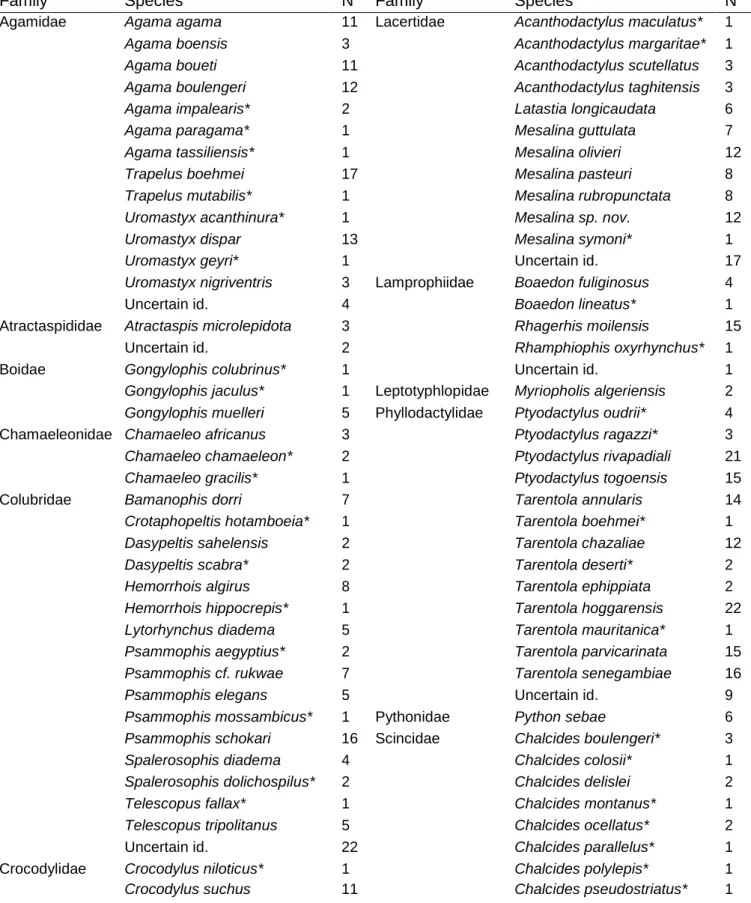
The 755 samples included 695 samples from 109 reptile taxa distributed by 19 families and 60 samples from taxa with uncertain diagnosis at the species level (Table 3). The dataset included 69 species known to occur in the WSS, corresponding to 90% of the diversity described in the WSS region (Table 1). The dataset also included 50 samples from 41 outgroup taxa and 196 samples come from areas outside the WSS.
Samples were selected for analyses in order to: 1) cover the described taxonomic diversity of reptiles in the WSS (Table 2); and 2) cover the known geographic distribution of each taxon within the WSS.
Table 3 List of samples available for the current study for each species. Species identified according to external morphological characters. Uncertain id. indicates samples with uncertain morphological diagnosis. * indicates outgroup taxon of taxa occurring in the West Sahara-Sahel.
Family Species N Family Species N
Agamidae Agama agama 11 Lacertidae Acanthodactylus maculatus* 1
Agama boensis 3 Acanthodactylus margaritae* 1
Agama boueti 11 Acanthodactylus scutellatus 3
Agama boulengeri 12 Acanthodactylus taghitensis 3
Agama impalearis* 2 Latastia longicaudata 6
Agama paragama* 1 Mesalina guttulata 7
Agama tassiliensis* 1 Mesalina olivieri 12
Trapelus boehmei 17 Mesalina pasteuri 8
Trapelus mutabilis* 1 Mesalina rubropunctata 8
Uromastyx acanthinura* 1 Mesalina sp. nov. 12
Uromastyx dispar 13 Mesalina symoni* 1
Uromastyx geyri* 1 Uncertain id. 17
Uromastyx nigriventris 3 Lamprophiidae Boaedon fuliginosus 4
Uncertain id. 4 Boaedon lineatus* 1
Atractaspididae Atractaspis microlepidota 3 Rhagerhis moilensis 15
Uncertain id. 2 Rhamphiophis oxyrhynchus* 1
Boidae Gongylophis colubrinus* 1 Uncertain id. 1
Gongylophis jaculus* 1 Leptotyphlopidae Myriopholis algeriensis 2
Gongylophis muelleri 5 Phyllodactylidae Ptyodactylus oudrii* 4
Chamaeleonidae Chamaeleo africanus 3 Ptyodactylus ragazzi* 3
Chamaeleo chamaeleon* 2 Ptyodactylus rivapadiali 21
Chamaeleo gracilis* 1 Ptyodactylus togoensis 15
Colubridae Bamanophis dorri 7 Tarentola annularis 14
Crotaphopeltis hotamboeia* 1 Tarentola boehmei* 1
Dasypeltis sahelensis 2 Tarentola chazaliae 12
Dasypeltis scabra* 2 Tarentola deserti* 2
Hemorrhois algirus 8 Tarentola ephippiata 2
Hemorrhois hippocrepis* 1 Tarentola hoggarensis 22
Lytorhynchus diadema 5 Tarentola mauritanica* 1
Psammophis aegyptius* 2 Tarentola parvicarinata 15
Psammophis cf. rukwae 7 Tarentola senegambiae 16
Psammophis elegans 5 Uncertain id. 9
Psammophis mossambicus* 1 Pythonidae Python sebae 6
Psammophis schokari 16 Scincidae Chalcides boulengeri* 3
Spalerosophis diadema 4 Chalcides colosii* 1
Spalerosophis dolichospilus* 2 Chalcides delislei 2
Telescopus fallax* 1 Chalcides montanus* 1
Telescopus tripolitanus 5 Chalcides ocellatus* 2
Uncertain id. 22 Chalcides parallelus* 1
Crocodylidae Crocodylus niloticus* 1 Chalcides polylepis* 1
Uncertain id. 1 Chalcides sphenopsiformis 6
Elapidae Elapechis guentheri 1 Eumeces algeriensis* 1
Naja haje* 4 Scincopus fasciatus 2
Naja nigricollis 1 Scincus albifasciatus 3 Gekkonidae Hemidactylus angulatus 10 Trachylepis affinis* 2
Hemidactylus turcicus* 1 Trachylepis perrotetii 8
Stenodactylus mauritanicus 10 Trachylepis quinquetaeniata 8
Stenodactylus petrii 10 Sphaerodactylidae Pristurus adrarensis 2
Stenodactylus sthenodactylus 14 Testudinidae Centrochelys sulcata 2
Tropiocolotes algericus 7 Typhlopidae Indotyphlops braminus 2
Tropiocolotes steudneri* 1 Varanidae Varanus exanthematicus 12
Tropiocolotes tripolitanus 59 Varanus griseus 13
Uncertain id. 3 Varanus niloticus 10
Lacertidae Acanthodactylus aureus 13 Viperidae Bitis arietans 5
Acanthodactylus boskianus 8 Cerastes cerastes 16
Acanthodactylus busacki 4 Cerastes vipera 6
Acanthodactylus dumerilii 16 Echis leucogaster 15
Acanthodactylus longipes 17 Echis ocellatus* 1
Uncertain id. 1
2.3 Laboratory methods
Previous to DNA extraction, all samples were placed in Phosphate buffered saline (PBS) overnight at room temperature to remove possible contaminants which could act as inhibitors in the following reactions such as the PCR. Total genomic DNA was extracted using the QIAGEN’s EasySpin Kit or the QIAGEN‘s QIAmp® DNA MicroKit for the samples for which the amount of tissue was limited or the QIAGEN’S DNeasy Blood &Tissue Kit for samples that had enough tissue but it was expected lower quality DNA (tissue collected from dead animals or shed skin). The DNA from the museum samples was extracted by a technician from CTM laboratory, Diana Castro, following the protocol optimized by Dabney et al., (2013). Since DNA from museum samples are particularly susceptible to DNA contamination and are usually degraded, these DNA extractions and subsequent procedures (PCR) were performed in sterile and isolated rooms under special conditions optimized for the manipulation of low quality DNA. To evaluate the success of the DNA extractions, both DNA quality and quantity, electrophoresis was performed in 0,8% agarose gel dyed with GelRed™ (Biotium). The obtained DNA and subsequent dilutions were then stored at -20 ºC until further use.
A fragment of a mitochondrial gene (ca. 650 bp), cytochrome oxidase subunit I gene (COI) was amplified by polymerase chain reaction (PCR). The COI fragment was amplified using degenerate primers RepCOI-F (primer forward, 5’-TNTTMTCAACNAACCACAAAGA-3’) and RepCOI-R (primer reverse, 5’-ACTTCTGGRTGKCCAAARAATCA-3’) (Nagy et al., 2012), except for samples of Pristurus adrarensis where COI was amplified with the universal
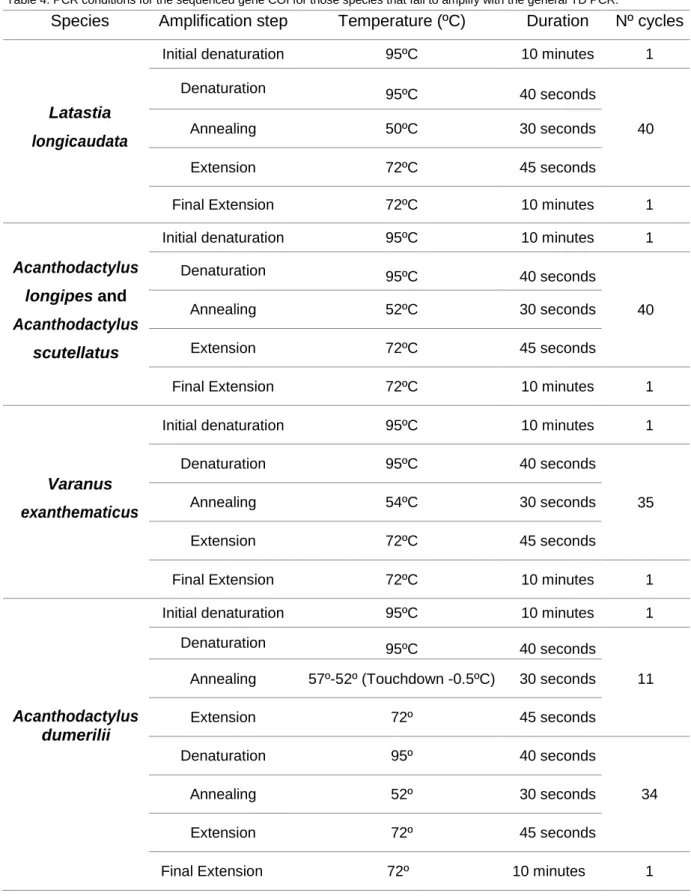
primers LCO1490 (primer forward, 5'-GGTCAACAAATCATAAAGATATTGG-3') and HC02198 (primer reverse, 5'-TAAACTTCAGGGTGACCAAAAAATCA-3') (Folmer et al., 1994). PCRs were performed using a total volume of 10 µl which contained: 5 µl of My Taq™ HS Mix 2X (Bioline), 3.2 µl of ultra-pure water, 0.4 µl of each primer from a primer solution of 10 µM and 1 µl of DNA extraction (~50 ng/µl). The amount of DNA used differed for some samples that had less DNA concentration (1.5-4 µl). In all the PCRs a negative control was used. A Touchdown (TD) PCR program was used to facilitate the amplification of multiple reptiles’ species. TD PCR allows a simple and fast way to optimize PCRs, increasing sensitivity, specificity and yield (Korbie and Mattick, 2008; Don et al., 1991), having a great applicability, particularly when using degenerate primers (Fietto et al., 2002; Levano-Garcia, Verjovski-Almeida and Da Silva, 2005). TD PCR was performed with the following conditions: initial denaturation at 95 °C for 10 min, followed by an initial phase of 9 cycles of 40 s of denaturation at 95 °C, 30 s of annealing at 52°C with a decrease in the annealing temperature by 0.5 ºC per cycle until the 48ºC and extension at 72 °C for 45 s, followed by a second phase with 31 cycles of 40 s of denaturation at 95 ºC, 30 s of annealing at 48ºC and elongation during 45 s at 72ºC, and a final extension cycle of 10 min at 72 °C. Adjustments of the temperature gradients were done for those species that fail to amplify with the general TD PCR. The final PCR conditions are present in Table 4.
Quality and quantity of PCR products were checked by visual examination in electrophoresis using 2% agarose gel. Successful PCR products were outsourced for sequencing to Beckman Coulter Genomics (Essex, UK). The forward primer was used for sequencing. The sequence chromatograms were visually inspected, assembled, and edited using Geneious Pro v.4.8.5 (Biomatters Ltd.). Sequences were aligned using the MUSCLE version implemented in Geneious Pro v.4.8.5 (Biomatters Ltd.) under default settings (Edgar, 2004). Since a protein coding gene was used, all sequences were translated into amino acids to aid during the alignment, and the original nucleotide sequences were used for later analyses. Gap positions were allowed under strict parameter settings. Sequences were checked for stop codons to detect the presence of nuclear DNA pseudogenes and trimmed to the same length. All COI sequences were transformed into unique haplotype data using the online tool DNA to haplotype collapser and converter implemented in Fabox 1.41 (Villesen, 2007) in order to reduce the computational time necessary for the subsequent analyses.
Different data sets were created in order to achieve the thesis goals. A data set, with all samples within and outside the study area was made in order to identify samples with dubious morphological assignments (e.g. shed skins, bones or tissue collected from dead animals). Once some of the dubious samples were correctly identified, the haplotypes were renamed to the correct species names. This dataset aims at identifying mtDNA lineages and potential cryptic species, as well as to construct a reference barcoding library for the study
region.
Table 4. PCR conditions for the sequenced gene COI for those species that fail to amplify with the general TD PCR.
Species Amplification step Temperature (ºC) Duration Nº cycles
Latastia longicaudata
Initial denaturation 95ºC 10 minutes 1
Denaturation 95ºC 40 seconds
Annealing 50ºC 30 seconds 40
Extension 72ºC 45 seconds
Final Extension 72ºC 10 minutes 1
Acanthodactylus longipes and Acanthodactylus
scutellatus
Initial denaturation 95ºC 10 minutes 1
Denaturation 95ºC 40 seconds
Annealing 52ºC 30 seconds 40
Extension 72ºC 45 seconds
Final Extension 72ºC 10 minutes 1
Varanus exanthematicus
Initial denaturation 95ºC 10 minutes 1
Denaturation 95ºC 40 seconds
Annealing 54ºC 30 seconds 35
Extension 72ºC 45 seconds
Final Extension 72ºC 10 minutes 1
Acanthodactylus dumerilii
Initial denaturation 95ºC 10 minutes 1
Denaturation 95ºC 40 seconds
Annealing 57º-52º (Touchdown -0.5ºC) 30 seconds 11
Extension 72º 45 seconds
Denaturation 95º 40 seconds
34
Annealing 52º 30 seconds
Extension 72º 45 seconds
2.4 Phylogenetic analysis
To highlight samples incorrectly identified a Bayesian inference was performed with BEAST v1.8.4 (Drummond et al., 2012) to construct a gene tree accounting for the best fitting nucleotide substitution models for COI (JC+I+G) suggested by jModeltest2 (Darriba et al., 2012) under the Bayesian Information Criteria. XML file was made with BEAUti v1.8.4 interface with the following settings: the closest nucleotide substitution model available in BEAST (HKY). All codon positions partitioned with unlinked base frequencies and substitution rates. An uncorrelated relaxed lognormal clock which allows the molecular rate to vary among lineages, was used. The use of uncorrelated relaxed lognormal clock did not attain convergence in any of the and therefore the Strict Clock was used instead. A speciation Yule Process model was used as tree prior. Operators were auto-optimized, and two independent runs were performed the chain length of Markov Chain Monte Carlo (MCMC) chain was 100 million generations, with a sampling every 10,000 generations. The convergence of the runs was verified by examining the effective sample sizes (ESSs) of all parameters using Tracer v1.6.0 (ESS > 200). Trees obtained from the two independent runs were merged using LogCombiner v1.8.4, where 10% of the trees were discarded as burn-in, the remaining trees were used to obtain the subsequent maximum clade credibility summary tree with posterior probabilities for each node using TreeAnnotator v1.8.4. The resulting consensus tree was visualized on FigTree v1.4.3.
The samples detected as incorrectly identified were renamed according to their position in the obtained tree topology.
2.5 Barcoding analysis
2.5.1 Distance based analysis
In order to estimate the identification success and, a series of genetic distance (Kimura 2- parameter model) thresholds were applied using the R package SPIDER v.1.3 (Brown et al., 2012). The nearest neighbour (NN) criterion, equivalent to the ‘Best Match’ method by Meier (Meier et al., 2006). was first employed. This method assigns any query to the species name of its best-matching barcode (reference sequence with lowest distance to that query) independently of the similarity between the query and barcode sequence. If the best- matching specie is the same as the individual being identified, the result is TRUE otherwise is FALSE (Brown and Collins, 2011). The name of the nearest match was recovered by setting the names argument of this function to TRUE.
Using these criteria misidentifications are common and in a way inevitable since some species will not have conspecific barcodes in the database (Will and Rubinoff, 2004). To
overcome this limitation, the threshID and Meier’s best close match were also performed. The threshID simulates the “species identification” method used by Bold (Ratnasingham and Hebert, 2007). The threshold based criterion (default of 1%) compares all specimens within the threshold of the query, and then assigns a diagnosis to each identification query: "correct"— within the threshold of the query all matches are the same species; "incorrect"— all matches are different species to the query; "ambiguous"— both correct and incorrect species matches within the threshold; "no id"—no matches to any individual within the threshold. The “best close match” also identifies the best barcode match to the query, similar to NN, but using, a threshold (default of 1%) thus having the same four identification categories as the threshID ("correct, incorrect, ambiguous, no id"). However, this function only looks at the single nearest-neighbour match, instead of all matches within the threshold (as with threshID and thus, the species name of the barcode is only given to the query if the similarity between them is sufficient, otherwise the query will stay as unidentified (Meier et
al., 2006). The Barcode of Life Data Systems (BOLD) identification tool, which assigns
identities using a threshold of 1% for animal species (Ratnasingham and Hebert, 2007), was also employed.
To evaluate the performance of the COI marker as a barcode in our dataset, a barcoding gap analysis was performed. The DNA barcoding gap, which is the maximum intraspecific distance of each species against its minimum distance to the nearest neighbour, was calculated for all species. To evaluate the presence of barcoding gap using the obtained alignments, a pairwise distance matrix between sequences based on Kimura’s two- parameter (K2P) model was created after which the statistics maxInDist (furthest intraspecific distance) and nonConDist (smallest interspecific distance) were applied using the R package SPIDER v.1.3 (Brown et al., 2012).
2.5.2 Tree based analysis: species and lineage identification
The phylogenetic species concept (PSC) (Eldredge and Cracraft, 1980) was employed to delimit putative species. A Bayesian implementation of the Poisson tree processes (bPTP) model for species delimitation, which relies on the branch lengths to infer putative species boundaries on a given phylogenetic input tree, was employed using the bPTP server (Zhang
et al., 2013) (http://species.h-its.org/ptp/). The parameters used were the following: MCMC,
500,000 generations; thinning, 100; burn-in, 0.1; seed, 123, and convergence was assessed in each case to guarantee the reliability of the results.
Together with the PTP approach, a 9.5 % divergence threshold based on uncorrected genetic distances (p-distances) was applied for determining the species identity in cases of cryptic diversity. Both intra- and interspecific uncorrected p-distances were calculated in MEGA7 (Kumar, Stecher, and Tamura, 2016). With these genetic distance matrix, Excalibar
(Aliabadian et al., 2014) was then employed to retrieve the intra- and interspecific genetic distances. To obtain a final delimitation of reptile phylogenetic units occurring in the West Sahara-Sahel, a threshold of 2.5 % divergence was used to identify mitochondrial lineages.
2.6 Distribution of phylogenetic units and diversity
The distribution of the phylogenetic units found in WSS was mapped using ArGIS Geographical Information System (GIS). Distribution maps were produced depicting the geographic locations of species, including the new candidate species, and their respective lineages. The distribution maps also included additional locations from un-sequenced samples from the respective species/candidate species. These data were also collected by BIODESERTS researchers and collaborators.
The distribution of reptile diversity was quantified for several taxonomy levels: families, genera, species and lineages. Initially, ecoregions occurring in the WSS were extracted from the 2017 version of the Terrestrial Ecoregions of the World (Dinerstein et al., 2017) and mountains were manually digitised from topographic maps. Then, ArcGIS was used to combine both data files and to generate a unique raster file depicting regions within the WSS. In ArcGIS, each sequenced sample was then intersected with the raster of ecoregions/mountains (Figure 3) to extract the respective region where each sample occurs. Finally, it were summarized the number of families, genera, species and lineages that occurs in each of the regions. Mapping of species richness at coarser resolutions has the advantage of diminishing potential biases in sampling efforts and provides relevant understanding and visualization of regional patterns (Graham and Hijmans, 2006).
Given that the available area of each zone is distinct (Table 2), it was plotted the relationships between number of families, genera, species and lineages according to the area of each zone. This approach allowed exploring potential species-area relationships, which may affect the spatial patterns in the distribution of richness (Rosenzweig, 1995; Dengler, 2009).
2.7 Gap analysis
Polygons depicting the location of current protected areas in the WSS (Figure 5 and Table 5) were downloaded from the World Database on Protected Areas (IUCN & UNEP-WCMC, 2017) and converted to raster format at 1x1 km grid cell size. This raster file was overlapped with a raster file depicting the location of mountains and ecoregions. The current levels of protection of each region were quantified, which allowed identifying areas accumulating high phylogenetic diversity missing from the current network of protected areas in the WSS, as well as identifying putative areas that should also be classified to conserve reptile phylogenetic diversity.
Figure 5. Location of Protected Areas in the West-Sahara-Sahel distinguishing between areas fully implemented and under discussion, and distinct categories of protection (Adapted from IUCN & UNEP-WCMC, 2017).
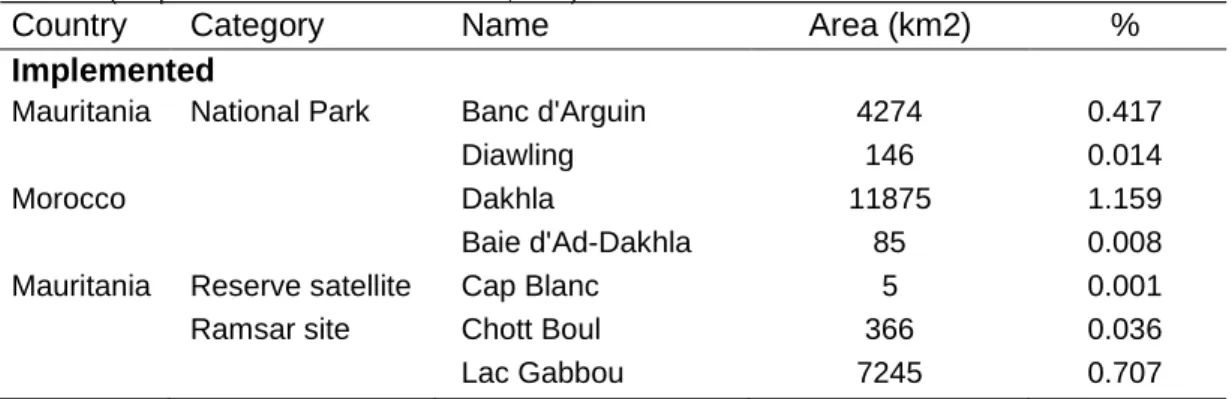
Table 5. List of Protected Areas in the West Sahara-Sahel, including the status (implemented or under discussion), category, name, and area (Adapted from IUCN & UNEP-WCMC, 2017).
Country Category Name Area (km2) %
Implemented
Mauritania National Park Banc d'Arguin 4274 0.417
Diawling 146 0.014
Morocco Dakhla 11875 1.159
Baie d'Ad-Dakhla 85 0.008
Mauritania Reserve satellite Cap Blanc 5 0.001
Ramsar site Chott Boul 366 0.036
Under discussion
Mauritania National Park El Agher 442 0.043
Guelb er Richât 6750 0.659
Lac de Mâl 14 0.001
Tâmourt Bougâri 7 0.001
Mahmoudé 191 0.019
Reserve satellite Baie de l'Etoile 8 0.001
Ramsar site Tâmourt Chlim 1 0.000
Gaât Sawana 7 0.001
Tâmourt Oum Lelli 1 0.000
Wetland Mare de Boubleine 6 0.001
Oued Kankossa 16 0.002 Lac d'Aleg 51 0.005 Mare de Chôgar 1 0.000 Foum Gleita 120 0.012 Koundel 3 0.000 Toulel 3 0.000 Barrage de Melga 1 0.000 Tâmourt Dendaré 1 0.000 Tâmourt Kerk 1 0.000 Tâmourt Touf 2 0.000 Tâmourt Tourh 6 0.001 Tombaré 1 0.000 Vani 7 0.001 Tâmourt Tîntâne 1 0.000 Tâmourt Zoueina 1 0.000 Lac de R'Kiz 82 0.008 TOTAL Protected 31719 3.096
3. Results
3.1 Laboratory methods
From the initial 755 samples, 684 were extracted and amplified. A total of 542 COI sequences were successfully amplified (ca. 80% of the samples), with 624 base pairs were retrieved from 96 reptile species (of which 63 are from the WSS). With the primers RepCOI-F and RepCOI-R 540 fragments were obtain from the amplified samples whereas LCO and HCO was only used for the amplification of two samples and both were successfully amplified. For the following species no COI fragment was recovered due to PCR failure: these included the outgroup Crocodylus niloticus and four species that occur in the WSS, Acanthodactylus
aureus, Acanthodactylus scutellatus, Dasypeltis sahelensis and Rhamphiophis oxyrhynchus. In other species there was failure in recovering readable sequences of COI
fragments: these included outgroups Agama tassiliensis, Chalcides montanus, Chalcides
polylepis, Gongylophis colubrinus, Hemidactylus turcicus, Mesalina symoni, Trachylepis affinis and Tropiocolotes steudneri. For Elapechis guentheri and Varanus exanthematicus
amplifications were obtained but sequences were not readable. In the cases of the outgroups
Chalcides ocellatus, Acanthodactylus maculatus, Acanthodactylus margaritae, Agama paragama, Chalcides colosii, Chalcides parallelus, Chamaeleo gracilis, Crotaphopeltis hotamboeia, Echis ocellatus, Eumeces algeriensis, Hemorrhois hippocrepis, Psammophis mossambicus and Trapelus mutabilis only a single sequence was obtained. In three species
occurring in the WSS, Acanthodactylus longipes, Centrochelys sulcata and Myriopholis
algeriensis, only a single sequence was retrieved from a sample collected outside the study
area.
No insertions, deletions or stop codons were detected, supporting the absence of nuclear pseudogene amplification (Pereira and Baker, 2004).
3.2 Phylogenetic analysis
The Bayesian inference allowed to identify 27 samples from 18 different species: two samples from two outgroups species, eight samples from five species collected outside the study area, and 17 samples from WSS belonging to 11 species as morphologically incorrectly identified. One of the samples collected in the study area, putatively identified in the field as Agama boueti, in fact clustered with Agama impalearis from northern Morocco, suggesting the presence of a new species in the WSS. A total of 28 samples from 17 species (four samples from three outgroups + seven samples from outside the study area + 17 samples from 10 species of the WSS) had uncertain identification, which was solved by identifying them according to the species to which they clustered in the tree obtained.
3.3 Barcoding analyses
3.3.1 Distance based analyses
The rates of identification success varied among the different distance-based methods applied (Near Neighbour, ThreshID, best close match and BOLD best ID) (Annexes, Table A 1) and between the analyses using all haplotypes and the ones excluding singletons. Concerning the Near Neighbour criteria, identification success ranged from 92% to 99% when excluding singletons, with only four sequences recovered as incorrectly identified. Regarding the threshID criteria, when applying a 1% threshold the identification success varied from 69% to 74% (excluding singletons) with zero sequences incorrectly identified in both cases. When using a 10% threshold 75% to 80% (excluding singletons), eight sequences where incorrectly identified but seven of them were singletons. Since these species are only represented by a single sequence, their match with a conspecific sequence was not possible. The best close match criterion showed an identification success rate from 69% to 74% (excluding singletons) but no sequence resulted incorrect or ambiguous. The BOLD best ID only was able to identify 10% of the specimens, highlighting the lack of COI barcode for the reptiles from WSS.
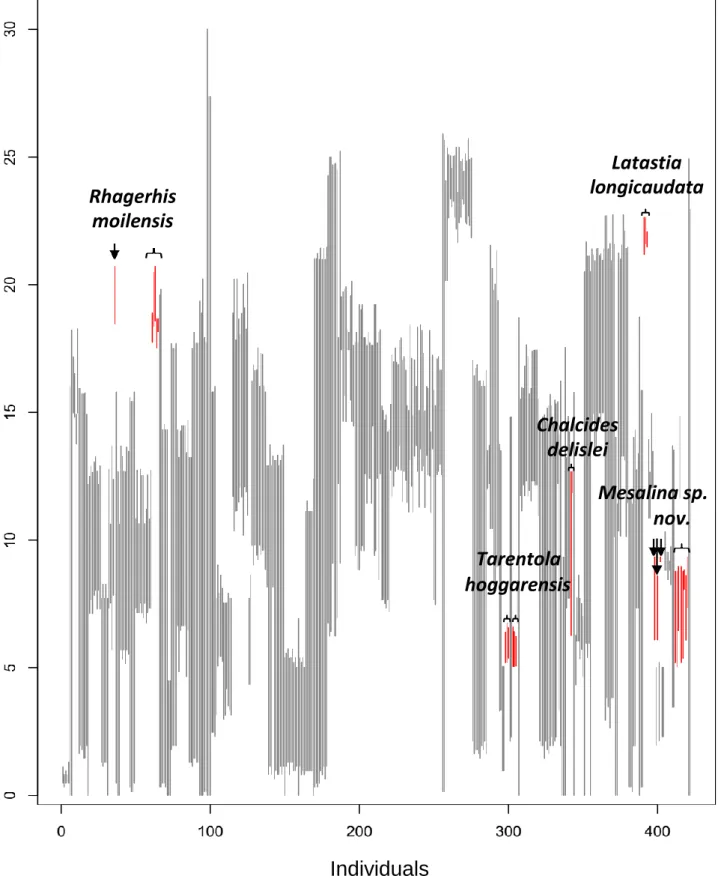
The barcoding gap was largely present in our dataset (Figure 6), highlighting the effectiveness of this COI fragment as a barcode marker. However, no barcoding gap was observed for Rhagerhis moilensis, Tarentola hoggarensis, Chalcides delislei, Mesalina sp.